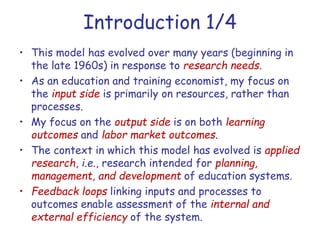
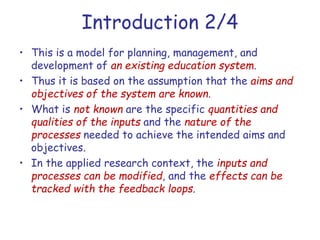
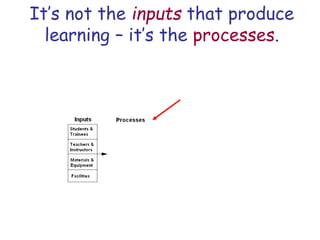
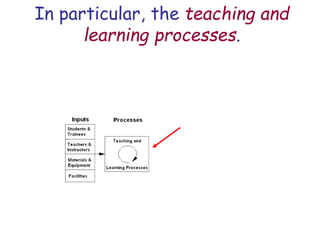
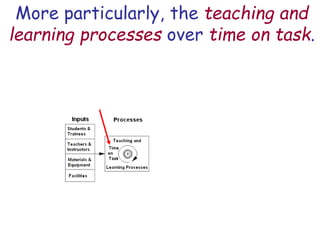
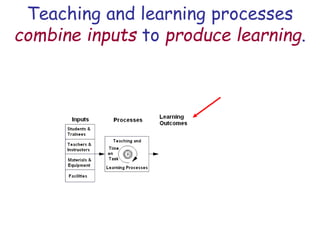
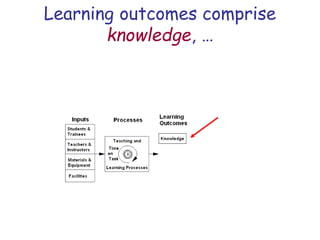
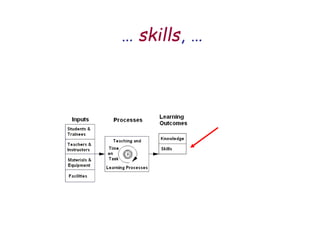
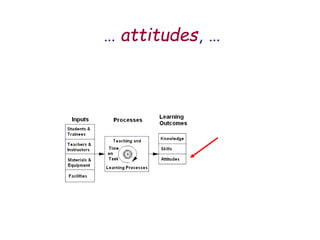
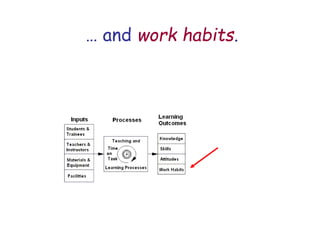
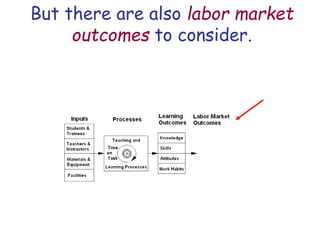
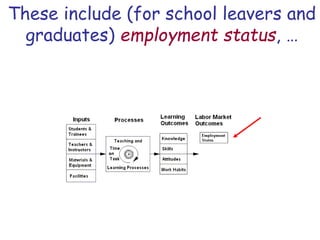
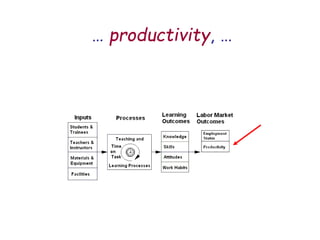
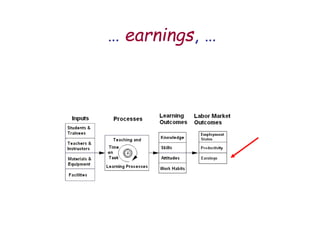
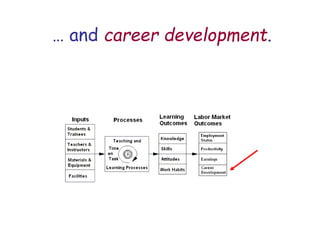
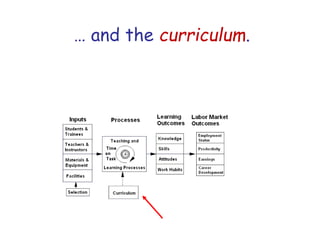
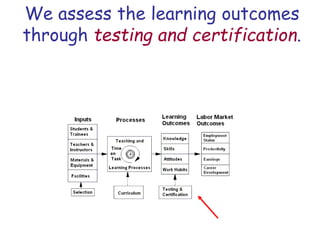
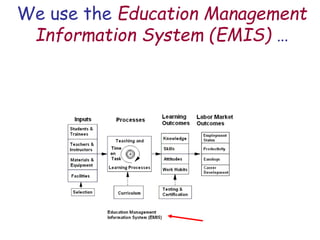
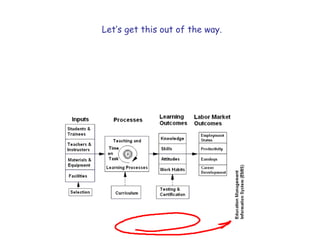
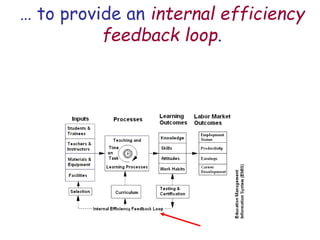
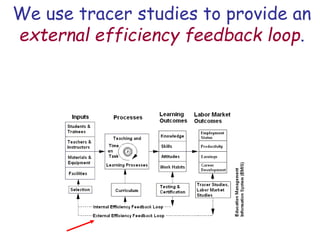
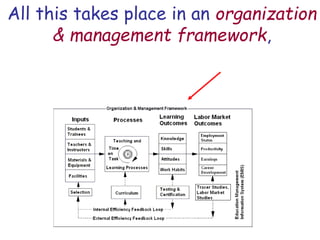
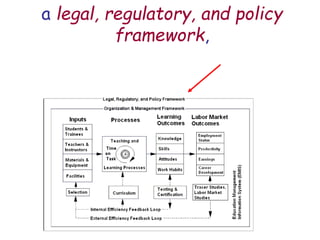
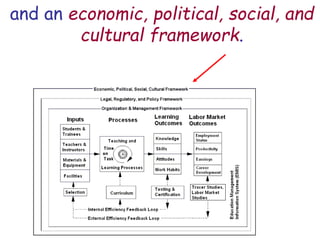
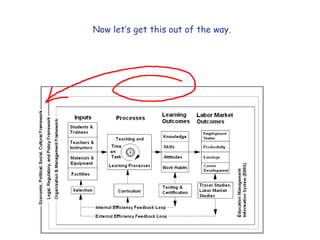
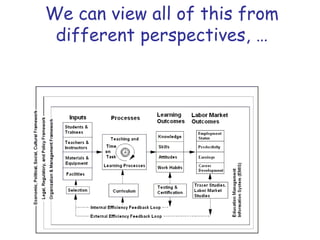
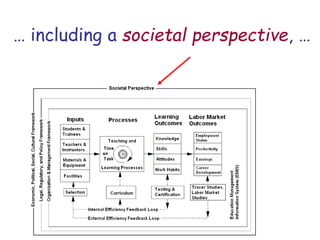
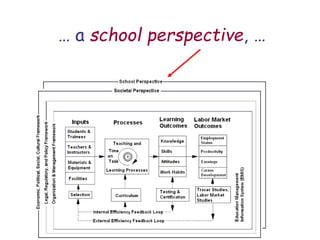
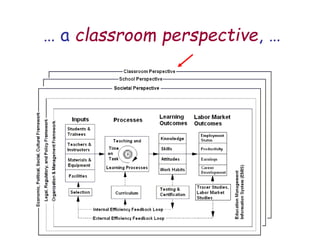
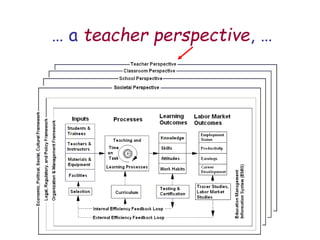
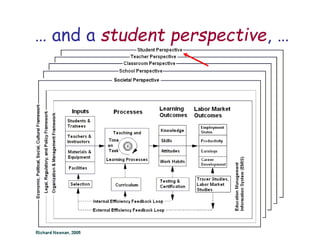
A Model of School
Learning:
A Presentation on School System
Monitoring and Evaluation
Richard Noonan, August 30, 2013
Introduction 1/4
• This model has evolved over many years (beginning in
the late 1960s) in response to research needs.
• As an education and training economist, my focus on
the input side is primarily on resources, rather than
processes.
• My focus on the output side is on both learning
outcomes and labor market outcomes.
• The context in which this model has evolved is applied
research, i.e., research intended for planning,
management, and development of education systems.
• Feedback loops linking inputs and processes to
outcomes enable assessment of the internal and
external efficiency of the system.
Introduction 2/4
• This is a model for planning, management, and
development of an existing education system.
• Thus it is based on the assumption that the aims and
objectives of the system are known.
• What is not known are the specific quantities and
qualities of the inputs and the nature of the
processes needed to achieve the intended aims and
objectives.
• In the applied research context, the inputs and
processes can be modified, and the effects can be
tracked with the feedback loops.
Introduction 3/4
• Finally, a word of caution:
– As every social science student learns in Statistics 101,
correlation does not imply causation. An observed correlation
can represent the “causal effect” of X on Y, or the effect of Z
on both X and Y, or more complicated effect relationships.
– An observed correlation can also be the consequence of how we
allocate resources (the “allocation effect”). To simplify
greatly:
• If we put high-achievers in well-resourced schools and low-achievers in
poorly-resourced schools (elitist resource allocation), we will certainly see a
positive correlation between resources and school learning outcomes;
• If we put both high-achievers and low-achievers in moderately well-
resourced schools (egalitarian resource allocation), the correlation will be
close to 0 but probably positive;
• If we provide additional pedagogical support to low-achievers
(compensatory resource allocation), we are likely to observe a negative
correlation between resources and school learning outcomes, even if the
causal effect is positive!
Introduction 4/4
• In survey research, the use of multivariate statistical
analysis can be of some help in sorting out the causal
effect from the allocation effect, but there is no
assurance that the allocation effect is completely
controlled.
• Carefully controlled “experimental design”*, supported
by propensity analysis, is probably the strongest tool
we have today for disentangling the causal effect from
the allocation effect.
* I use quotation marks because a true experimental
design, as idealized in the natural sciences, is not really
possible in the real social-economic-political world. You
just do the best you can and try in the data analysis to
control for the aberration.
What are the key
indicators needed to
support decision making
in the planning,
management and
development of
education system?
As an economist, I think first of
inputs.
The students and trainees are the
most important inputs.
The teachers and instructors are
next most important inputs.
Materials and equipment are next
most important.
Facilities are less important (but not
unimportant).
It’s not the inputs that produce
learning – it’s the processes.
In particular, the teaching and
learning processes.
More particularly, the teaching and
learning processes over time on task.
Teaching and learning processes
combine inputs to produce learning.
Learning outcomes comprise
knowledge, …
… skills, …
… attitudes, …
… and work habits.
But there are also labor market
outcomes to consider.
These include (for school leavers and
graduates) employment status, …
… productivity, …
… earnings, …
… and career development.
We plan and manage the system
through the selection of inputs …
… and the curriculum.
We assess the learning outcomes
through testing and certification.
We use the Education Management
Information System (EMIS) …
Let’s get this out of the way.
… to provide an internal efficiency
feedback loop.
We use tracer studies to provide an
external efficiency feedback loop.
All this takes place in an organization
& management framework,
a legal, regulatory, and policy
framework,
and an economic, political, social, and
cultural framework.
Now let’s get this out of the way.
We can view all of this from
different perspectives, …
… including a societal perspective, …
… a school perspective, …
… a classroom perspective, …
… a teacher perspective, …
… and a student perspective, …
If you think this is
complicated, try teaching in
a classroom or managing a
school or, even worse,
managing a national
education and training
system!
This is not the end:
it is a beginning.
Acknowledgements
• The first version of this model was based on J. B.
Carroll (1963): “A Model of School Learning”.
Teachers College Record. 64(723-733).
• The clock is placed in the Processes box as a
reference to the seminal paper by B. S. Bloom, (1968).
“Learning for Mastery”. Evaluation Comment. 1(2),
University of California at Los Angeles, Center for
the Study of Evaluation.
• For the evolution of this model I owe a great debt to
my students and colleagues at Stockholm University,
Institute for International Education, and to my
friends and colleagues from research and consulting
missions around the world.

A Model of School Learnin

  • 1.
    A Model ofSchool Learning: A Presentation on School System Monitoring and Evaluation Richard Noonan, August 30, 2013
  • 2.
    Introduction 1/4 • Thismodel has evolved over many years (beginning in the late 1960s) in response to research needs. • As an education and training economist, my focus on the input side is primarily on resources, rather than processes. • My focus on the output side is on both learning outcomes and labor market outcomes. • The context in which this model has evolved is applied research, i.e., research intended for planning, management, and development of education systems. • Feedback loops linking inputs and processes to outcomes enable assessment of the internal and external efficiency of the system.
  • 3.
    Introduction 2/4 • Thisis a model for planning, management, and development of an existing education system. • Thus it is based on the assumption that the aims and objectives of the system are known. • What is not known are the specific quantities and qualities of the inputs and the nature of the processes needed to achieve the intended aims and objectives. • In the applied research context, the inputs and processes can be modified, and the effects can be tracked with the feedback loops.
  • 4.
    Introduction 3/4 • Finally,a word of caution: – As every social science student learns in Statistics 101, correlation does not imply causation. An observed correlation can represent the “causal effect” of X on Y, or the effect of Z on both X and Y, or more complicated effect relationships. – An observed correlation can also be the consequence of how we allocate resources (the “allocation effect”). To simplify greatly: • If we put high-achievers in well-resourced schools and low-achievers in poorly-resourced schools (elitist resource allocation), we will certainly see a positive correlation between resources and school learning outcomes; • If we put both high-achievers and low-achievers in moderately well- resourced schools (egalitarian resource allocation), the correlation will be close to 0 but probably positive; • If we provide additional pedagogical support to low-achievers (compensatory resource allocation), we are likely to observe a negative correlation between resources and school learning outcomes, even if the causal effect is positive!
  • 5.
    Introduction 4/4 • Insurvey research, the use of multivariate statistical analysis can be of some help in sorting out the causal effect from the allocation effect, but there is no assurance that the allocation effect is completely controlled. • Carefully controlled “experimental design”*, supported by propensity analysis, is probably the strongest tool we have today for disentangling the causal effect from the allocation effect. * I use quotation marks because a true experimental design, as idealized in the natural sciences, is not really possible in the real social-economic-political world. You just do the best you can and try in the data analysis to control for the aberration.
  • 6.
    What are thekey indicators needed to support decision making in the planning, management and development of education system?
  • 7.
    As an economist,I think first of inputs.
  • 8.
    The students andtrainees are the most important inputs.
  • 9.
    The teachers andinstructors are next most important inputs.
  • 10.
    Materials and equipmentare next most important.
  • 11.
    Facilities are lessimportant (but not unimportant).
  • 12.
    It’s not theinputs that produce learning – it’s the processes.
  • 13.
    In particular, theteaching and learning processes.
  • 14.
    More particularly, theteaching and learning processes over time on task.
  • 15.
    Teaching and learningprocesses combine inputs to produce learning.
  • 16.
  • 17.
  • 18.
  • 19.
    … and workhabits.
  • 20.
    But there arealso labor market outcomes to consider.
  • 21.
    These include (forschool leavers and graduates) employment status, …
  • 22.
  • 23.
  • 24.
    … and careerdevelopment.
  • 25.
    We plan andmanage the system through the selection of inputs …
  • 26.
    … and thecurriculum.
  • 27.
    We assess thelearning outcomes through testing and certification.
  • 28.
    We use theEducation Management Information System (EMIS) …
  • 29.
    Let’s get thisout of the way.
  • 30.
    … to providean internal efficiency feedback loop.
  • 31.
    We use tracerstudies to provide an external efficiency feedback loop.
  • 32.
    All this takesplace in an organization & management framework,
  • 33.
    a legal, regulatory,and policy framework,
  • 34.
    and an economic,political, social, and cultural framework.
  • 35.
    Now let’s getthis out of the way.
  • 36.
    We can viewall of this from different perspectives, …
  • 37.
    … including asocietal perspective, …
  • 38.
    … a schoolperspective, …
  • 39.
    … a classroomperspective, …
  • 40.
    … a teacherperspective, …
  • 41.
    … and astudent perspective, …
  • 42.
    If you thinkthis is complicated, try teaching in a classroom or managing a school or, even worse, managing a national education and training system!
  • 43.
    This is notthe end: it is a beginning.
  • 44.
    Acknowledgements • The firstversion of this model was based on J. B. Carroll (1963): “A Model of School Learning”. Teachers College Record. 64(723-733). • The clock is placed in the Processes box as a reference to the seminal paper by B. S. Bloom, (1968). “Learning for Mastery”. Evaluation Comment. 1(2), University of California at Los Angeles, Center for the Study of Evaluation. • For the evolution of this model I owe a great debt to my students and colleagues at Stockholm University, Institute for International Education, and to my friends and colleagues from research and consulting missions around the world.