Download to read offline


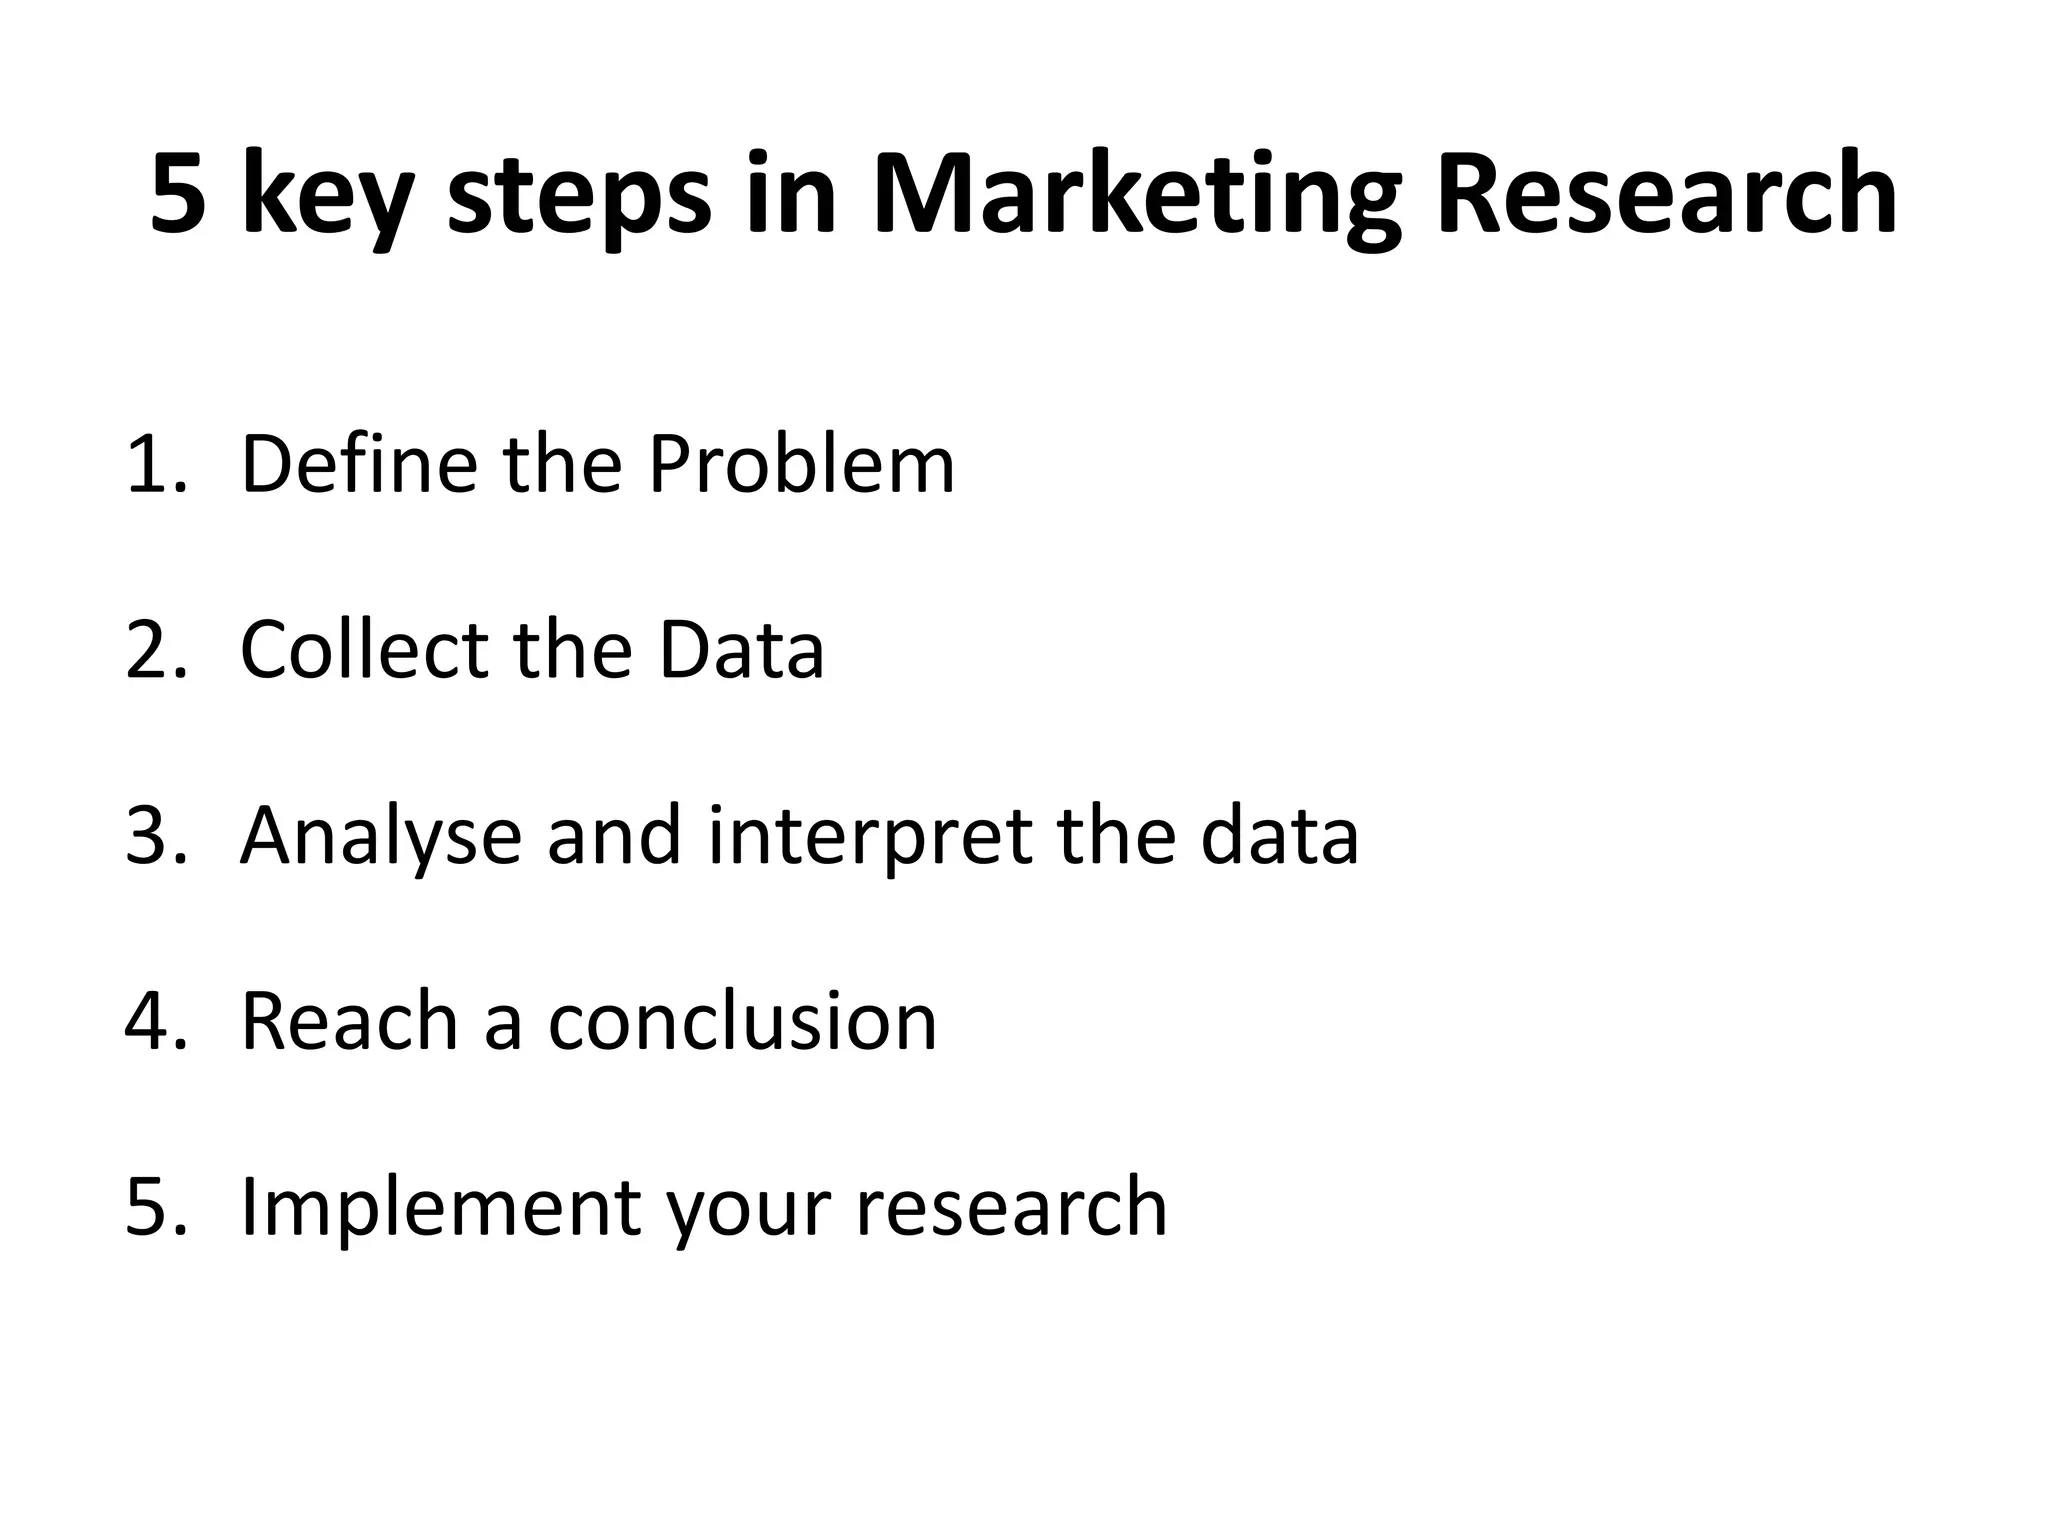
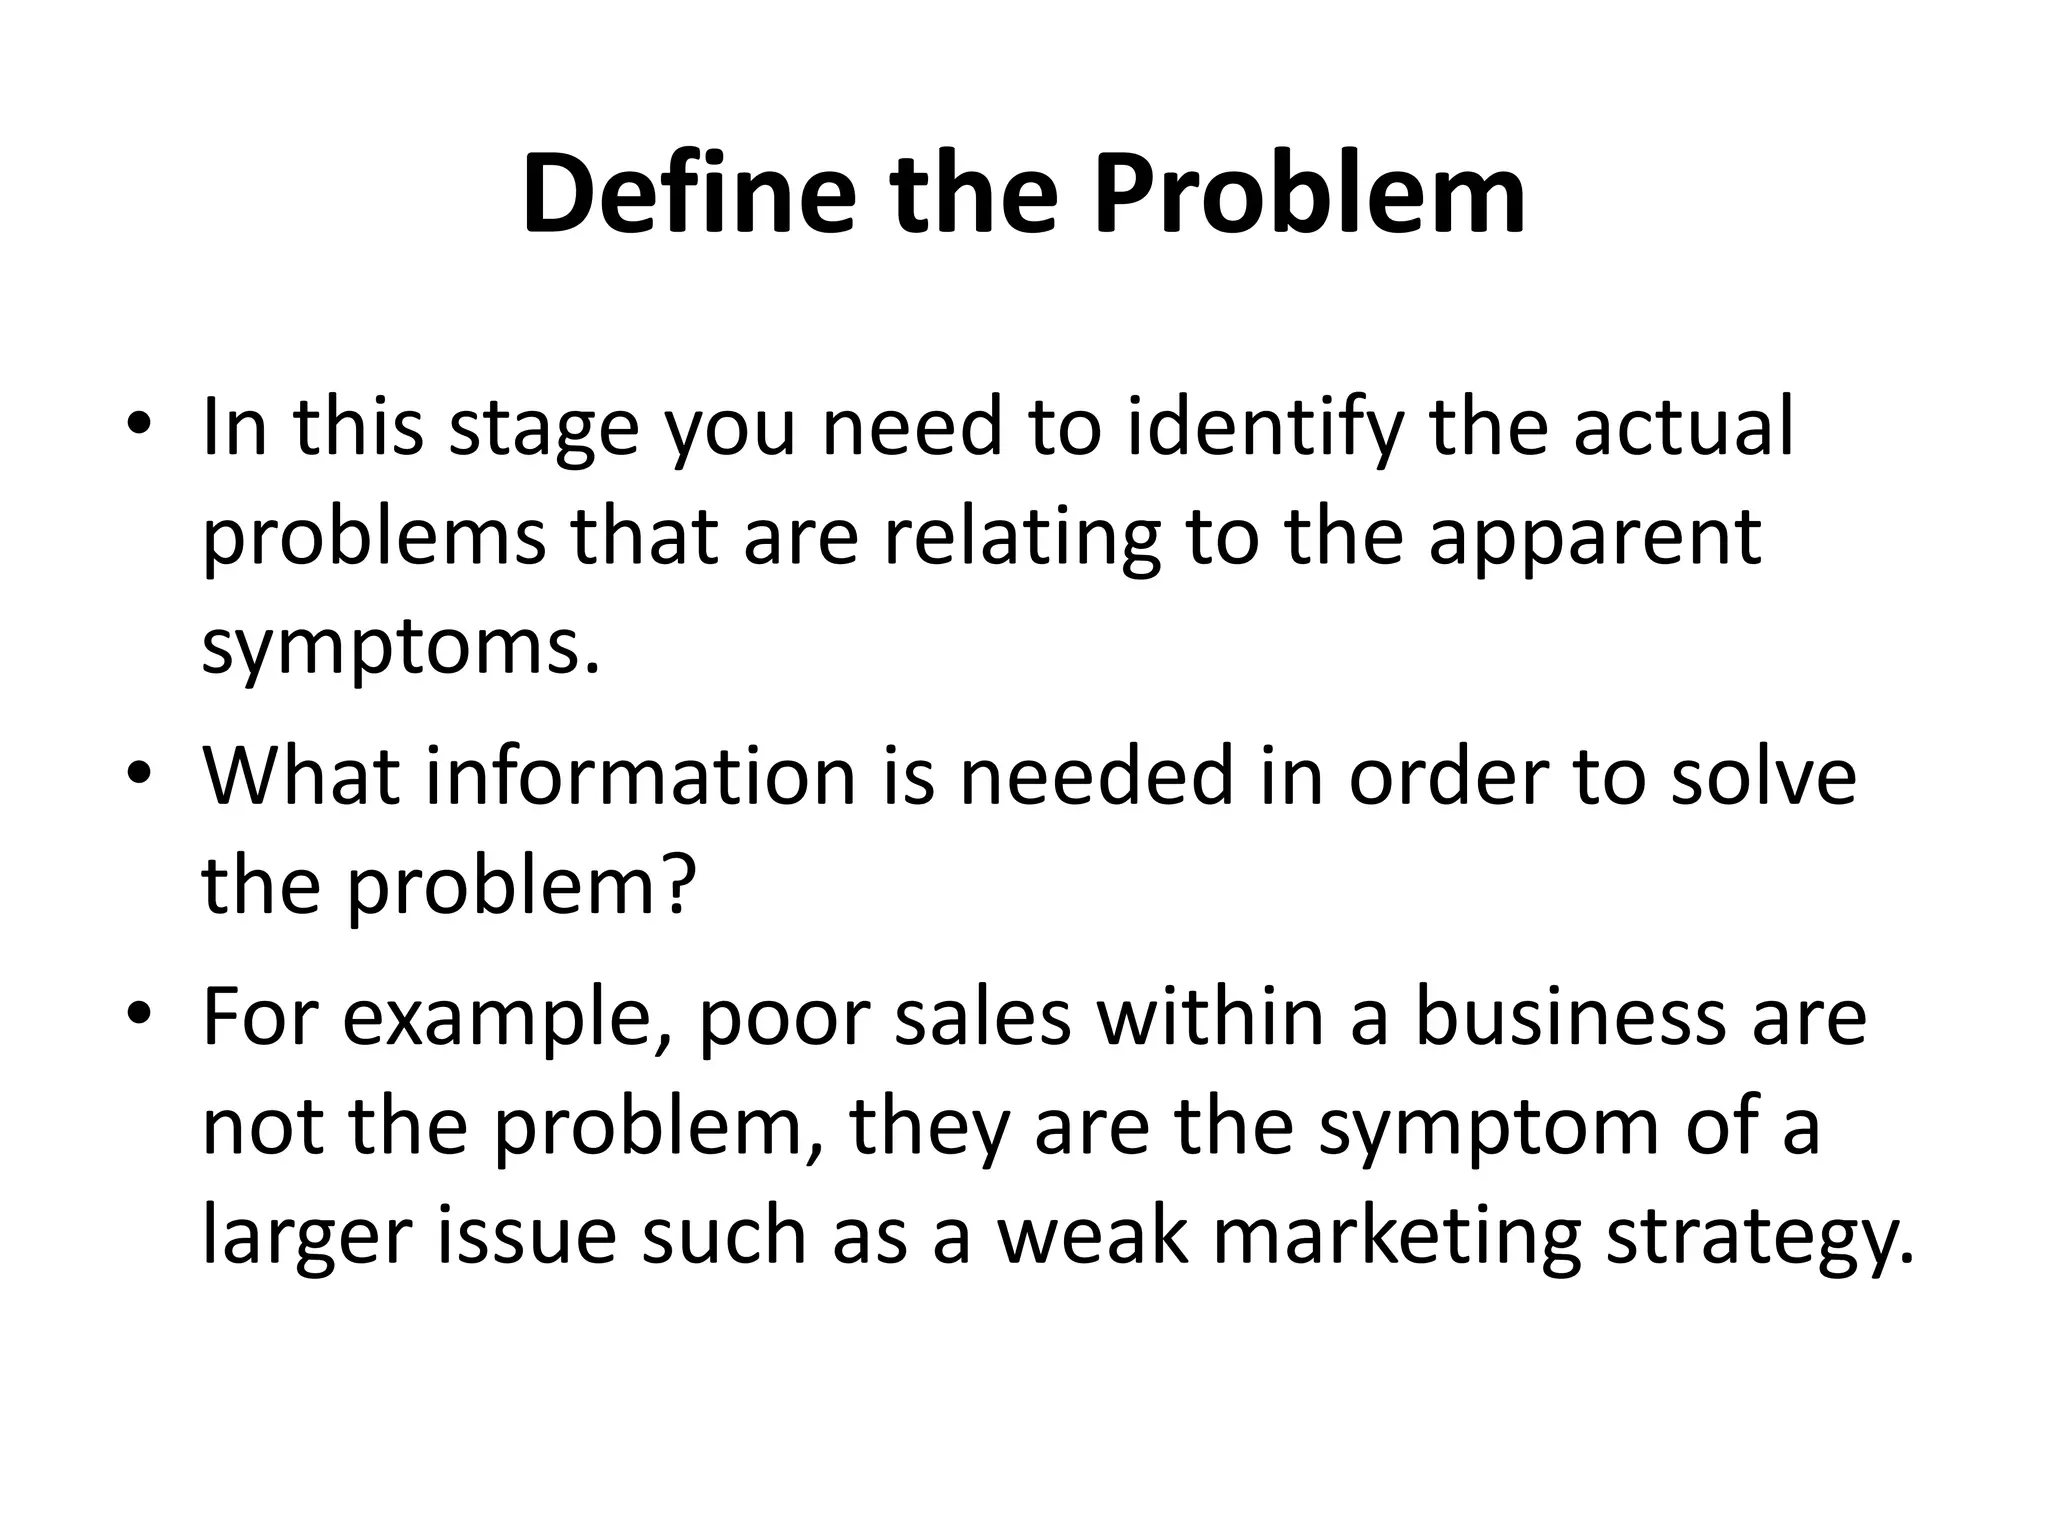

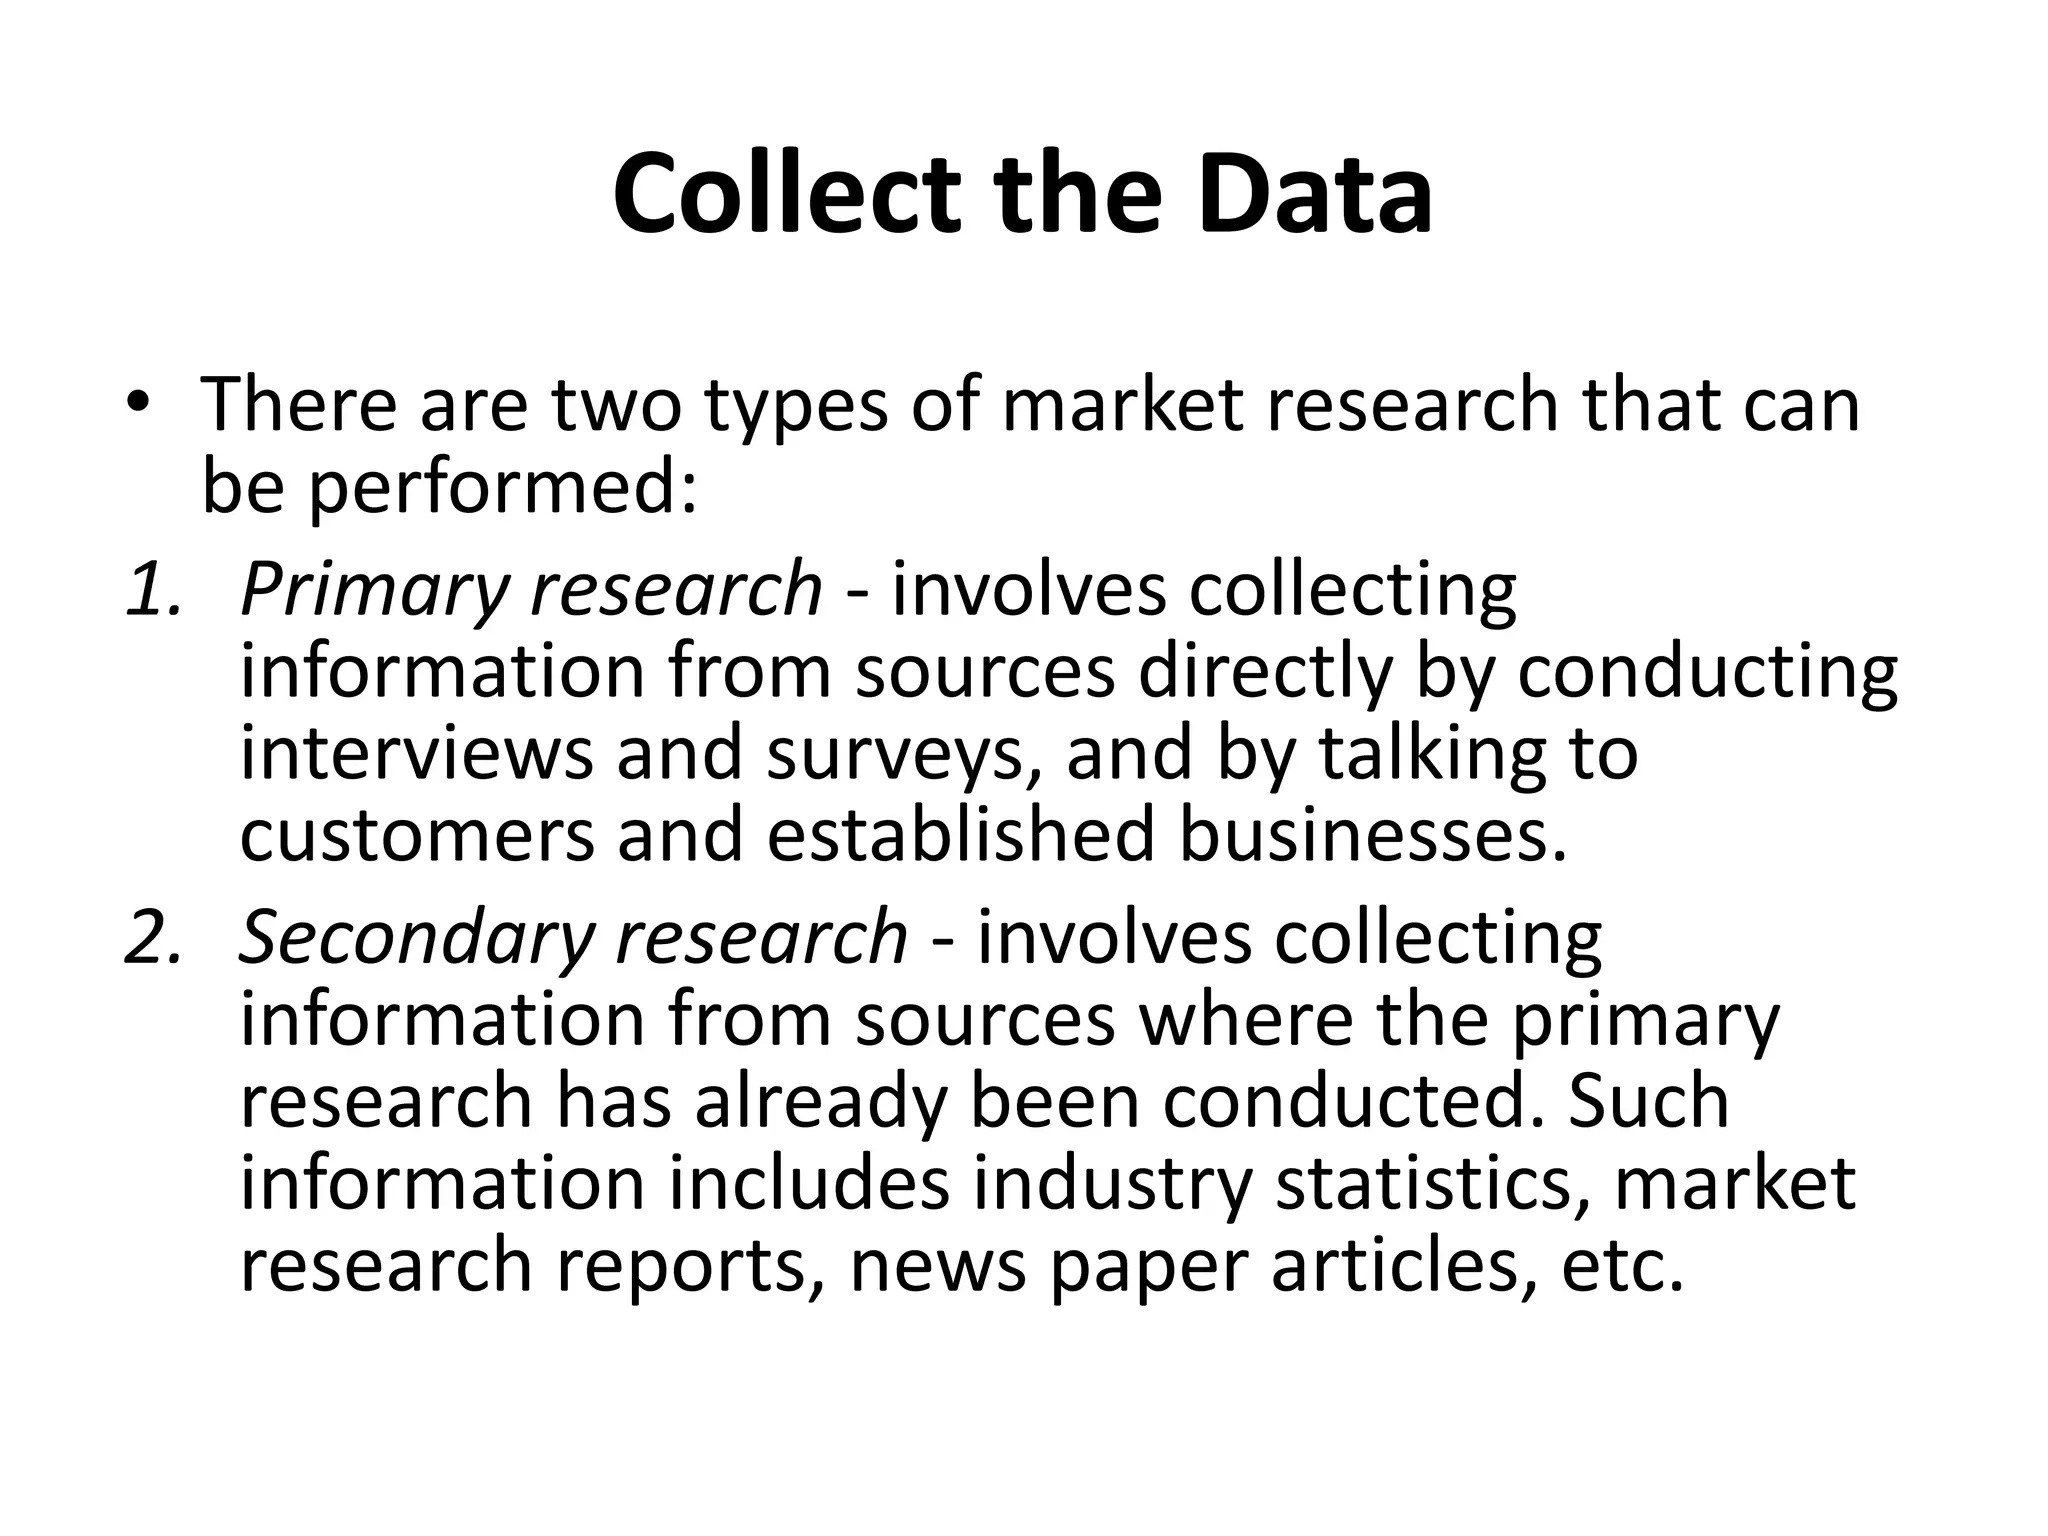
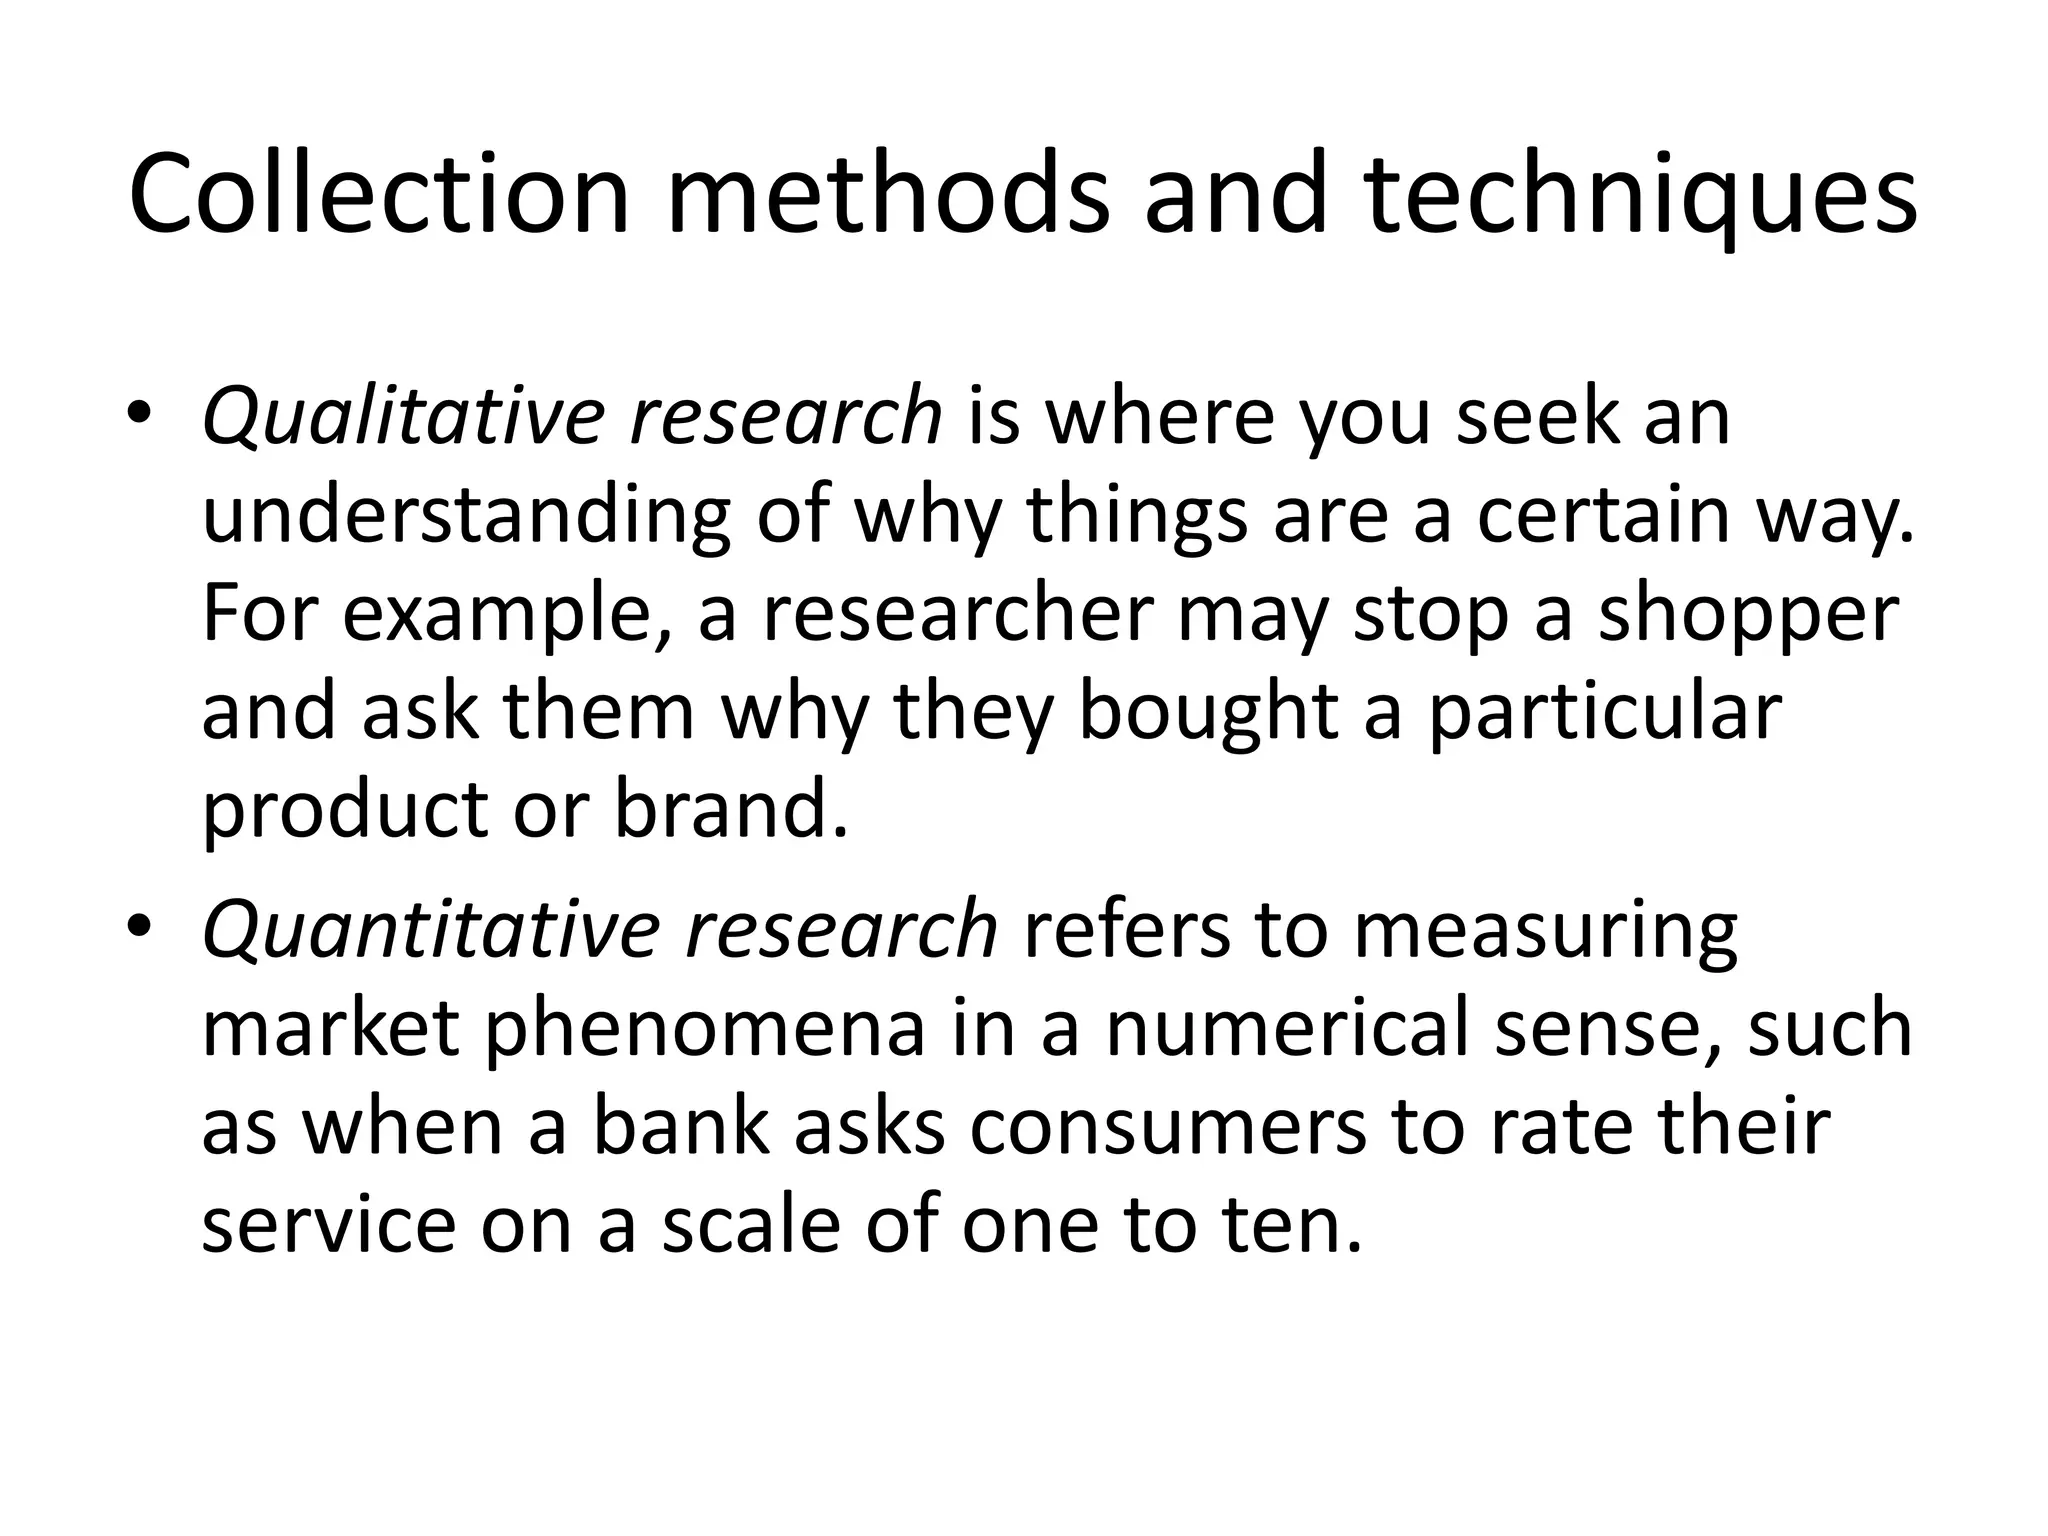


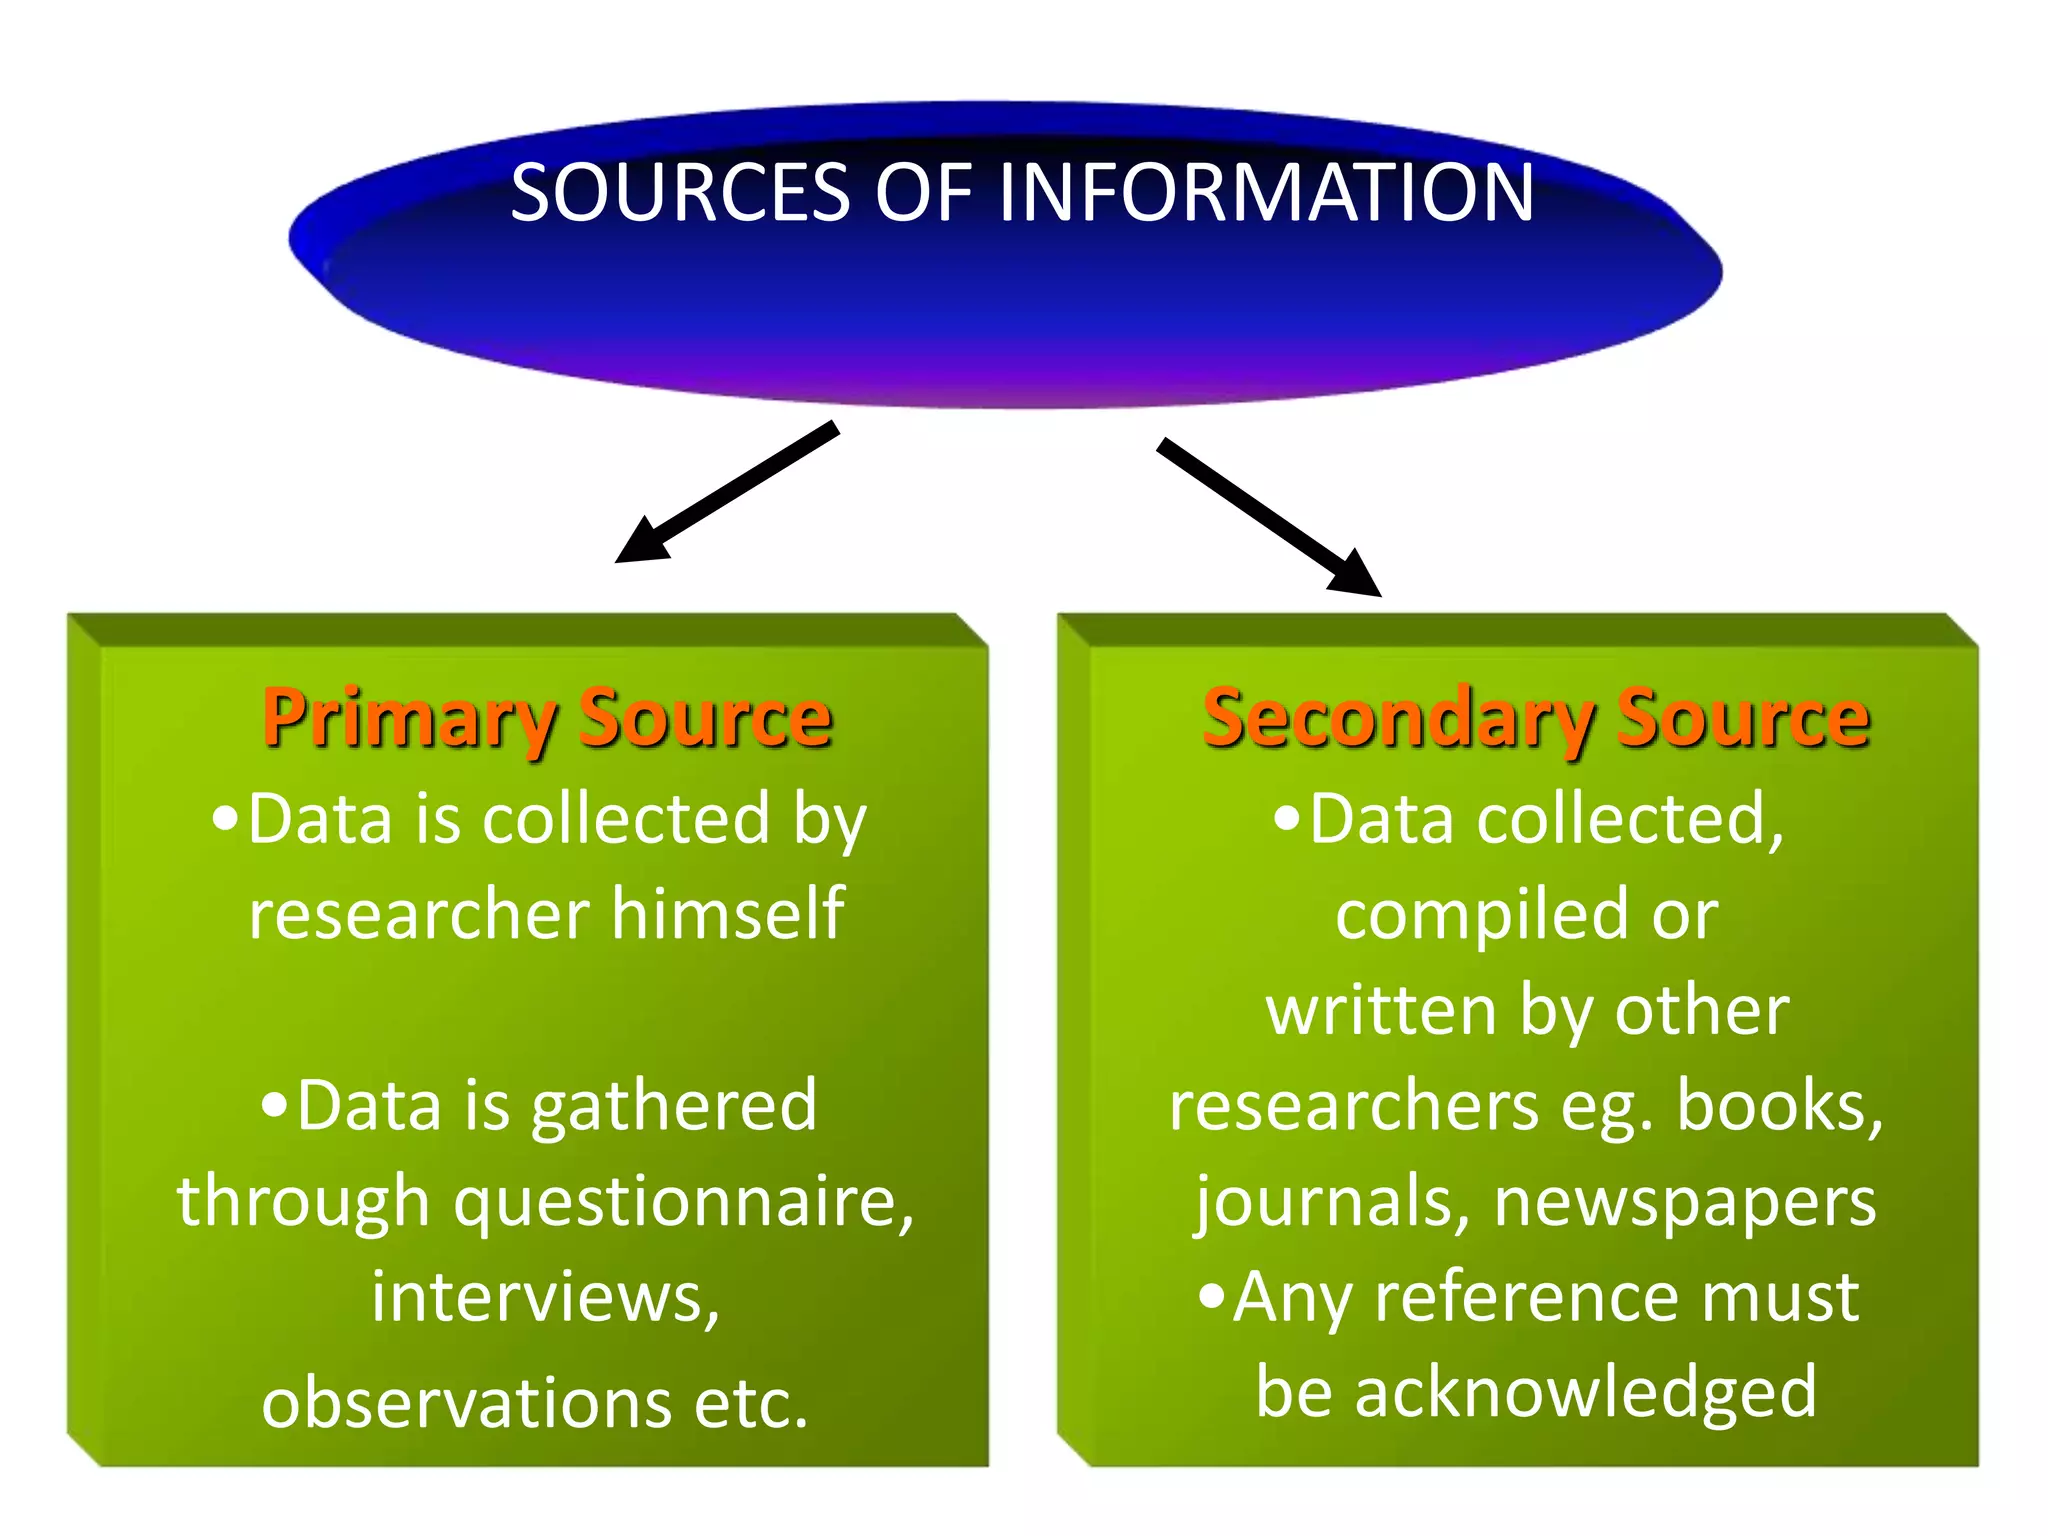
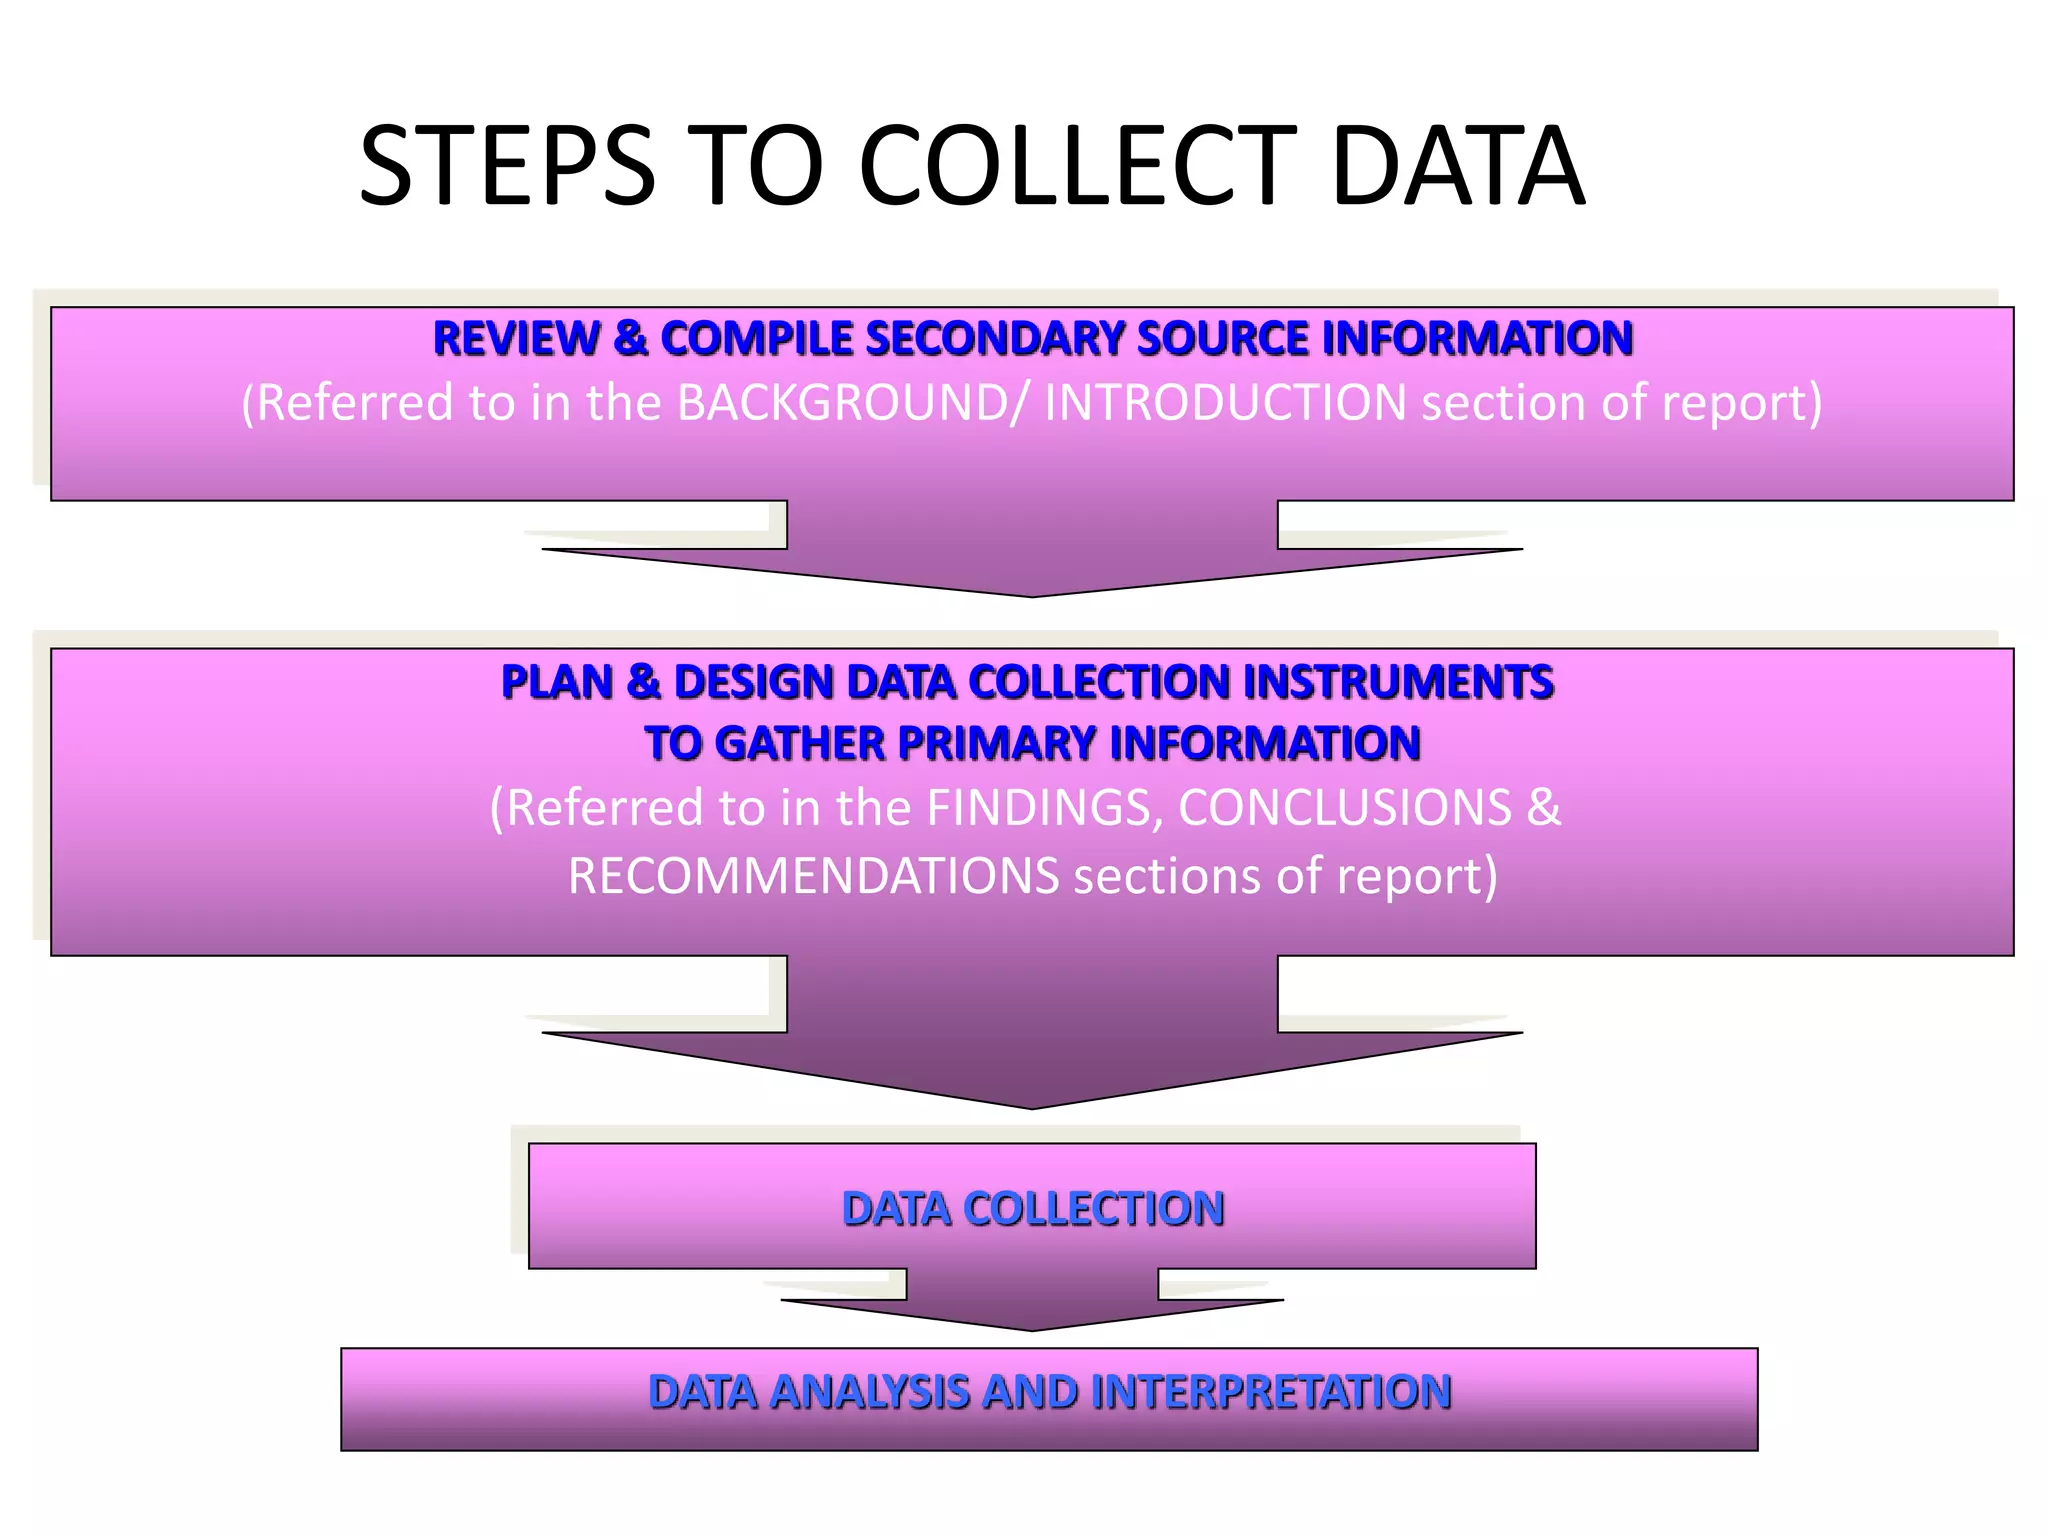
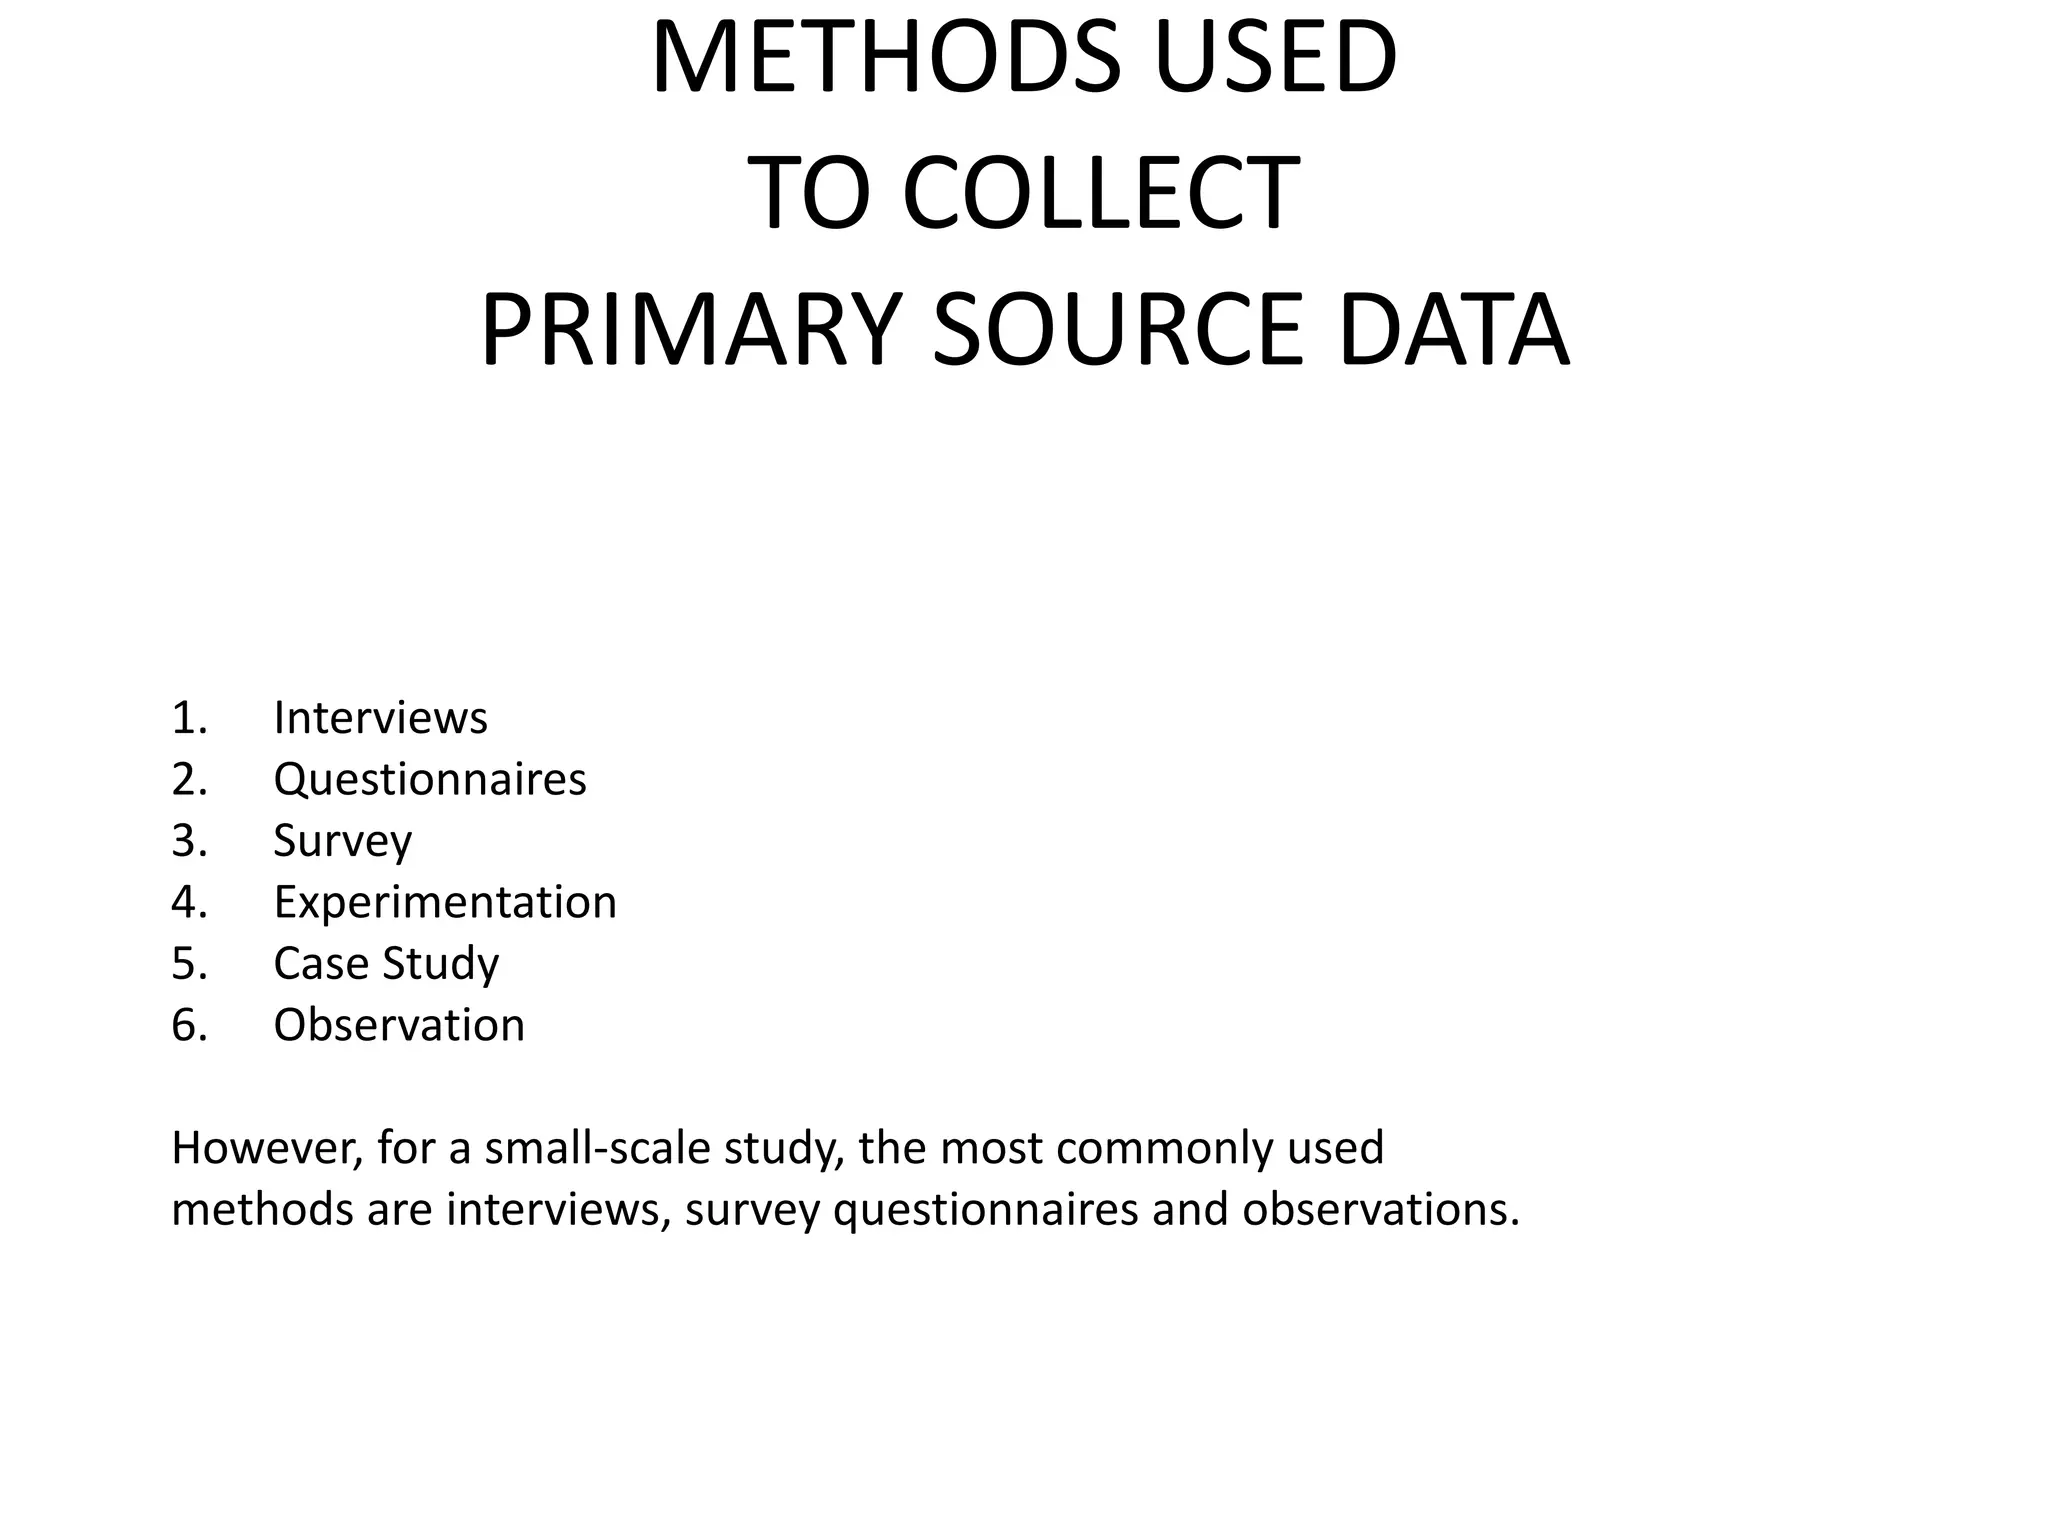


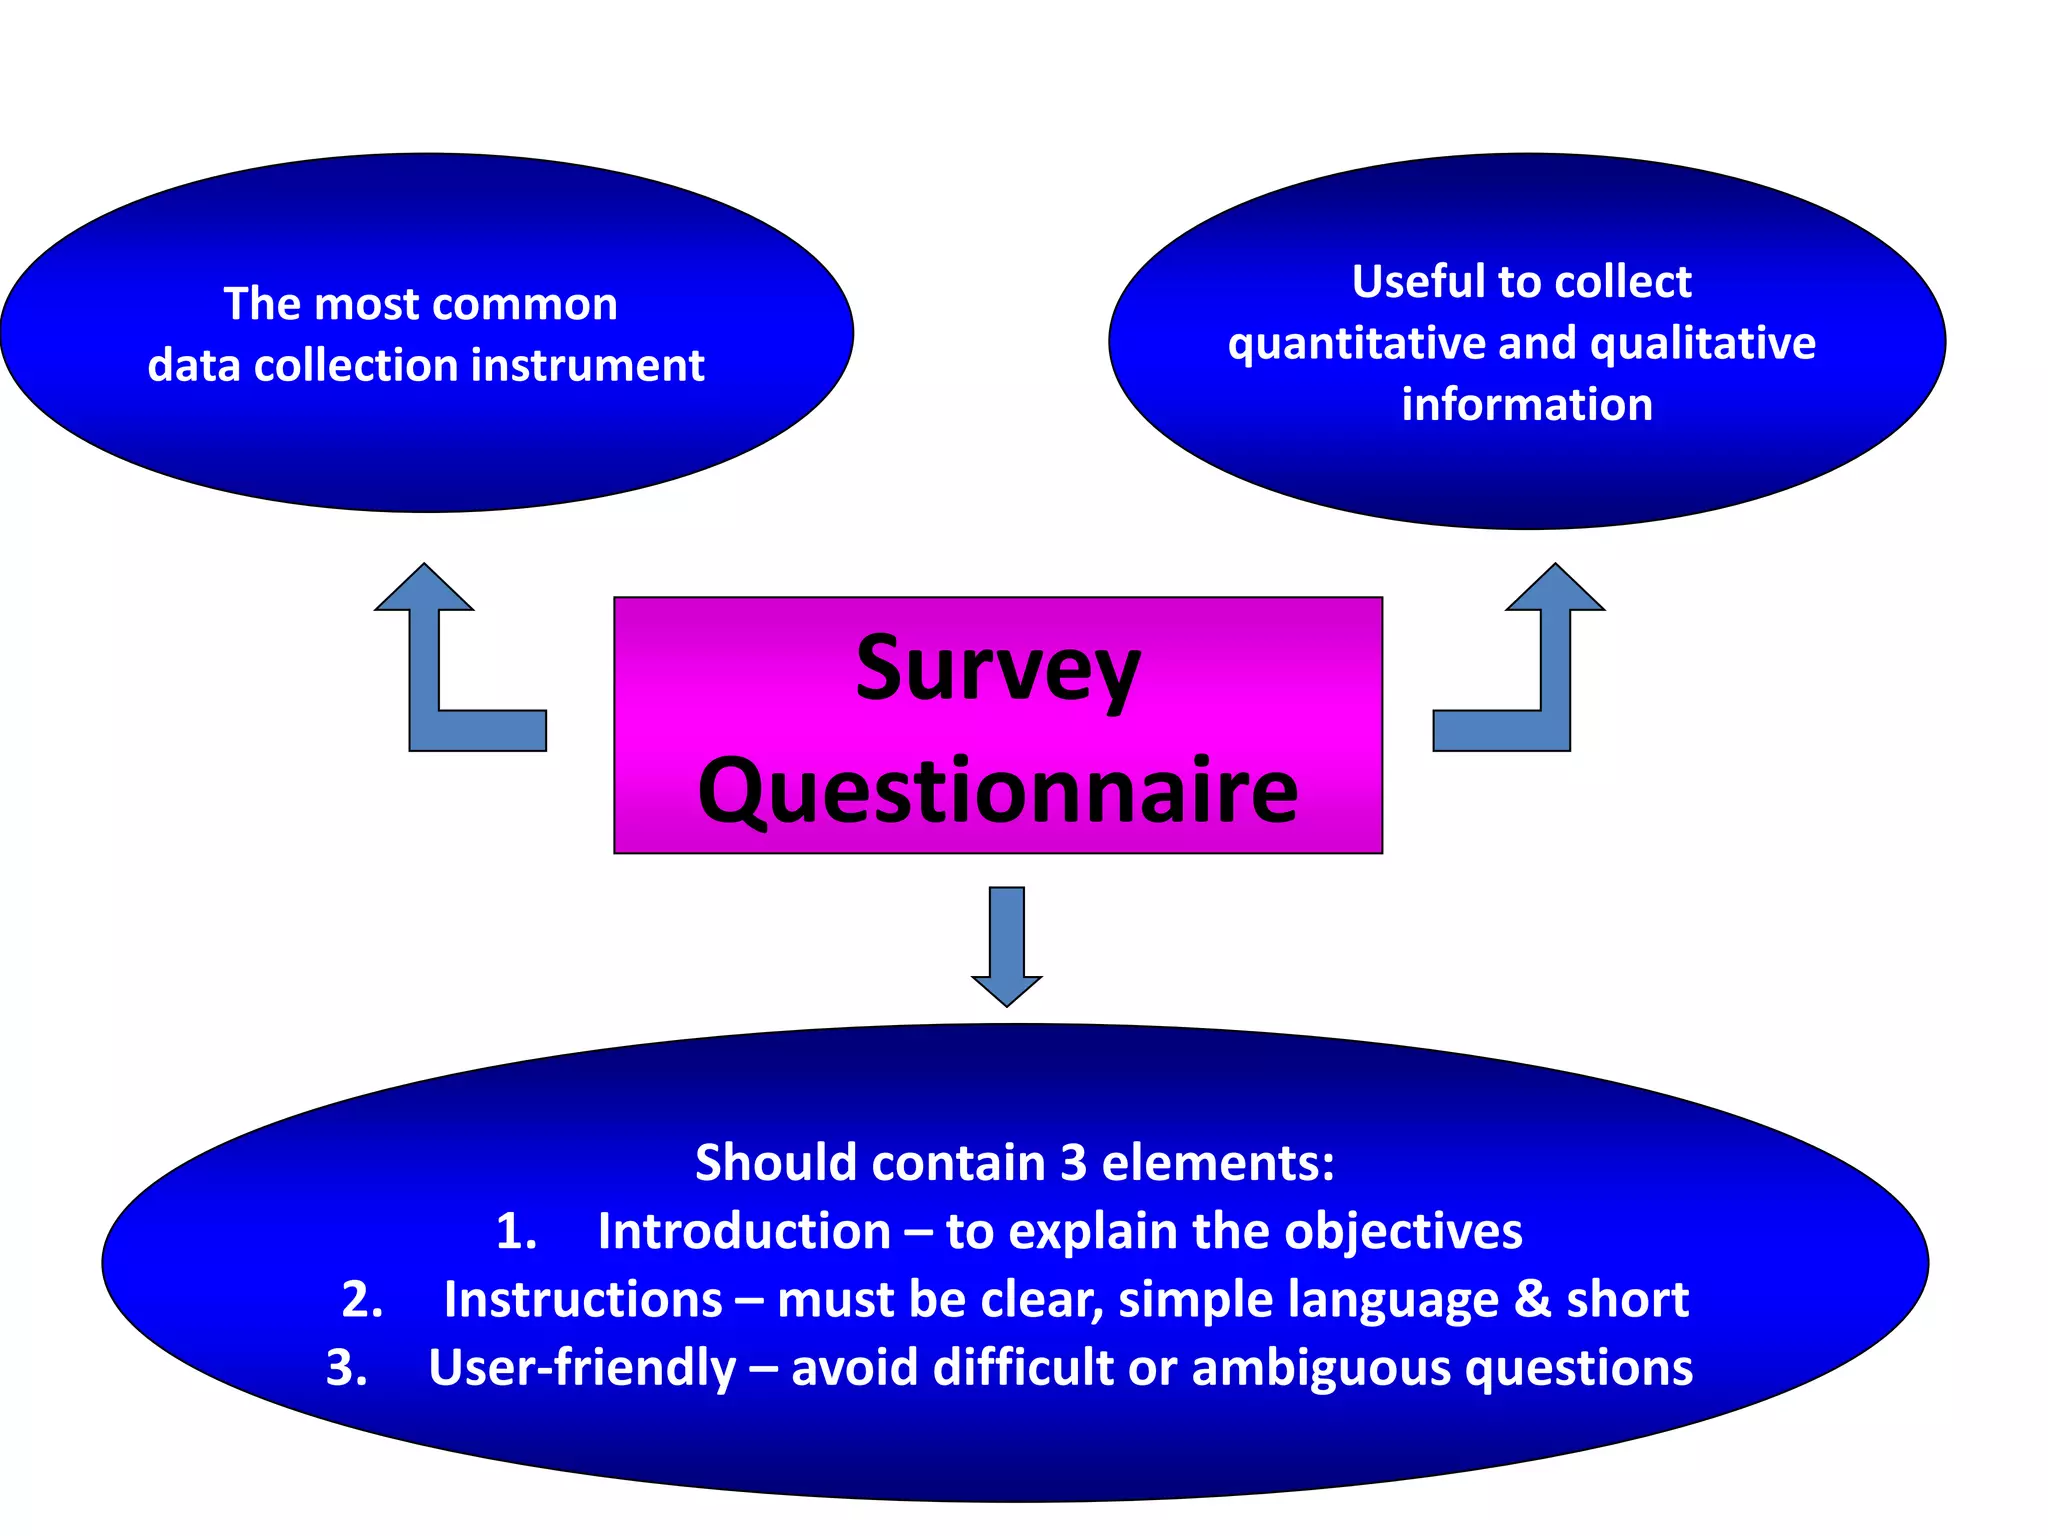
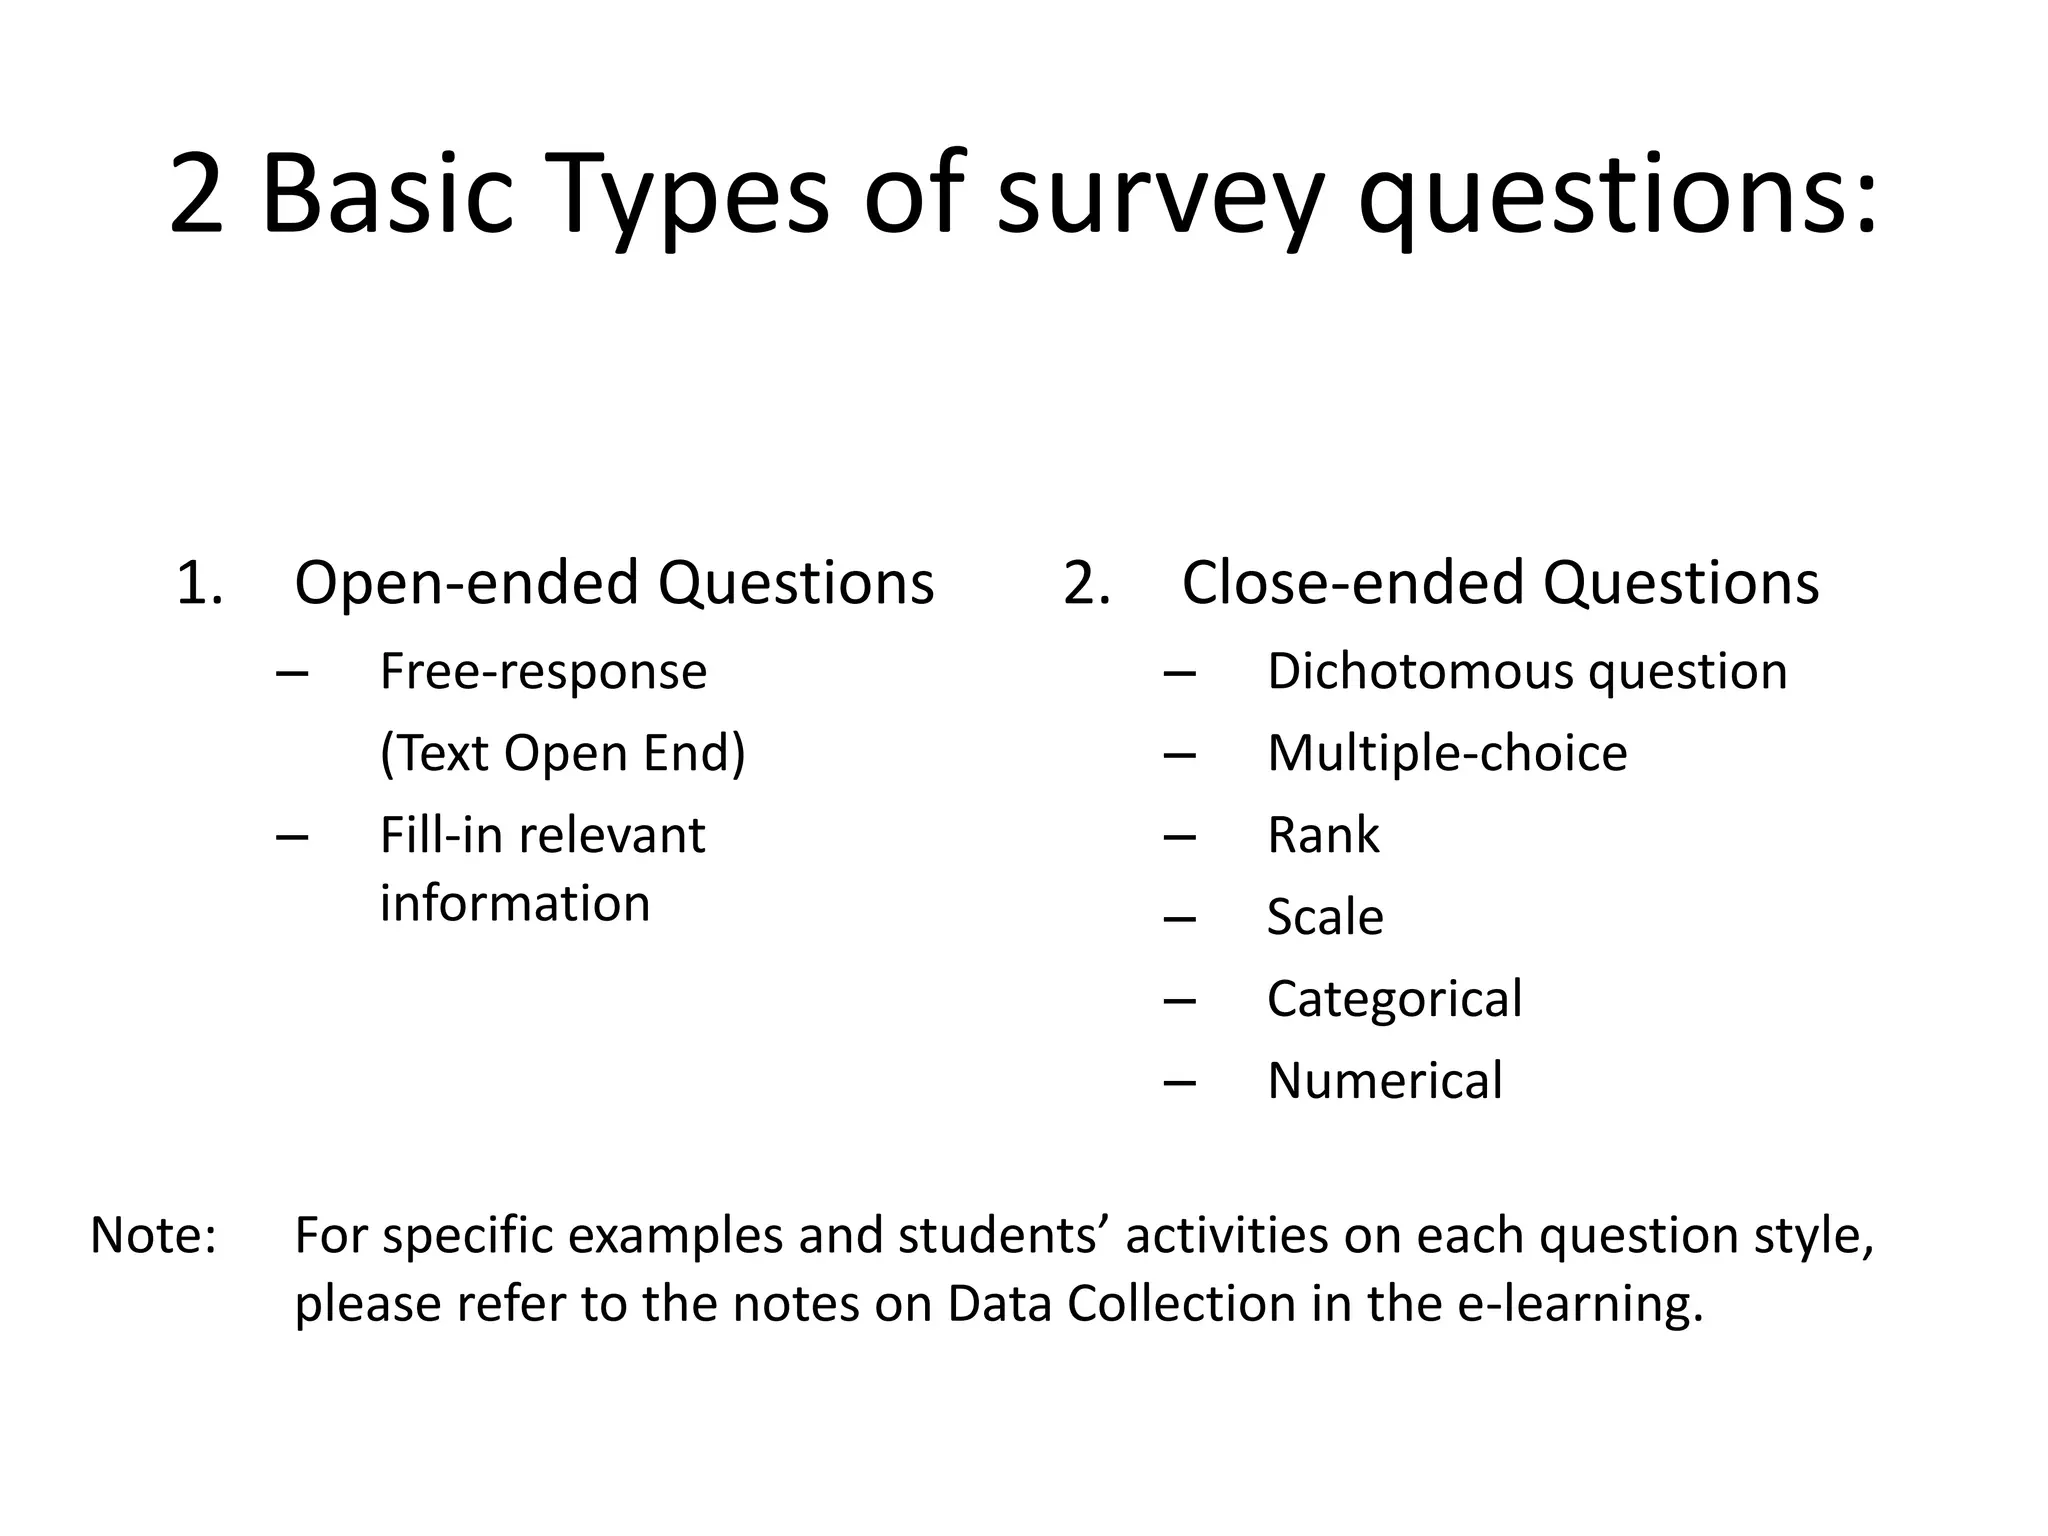
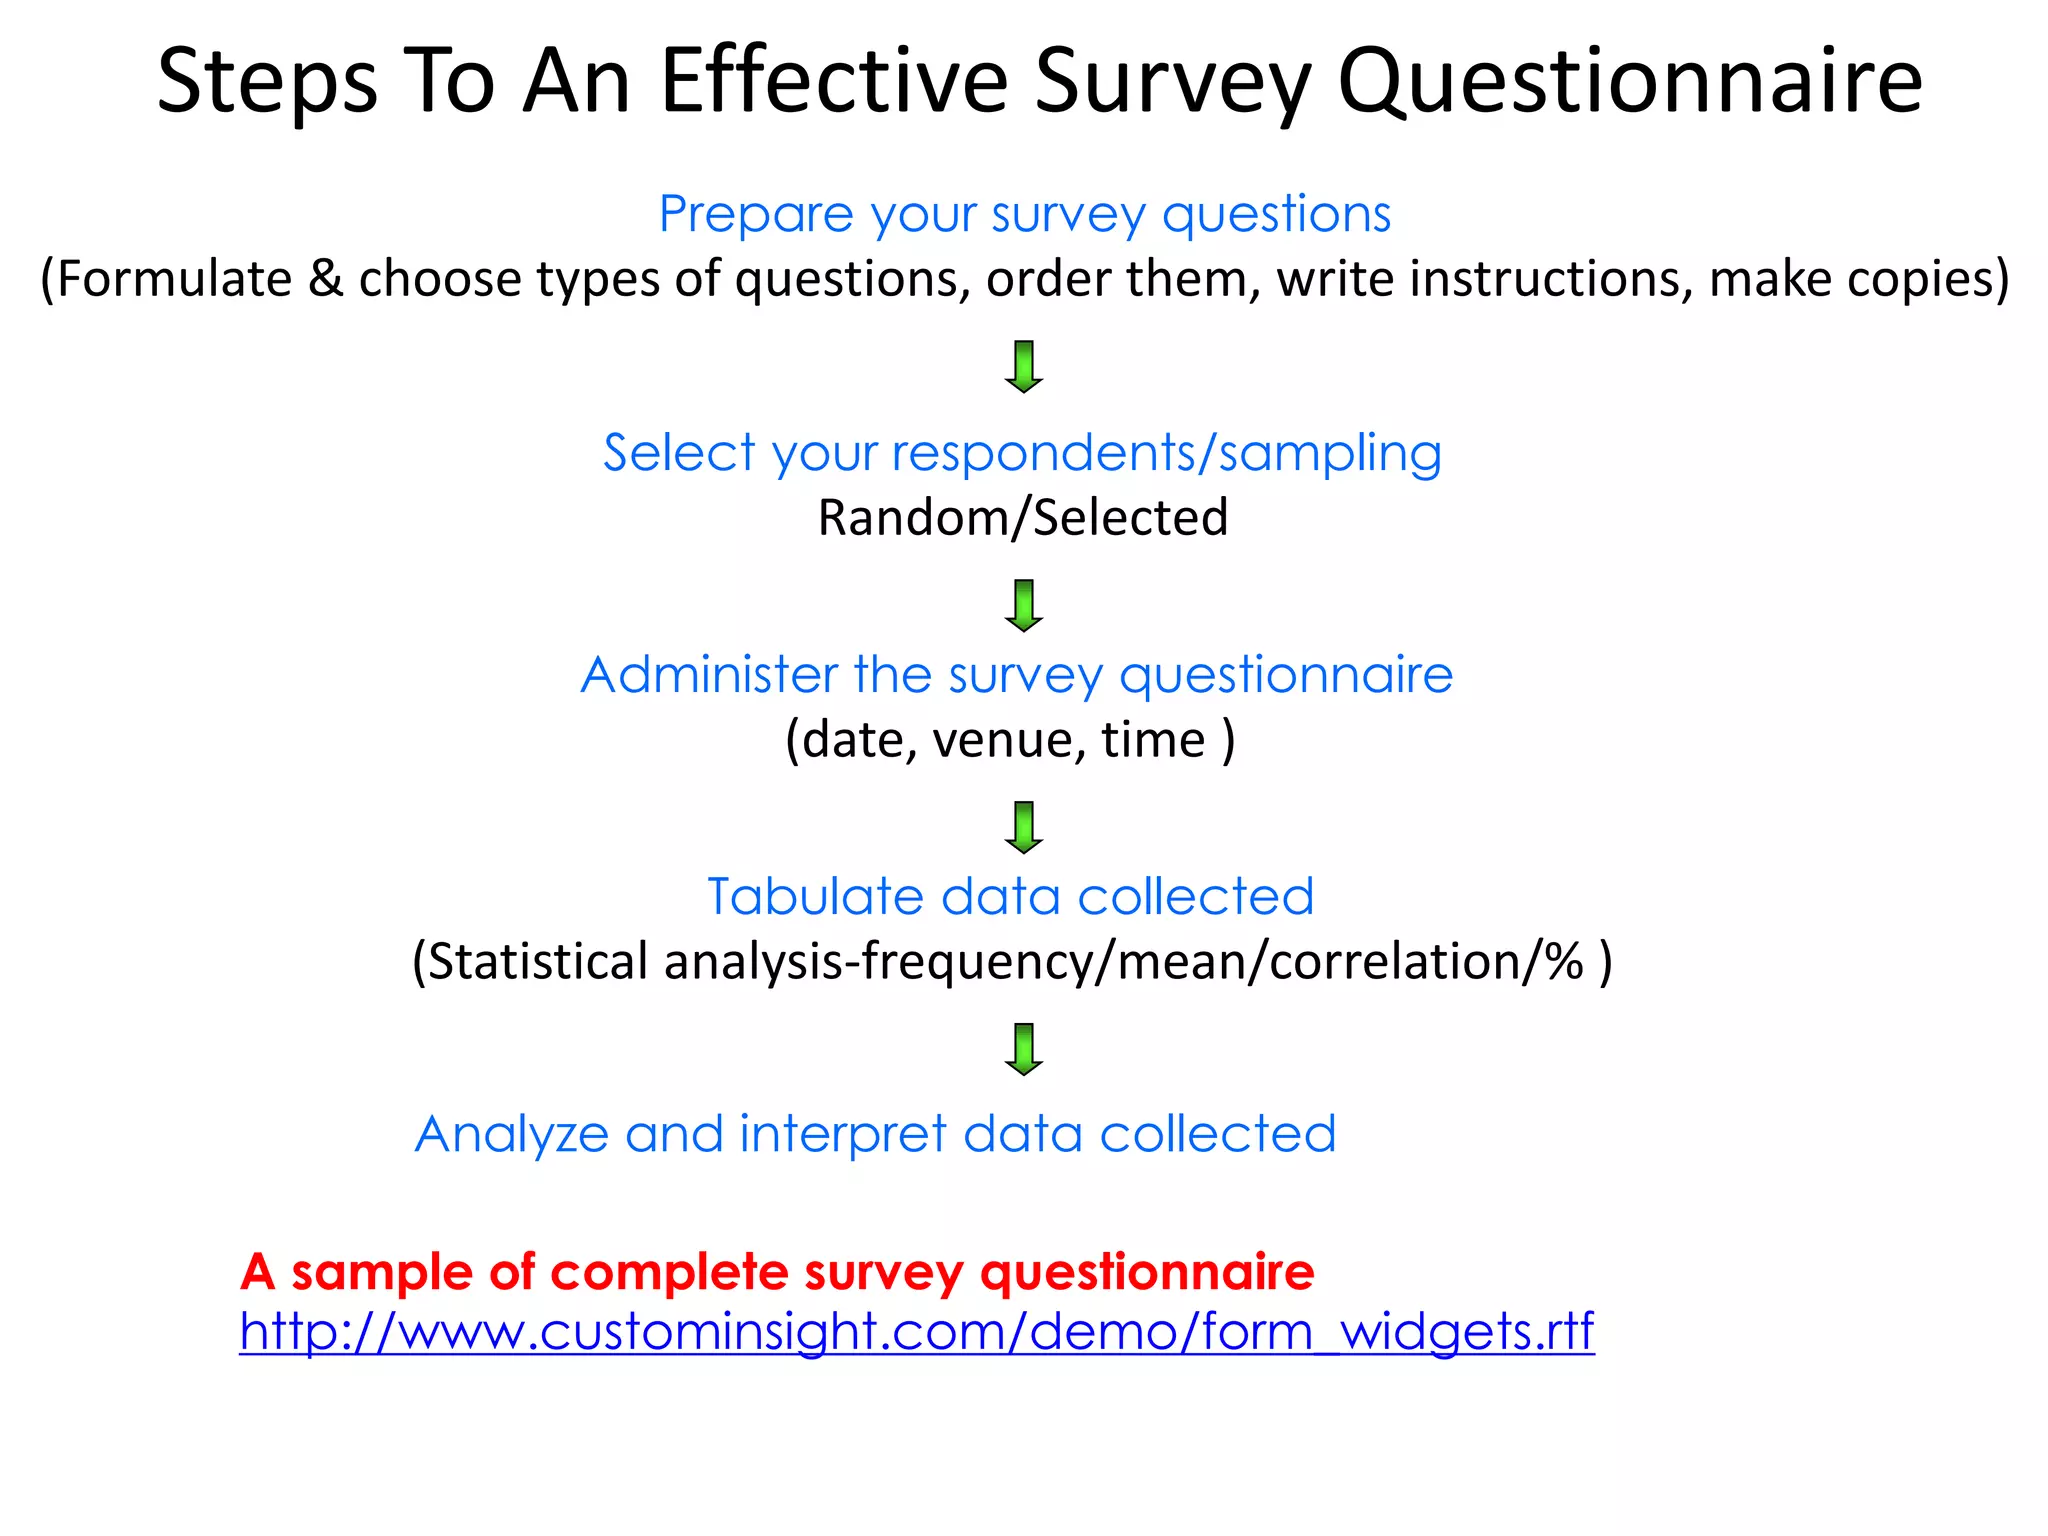
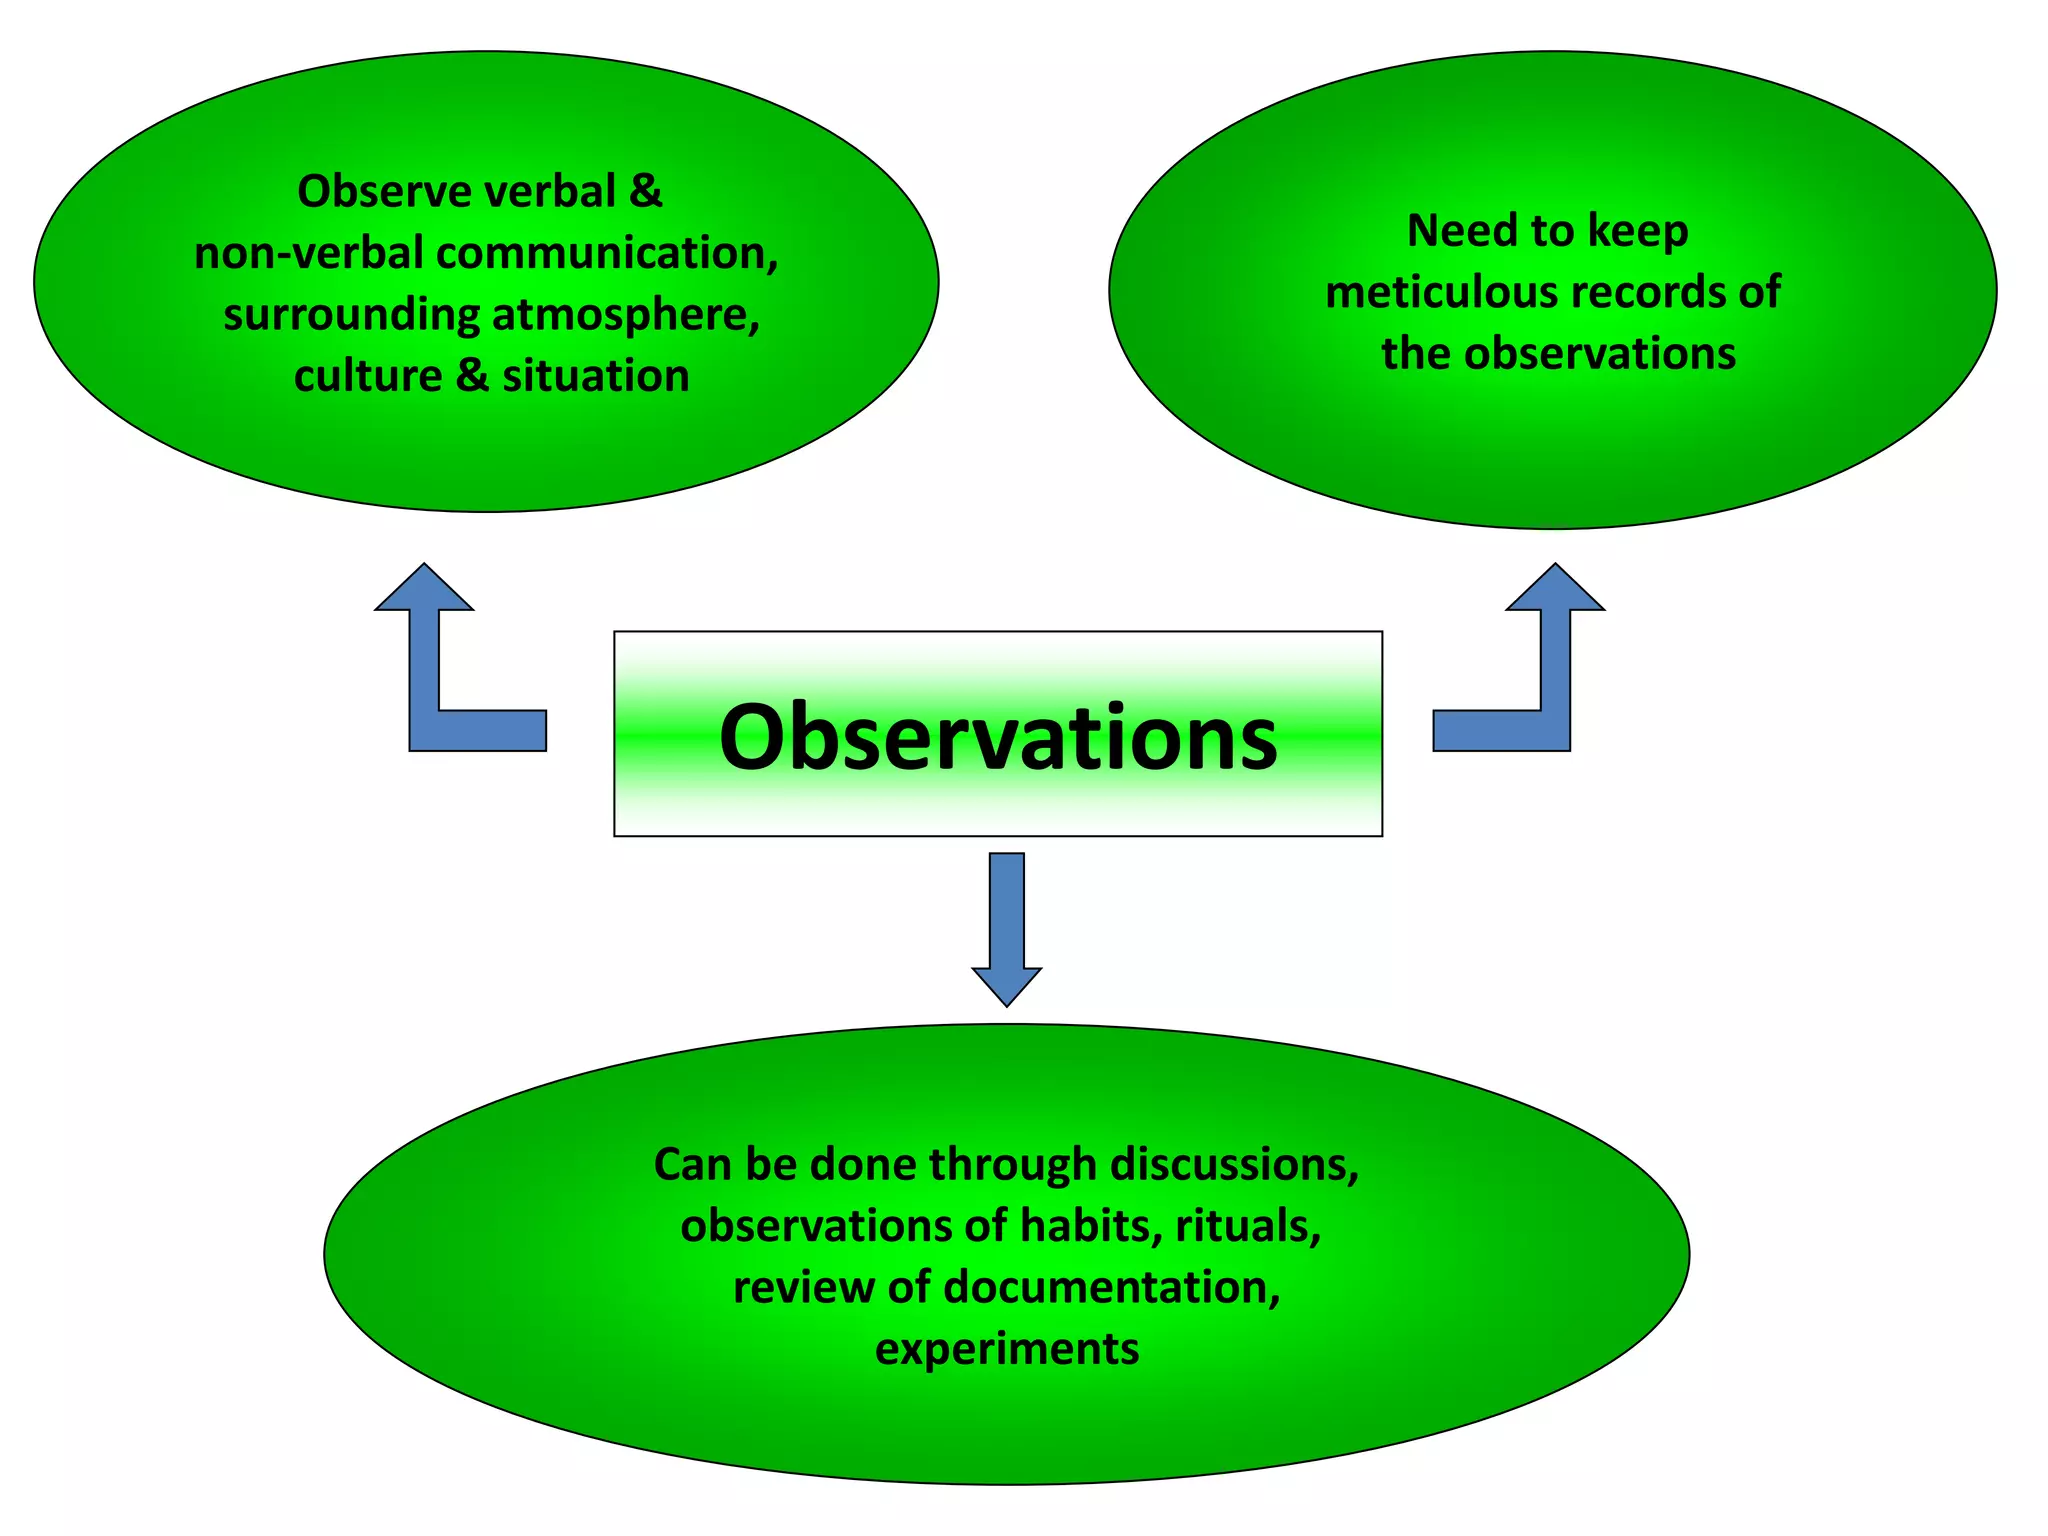
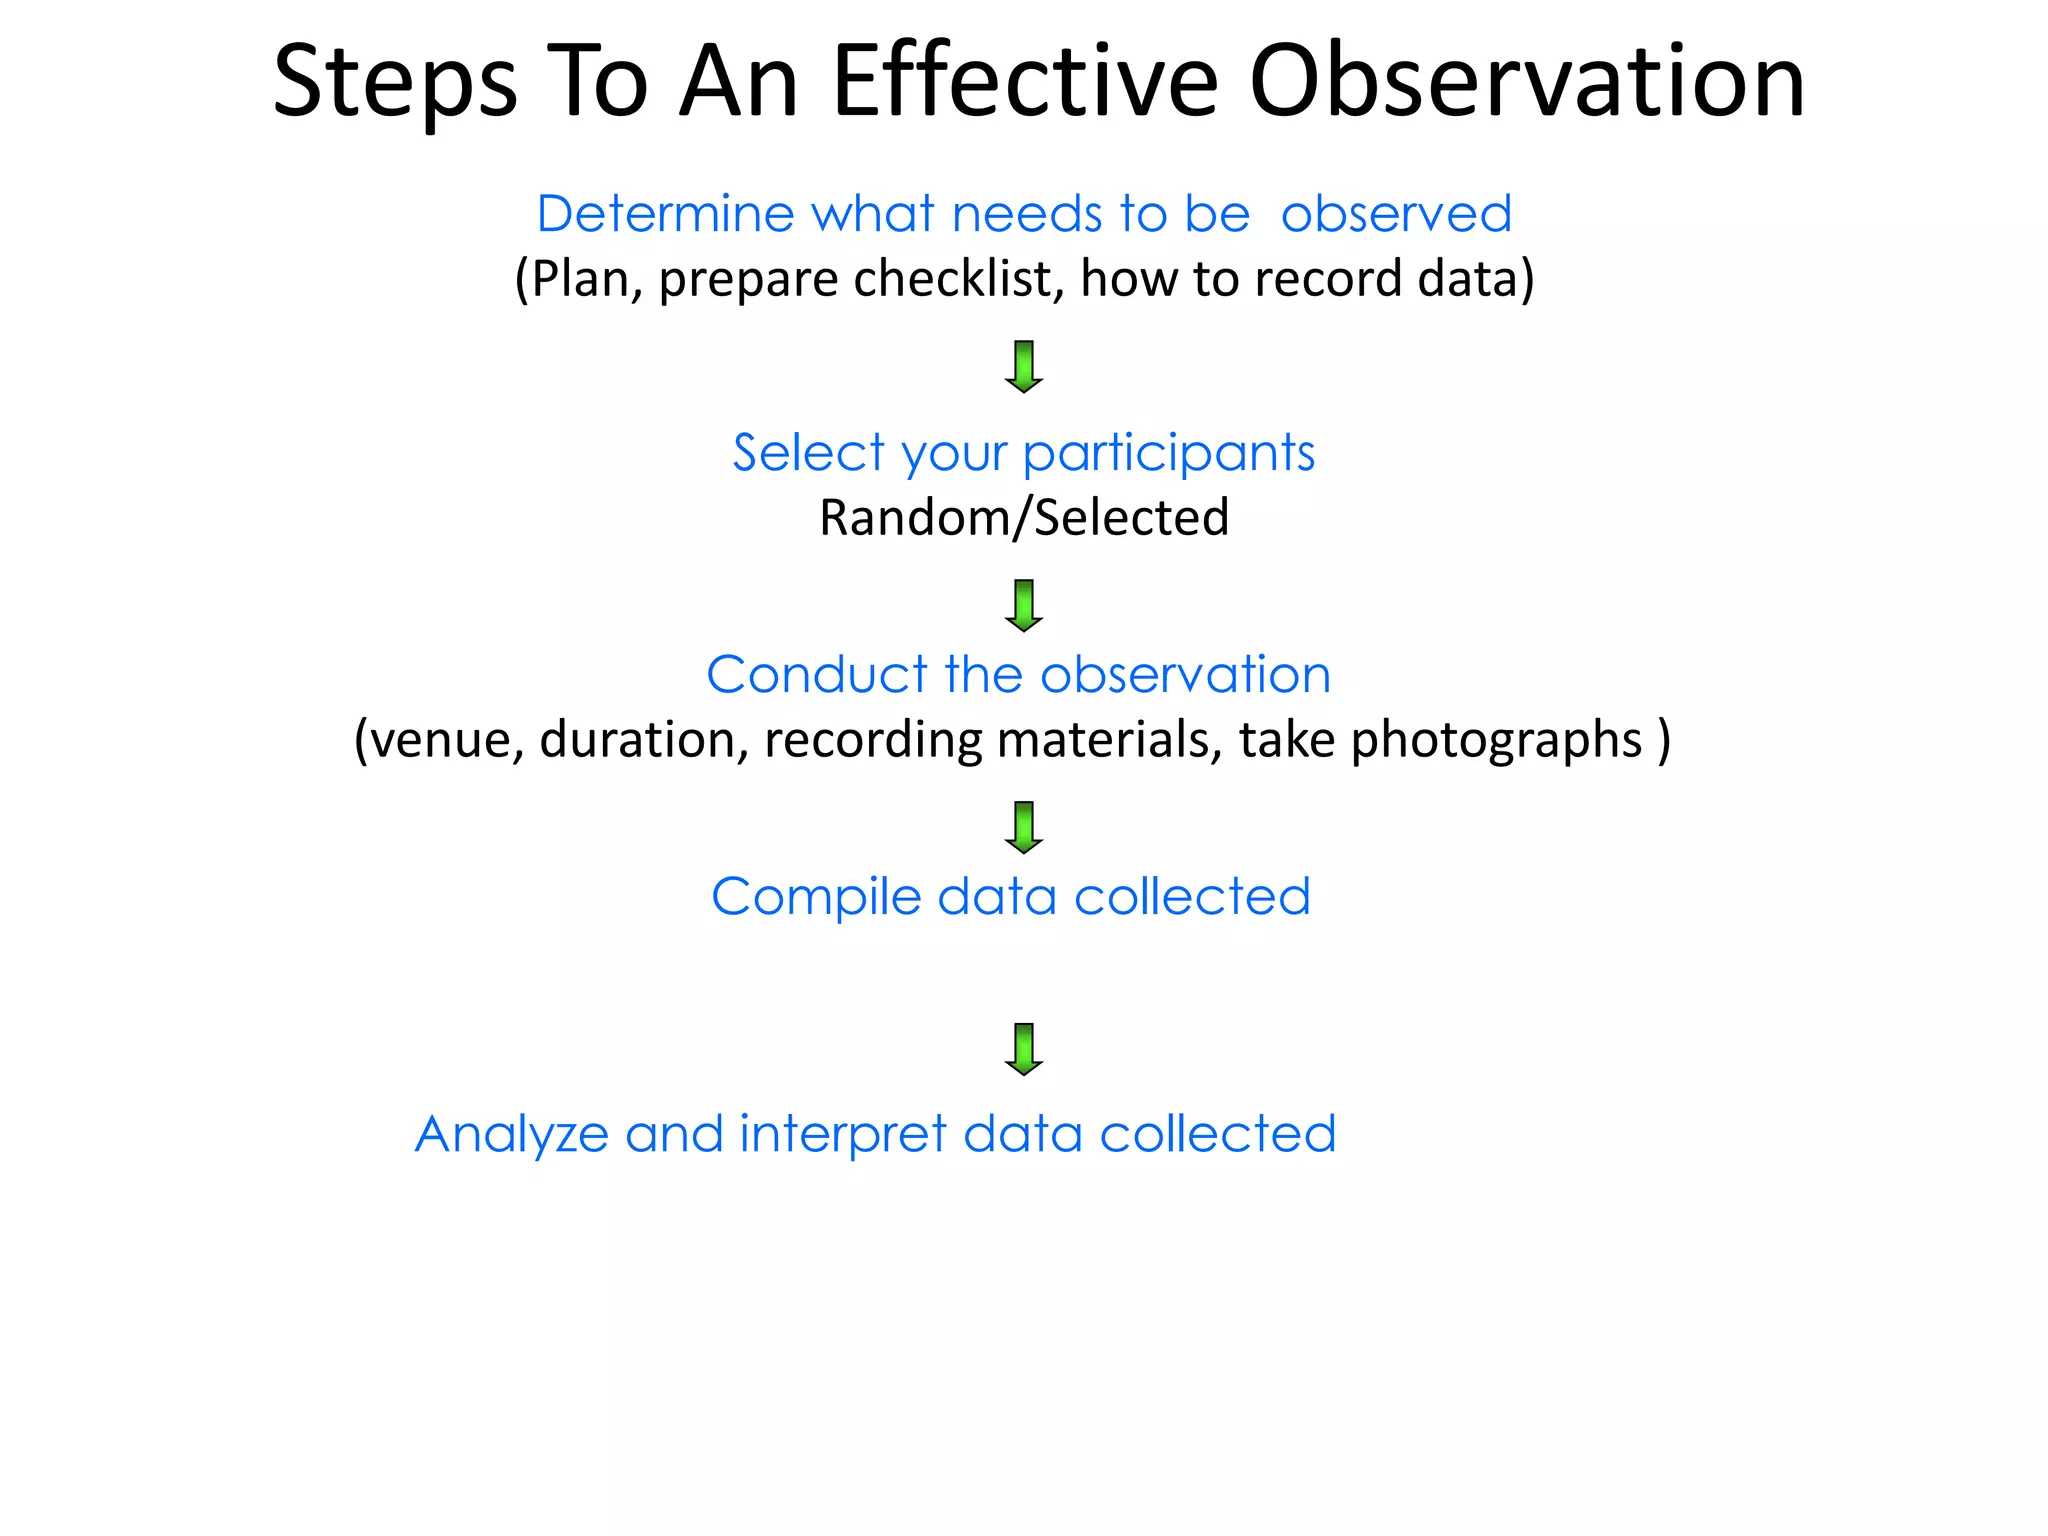
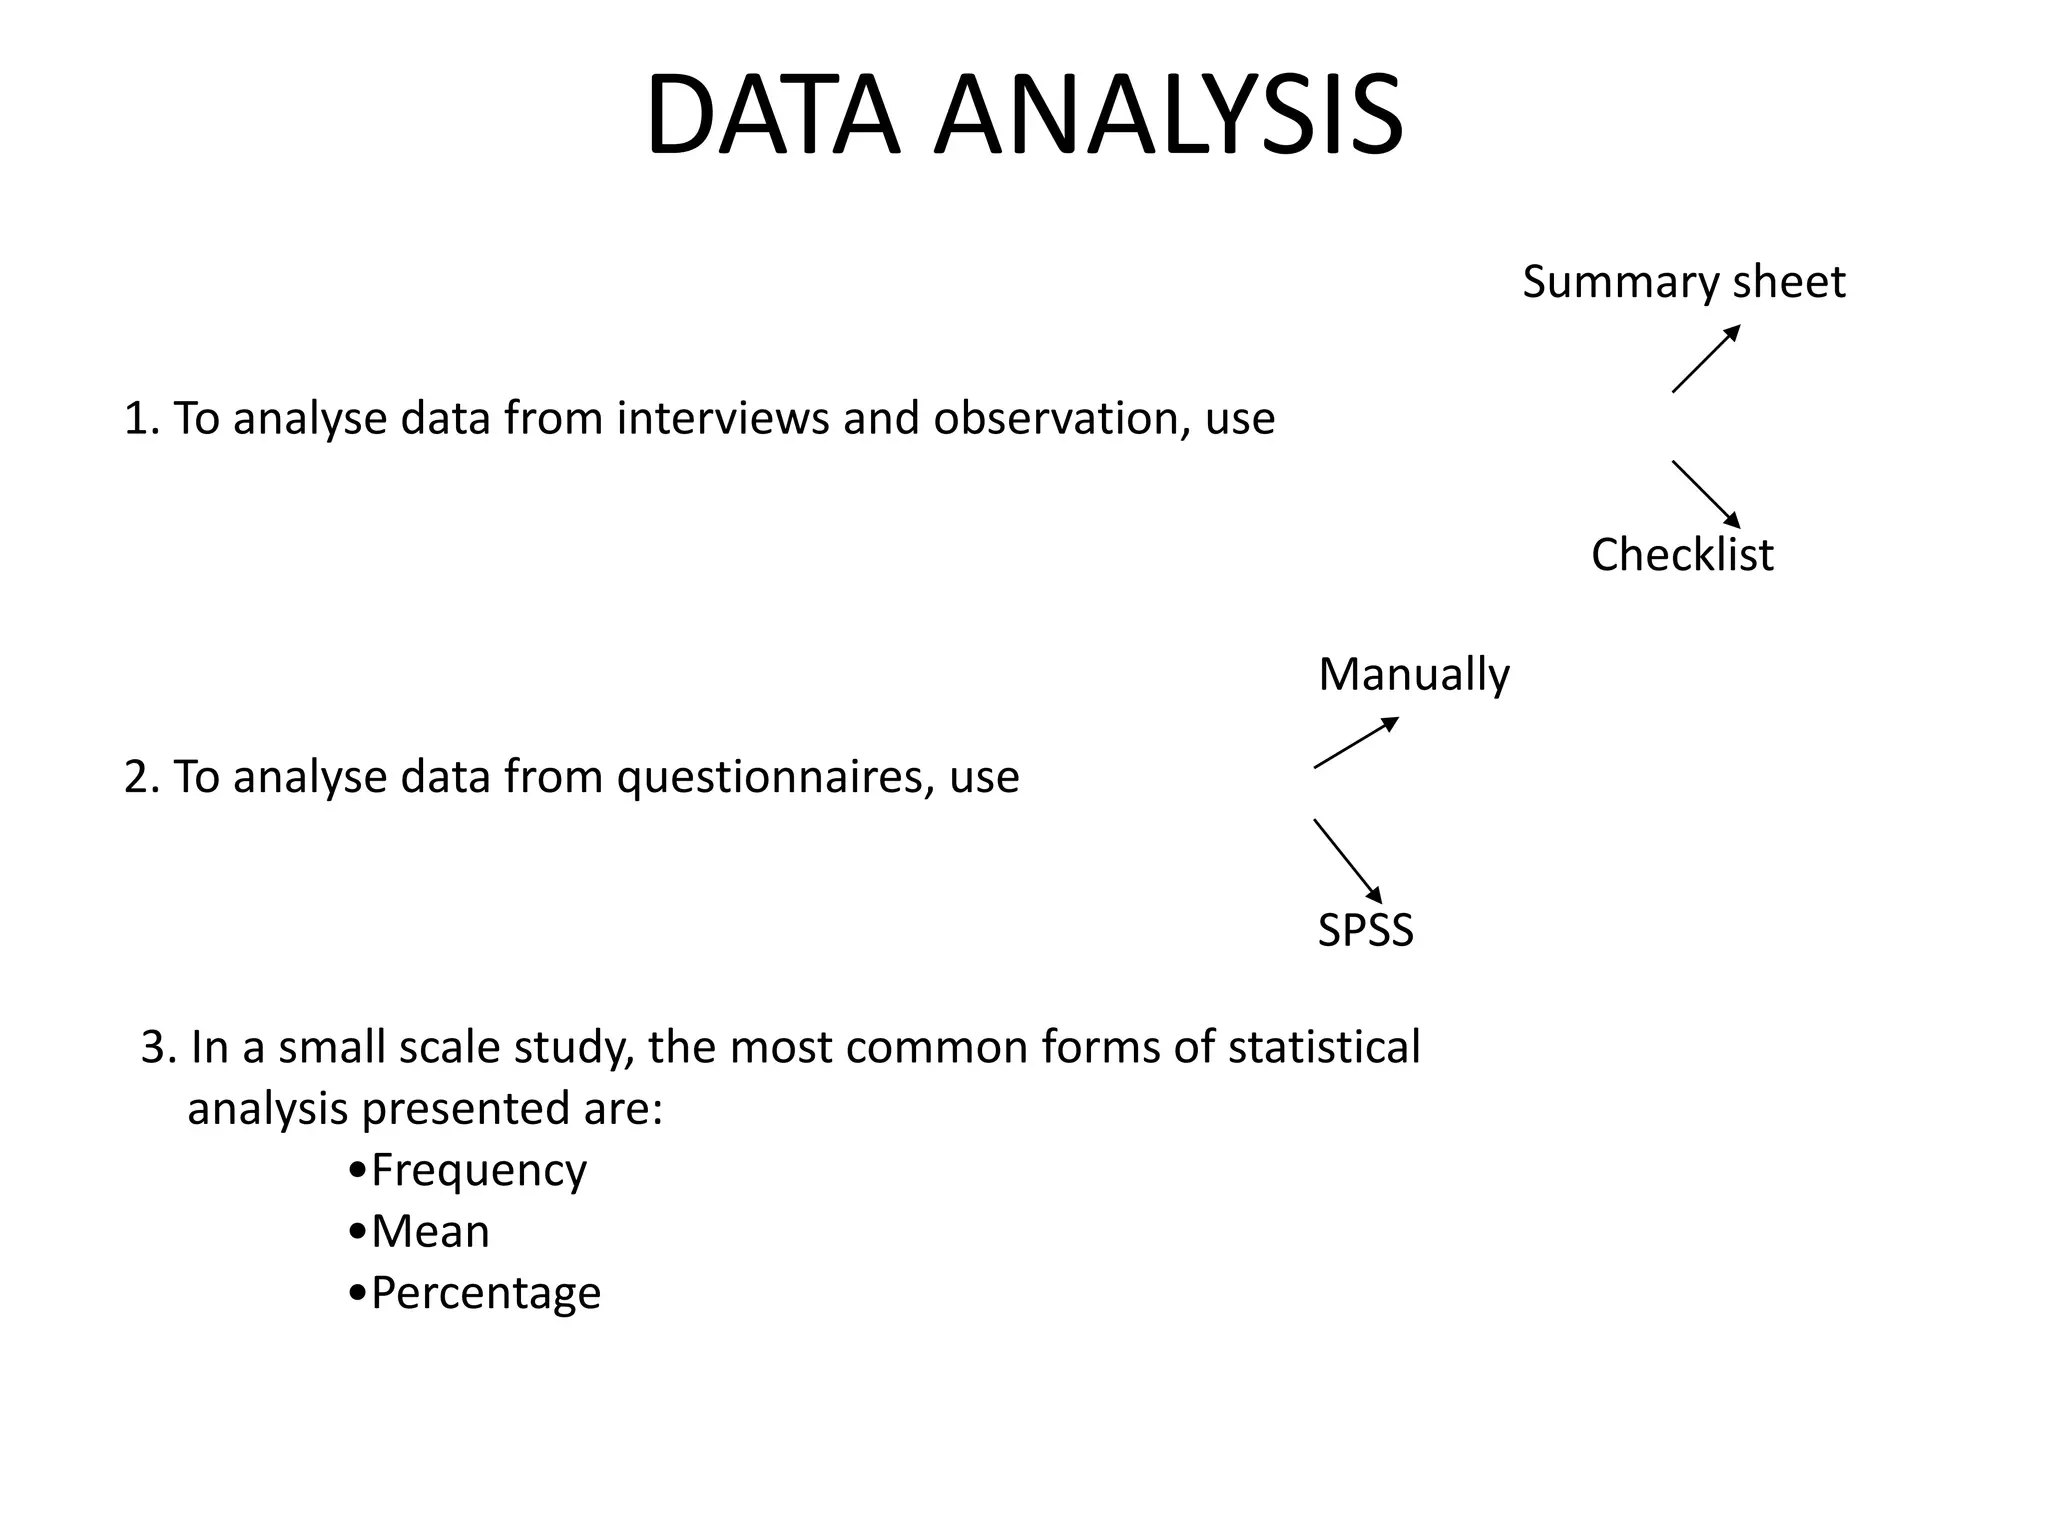
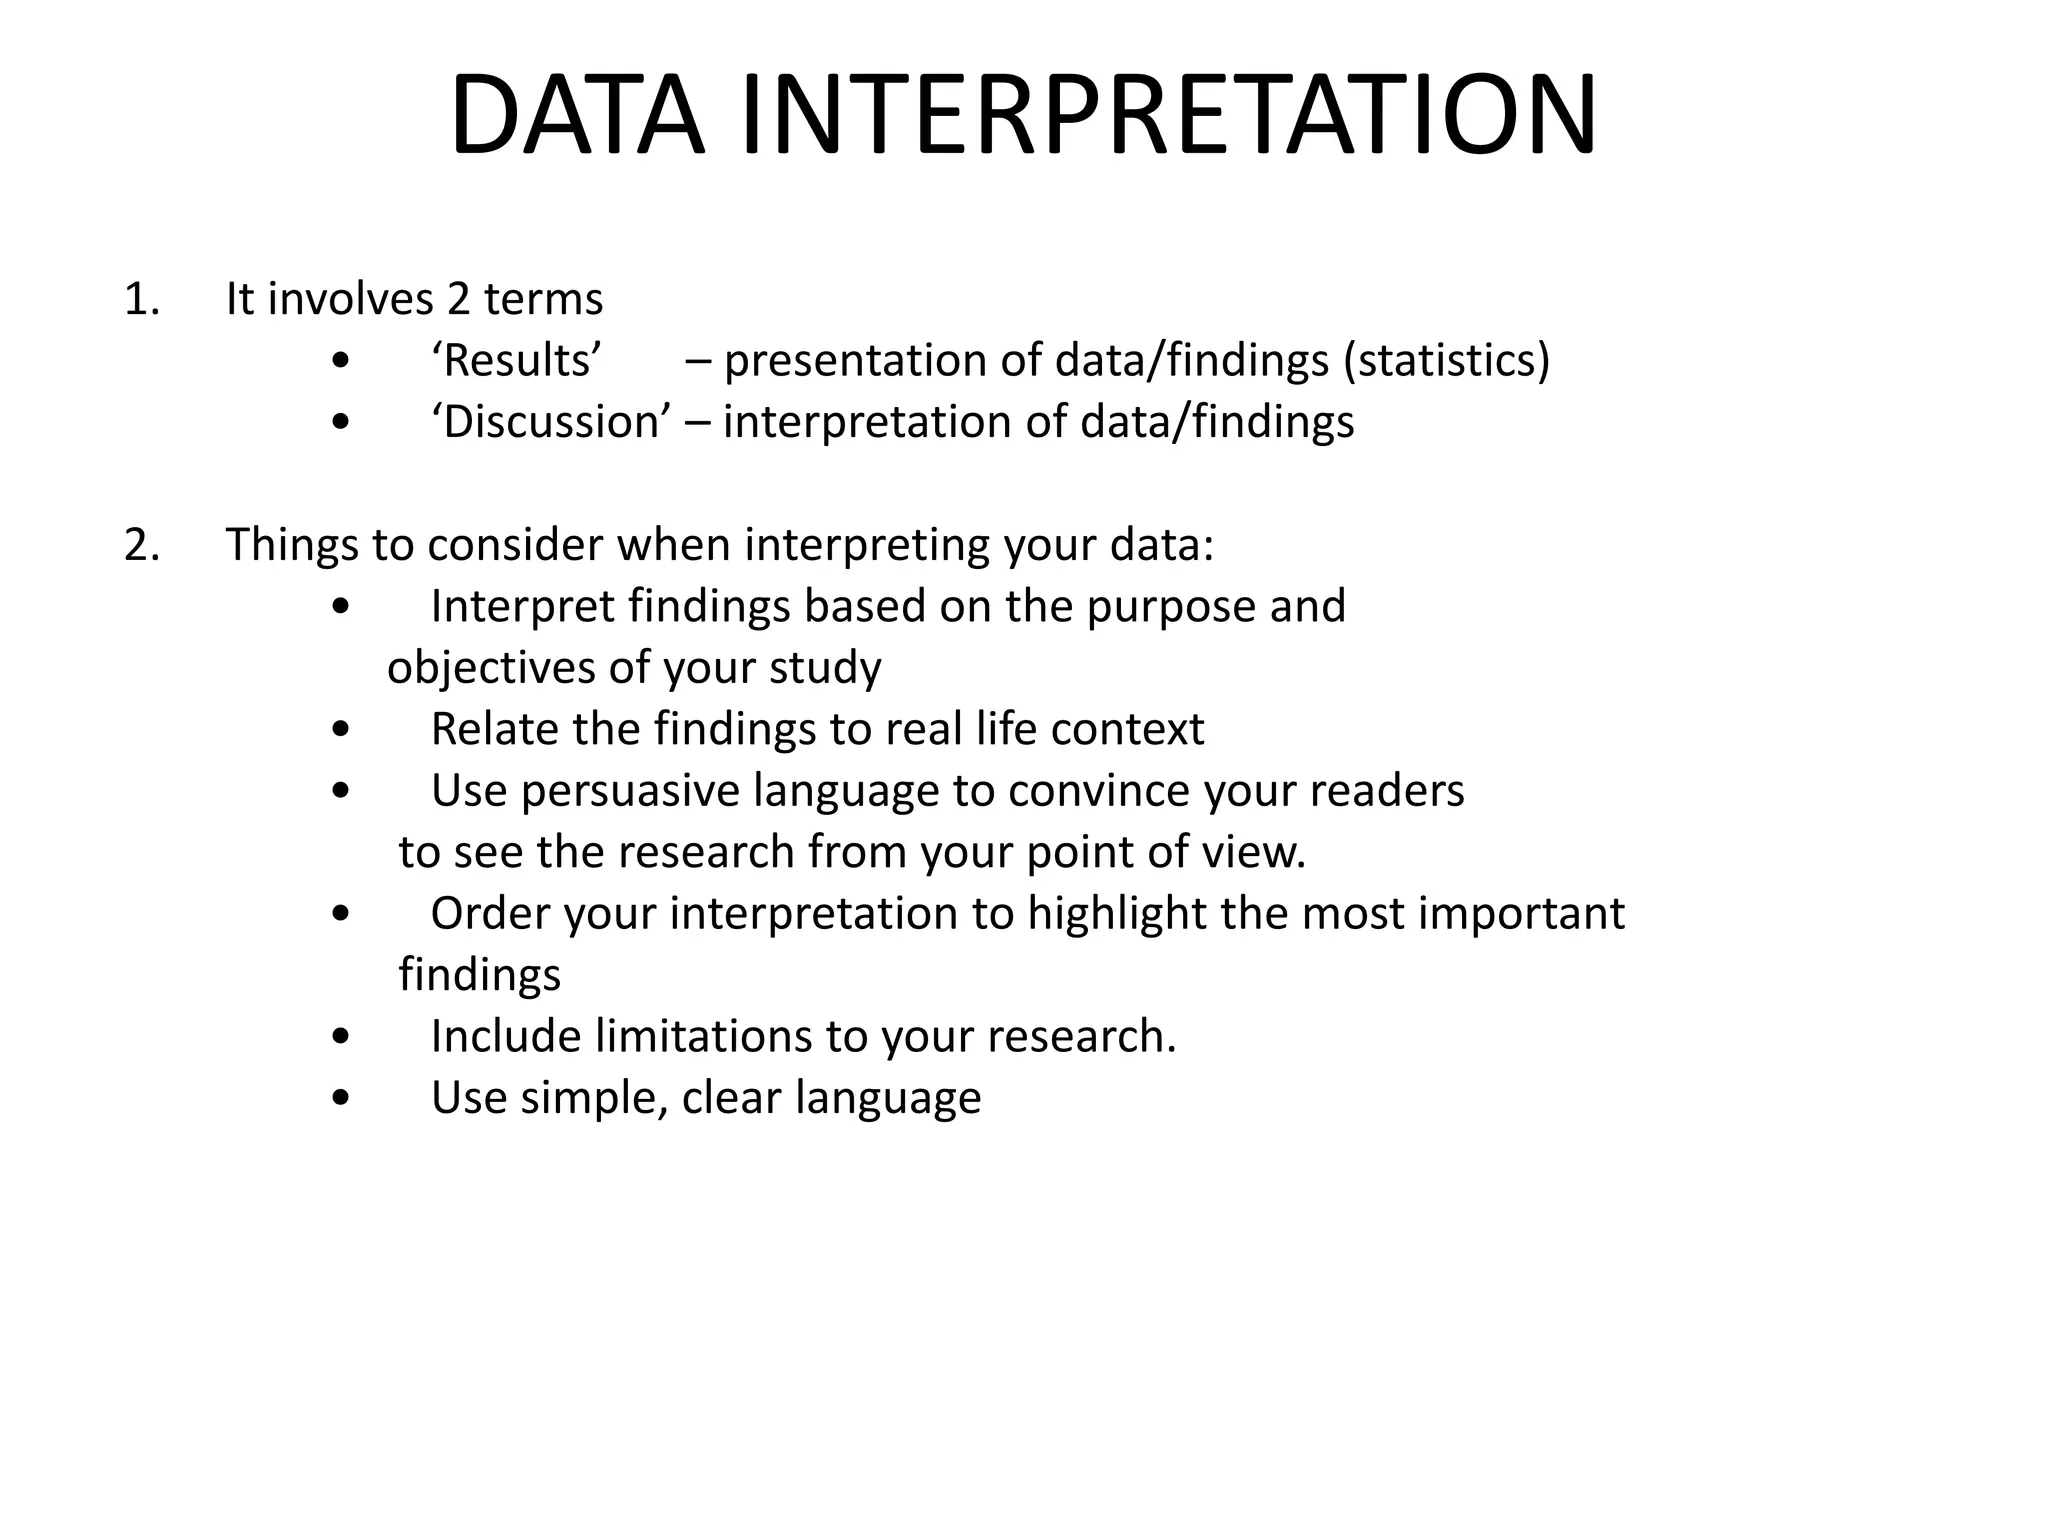


This document discusses marketing research and its key steps and methods. Marketing research involves collecting, analyzing and communicating information to make informed marketing decisions. There are 5 key steps in marketing research - defining the problem, collecting data, analyzing and interpreting data, reaching a conclusion, and implementing the research. Common data collection methods include interviews, surveys, observations, and experiments. The data is then analyzed using statistical techniques like frequency, percentage, and mean before reaching a conclusion and implementing the research findings.