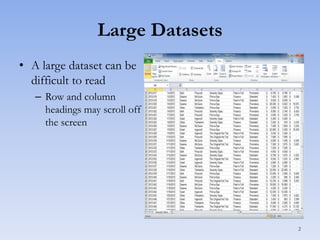
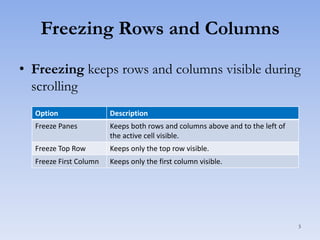
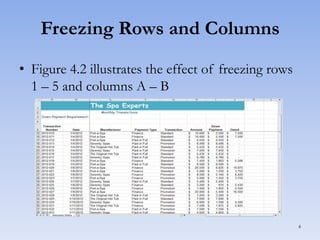
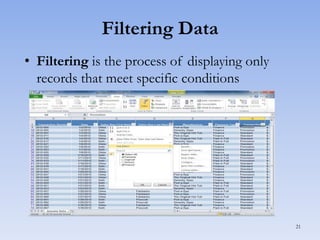
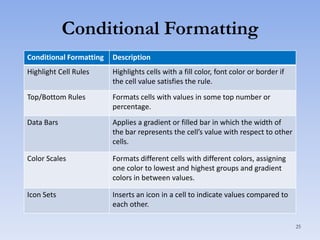
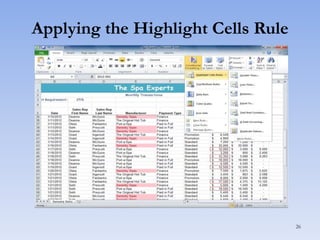
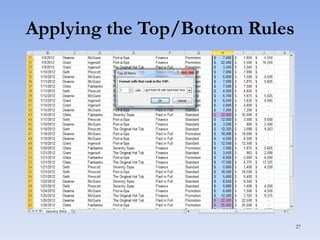
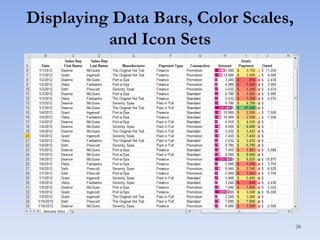
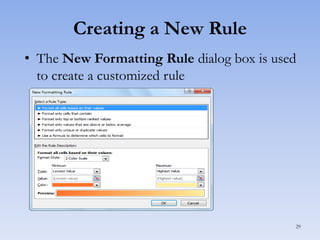
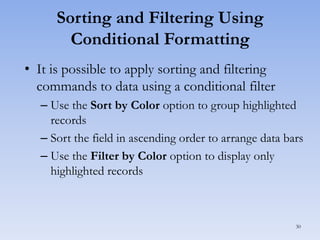
EPANDING THE CONTENT OF AN OUTLINE using notes.pptx
MIS 226: Chapter 4
1. Exploring Microsoft Office
Excel 2010
by Robert Grauer, Keith Mulbery,
and Mary Anne Poatsy
Chapter 4
Excel Datasets and Tables
1
2. Large Datasets
• A large dataset can be
difficult to read
– Row and column
headings may scroll off
the screen
2
3. Freezing Rows and Columns
• Freezing keeps rows and columns visible during
scrolling
Option
Description
Freeze Panes
Keeps both rows and columns above and to the left of
the active cell visible.
Freeze Top Row
Keeps only the top row visible.
Freeze First Column
Keeps only the first column visible.
3
4. Freezing Rows and Columns
• Figure 4.2 illustrates the effect of freezing rows
1 – 5 and columns A – B
4
5. Printing Large Datasets
• The Page Layout tab offers options to help
print large datasets:
– Page Breaks
– Print Area
– Page Titles
5
6. Manual Page Breaks
• A page break
indicates where data
will start on a new
printed page
6
7. Setting a Print Area
• A page area defines the range of data to print
7
8. Print Titles
• Print titles indicate
some rows or columns
that will repeat at the top
or side of each printed
page
8
9. Excel Tables
• A table is a structured range of related data
formatted to enable data management and
analysis
• Excel tables offer many features not available to
regular ranges
9
10. Table Design
• A field is an individual piece of data
– Field names appear in the top row as column
headings
– Field names should be short, but descriptive
• A record is a complete set of data for an entity
– Each record is listed in a row of the table
– Do not insert blank rows in the table
10
12. Creating a Table
• The Design tab on the Table Tools contextual
tab opens when the table is selected
12
13. Adding Records
• Add a new record at the bottom of the table by
clicking in the row under the table
• Add a new record within the table by clicking in
the record below the insertion point
– Click the Home tab
– Click the Insert arrow in the Cells group
– Select Insert Table Rows Above
13
14. Editing and Deleting Records
• Data within a table record can be edited using
the same techniques as those for a regular cell
• Deleting a record removes it from the table
– Click the Home tab
– Click the Delete arrow in the Cells group
– Select Delete Table Rows
14
15. Applying a Table Style
• A table style
controls the fill color
of the header row,
columns, and
records
15
16. Table Style Options
• The Table Styles Options group on the
Design tab contains check boxes to further
format the table
Check Box
Action
Header Row
Displays the header row at the top of the table.
Total Row
Displays a total row at the bottom of the table.
First Column
Applies a different format to the first column.
Last Column
Applies a different format to the last column.
Banded Rows
Displays alternate fill colors for even and odd rows.
Banded Columns
Displays alternate fill colors for even and odd columns.
16
17. Sorting Data
• Sorting arranges records in a table
– Sort on one column
– Sort on multiple columns
• Records can be sorted in ascending or
descending order
17
18. Sorting by One Column
• Excel offers several ways to sort a single column
Data type
Options
Explanation
Text
Sort A to Z
Arranges data in alphabetical order.
Sort Z to A
Arranges data in reverse alphabetical order.
Sort Oldest to
Newest
Displays data in chronological order.
Sort Newest to
Oldest
Displays data in reverse chronological order.
Sort Smallest to
Largest
Arranges values in sequential order.
Sort Largest to
Smallest
Arranges values in descending order.
Dates
Values
18
19. Sorting by Multiple Columns
• Multiple level sorts permits differentiation
among records with duplicate data in the first
sort
19
20. Creating a Custom Sort
• A custom sort can be
created to arrange
values in a customized
fashion
20
24. Creating a Total Row
• A total row appears as the last row of a table
and offers statistical functions
24
25. Conditional Formatting
Conditional Formatting
Description
Highlight Cell Rules
Highlights cells with a fill color, font color or border if
the cell value satisfies the rule.
Top/Bottom Rules
Formats cells with values in some top number or
percentage.
Data Bars
Applies a gradient or filled bar in which the width of
the bar represents the cell’s value with respect to other
cells.
Color Scales
Formats different cells with different colors, assigning
one color to lowest and highest groups and gradient
colors in between values.
Icon Sets
Inserts an icon in a cell to indicate values compared to
each other.
25
29. Creating a New Rule
• The New Formatting Rule dialog box is used
to create a customized rule
29
30. Sorting and Filtering Using
Conditional Formatting
• It is possible to apply sorting and filtering
commands to data using a conditional filter
– Use the Sort by Color option to group highlighted
records
– Sort the field in ascending order to arrange data bars
– Use the Filter by Color option to display only
highlighted records
30