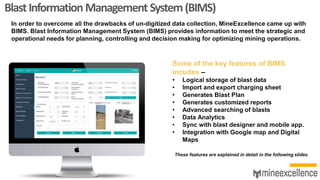
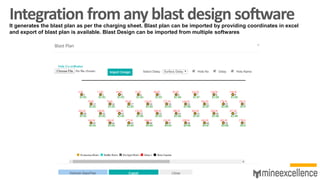
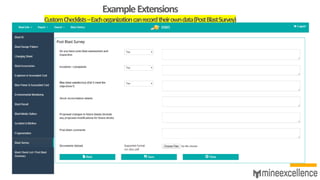
Automation in #Drill and #Blast. MineExcellence is pleased to launch our Explosive Truck Solution. 1. This solution can result in predictable and better production for mining companies as a result of better blasting. 2. Better auditable explosive consumption potentially reducing explosive consumption. 3.Reducing Human errors in the process where possible 4. Being able to predict and capture actuals. 5. Ability to track all moving aspects in your explosive delivery solution ( MMU’s, Side casters, Stemming trucks etc) -when was which at which site – audit-able and traceable. #drill #blast #mining #automation #digital
2. Benefits To A Mining Company
• Greater visibility to explosive
consumption.
• Visibility of charging time per hole and
day shift utilisation
Visibility
Productivity
Transparency
• Reducing Human Error in charging
• Ability to automate, verify and correct
crucial process
• Ability to cross verify, audit and prevent
explosive over usage or wastage.
• Integration with Blast Design Software
in Real Time to optimize drill and blast.
• Better production and more revenue
due to better blasting.
• Automation in Drilling and Blasting
Process
3. Benefits to Explosive Provider
• Real time tracking of explosive truck.
• Visibility of total charging time, loading
time, idle time, maintenance time etc.
Automation
Compliance
Digitization
• Reconcile weighbridge explosives
volume to emulsion dispensed.
• Cost benefit trade-off between single
MMU and HEF/emulsion re-supply
vehicles
• Measure side caster efficiency and
delays in HDM / Aggregate / Stemming
material arriving on block.
• Ability to link loading to individual blasts
accessible in an online portal.
• Prevent revenue loss due to un-
invoiced work.
• Prevent disputes with customers with a
common system.
4. 4
Exact live location of all MMU’s, utilities,
stemming trucks and side casters.
ABC
DEF
Summarised live view into location and duration on dashboard
Know the real-time location and activity of every vehicle
5. Understand every event and delay in the process
Shift
Emulsion Panel
Switch (charging
hole)
PTO pressure pump
Weighbridge
Empty and
Full
Emulsion
Product Type
Loading
Non-
productive
time (Hard
Park)
Entry event to
mining area
and charging
block
Weighbridge
Empty
6. Record all delays creating comprehensive Explosive Charging / blasting time model
Type of delay
WL Wait to load
FUN Fill up nitrate
FUE Fill up emulsion
FUG Fill up gassing
PI Pre-shift inspection
FUW Fill up water
CAL Calibrate truck
WT Wash truck
ED Engineering downtime
SYN Synchronize delays
WC Wait for charge sheet
WV Wait for Varkie (HEF truck)
CH Charge
FUD Fill up diesel
TT Travel time
CT Change tyre
MMU truck volume
Diesel level
Emulsion level
Gassing
Nitrate
KPI categories Unit of measurement
1. Utilisation
Operational breakdown events Amount
Operational downtime per event Hours
Traveling speed Km/hour
First load Time stamp
Last load Time stamp
Charging hours (equivalent to DOH) Hours
2. Availability
Ignition on Time stamp
Ignition off Time stamp
Breakdown events Amount
Downtime per event Hours
Planned maintenance downtime Hours
Equipment availability %
Plant availability %
3. Safety and Efficiencies
Cycle time Hours
Cycle distance Km
Travelling speed (instantaneous and
trending) Km/hour
KPI categories
Unit of
measurement
4. Filling time at silo / depot
Time to load HEF product Hour
Queueing time at HEF storage Hour
Time to load water Hour
Queueing time at water point Hour
Time to load nitrate (PPAN) Hour
Queueing time at nitrate store Hour
Time to collect accessories Hour
Queueing time at accessories
stores Hour
5. Time at block
Arrival time at block Time stamp
Departure time from block Time stamp
Time spent on block Hour
Charging time (Pump hours) Hour
6. Travel time
Travel distance: Empty Km
Travel speed: Empty Km/hour
Travel time: Empty Hour
Travel distance: Full Km
Travel speed: Full Km/hour
Travel time: Full Hour
Safety: Speeding incidents Amount
Safety: Harsh braking incidents Amount
Delay Events Time KPI’s
7. Visualise events on heatmap to understand
relative duration and impact on the operation
8. BlastInformationManagement System(BIMS)
In order to overcome all the drawbacks of un-digitized data collection, MineExcellence came up with
BIMS. Blast Information Management System (BIMS) provides information to meet the strategic and
operational needs for planning, controlling and decision making for optimizing mining operations.
Some of the key features of BIMS
incudes –
• Logical storage of blast data
• Import and export charging sheet
• Generates Blast Plan
• Generates customized reports
• Advanced searching of blasts
• Data Analytics
• Sync with blast designer and mobile app.
• Integration with Google map and Digital
Maps
These features are explained in detail in the following slides
9. BIMS (Blast Information Management System)
➢What does platform do :It can be use for planning, controlling and decision-making for
optimizing mining operations. It provides the capability to store, manage, retrieve and
analyze mine and blast related information. Stores blast details, blast parameters, blast
patterns, face profiles, explosive consumption, charging details and all measurements like
vibration records, photo and video.
Business Benefits :
➢Data Capture: Systematic storage, retrieval and analysis of data. Currently blasting related
information is in excels sheets at many mines and does not help in actual analysis.
➢Productivity Gains: Proper analysis will result in significant productivity gains in the overall
Mine to Mill Operation.
➢Improved Blasting: Via this software, Blasting personnel can control critical parameters
such as dilution, vibration, fragmentation, fly rock and fines generation – You are capturing
actuals results.
➢Cost Optimization: It can be used in everything cost analysis of blasting, if required. It is
possible to capture explosive and manpower and associated costs during blasting to report
and analyze later on.
➢Better Reporting: Report generation for individual blast, monthly explosive consumption,
stock, manpower, accident and misfire reports etc.
➢Analysis: Ability to search blasts between dates, by performance of explosives or initiating
system, by vibration limits, by fragmentation size, by location of blasting zone or accident,
etc. Our Platform makes past blasting readily data in a logical format and blasting data
analysis tools to design and improve future blasts.
➢ It is also possible to see all your past blasts on a map at your mine site (provided data is
available).
➢Personalization: Ability to create client specific reports or analytics
10. Integration from any blast design softwareIt generates the blast plan as per the charging sheet. Blast plan can be imported by providing coordinates in excel
and export of blast plan is available. Blast Design can be imported from multiple softwares
11. About 40 Custom Reports Already available
Following reports can be generated from BIMS – for a particular date range, quarterly,
monthly or annually.
Blast Details &
Result
Can be sorted by
• Blast Wise
• Date Wise
• Total Cost
• Material Produced
• Material Cost Wise
Blast Vibration
Can be sorted
by
• Blast Wise
• Date Wise
• PPV Wise
Explosive & Initiator Consumption
Can be sorted by
• Blast Wise
• Date Wise
• Total Explosive Consumption Report
• Total Accessories Consumption Report
• Explosive Management Report
Other Reports
• Daily Production
• Advanced Report • Accident & Misfires
*Reports can be customized as per required.
12. Advanced Searching /Analysis
It is very easy to search for blasts with our advanced searching techniques
Search By
• Date Range
• Explosive Used
• Zone/Face where blast was
conducted
• Blasts whose vibration limits
falls under the mentioned
limits.
• Blasts which fulfilled the given
performance criteria
• By source – designed in
designer or app and then
synced in BIMS.
13. Data Analytics
Different Data Analytics can be generated based on the records entered in BIMS.
Analytics includes -
• Average Blasting Cost
• Blast Cost per Ton
• Explosive Consumption/Powder
Factor
• Burden, Spacing & Stemming
• Ground & Air Vibration
• Flyrock
• Total Production/Number of holes
blasted.
• Production per meter/Total meters
blasted
• Specific Charge
• Specific Drilling
• Total blasting costs
*Analytics can be customized as per required.
14. BlastManagementPortal–Seedataforallsitesfromoneplace
What does this do : Mine Management or Explosive
company can monitor explosive details / charring records.
Records / blast records uploaded by different mines of their
organization and generate their graphs and reports to do
comparative analysis based on key factors such as powder
factor, output produced etc.
Business Benefits :
View Blast Records
➢Reports
➢Analytic graphs :
➢Manage users
➢Comparative Analysis
➢Faster decision making
18. Smart Blasting APPBlasting Field Usage and Intelligence Solution – Mobile APP
Integrated Android and iPhone Offline Mobile app to enable field verification
19. 1.BLAST DESIGNER
DRILL EQUIPMENT
1 Drilling sheet
from blast
designer is fed
into drilling
equipment
2.DRILL
INFORMATION
MANAGEMENT
SYSTEM
2
Actual drilling
data is fed into
DRIMS
3
Drilling data is
fed into
designer to do
reconciliation
of deviation
and charging
design
EXPLOSIVE TRUCKS 3.BLAST INFORMATION
MANAGEMENT SYSTEM
4
Charging sheet
from blast
designer is fed
into explosive
trucks
5
Actual blasting
data is fed into
BIMS
Example Flow
MineExcellence
Modules
Equipments
20. Machine Learning / Artificial Intelligence
• Auto design future blasts from data of past blast records, drill and blast data and rock characteristics .
• Optimize blast design for a number of parameters like burden, spacing, stemming etc. with an objective to get
targeted parameters like minimum cost, desired fragmentation for each blast.