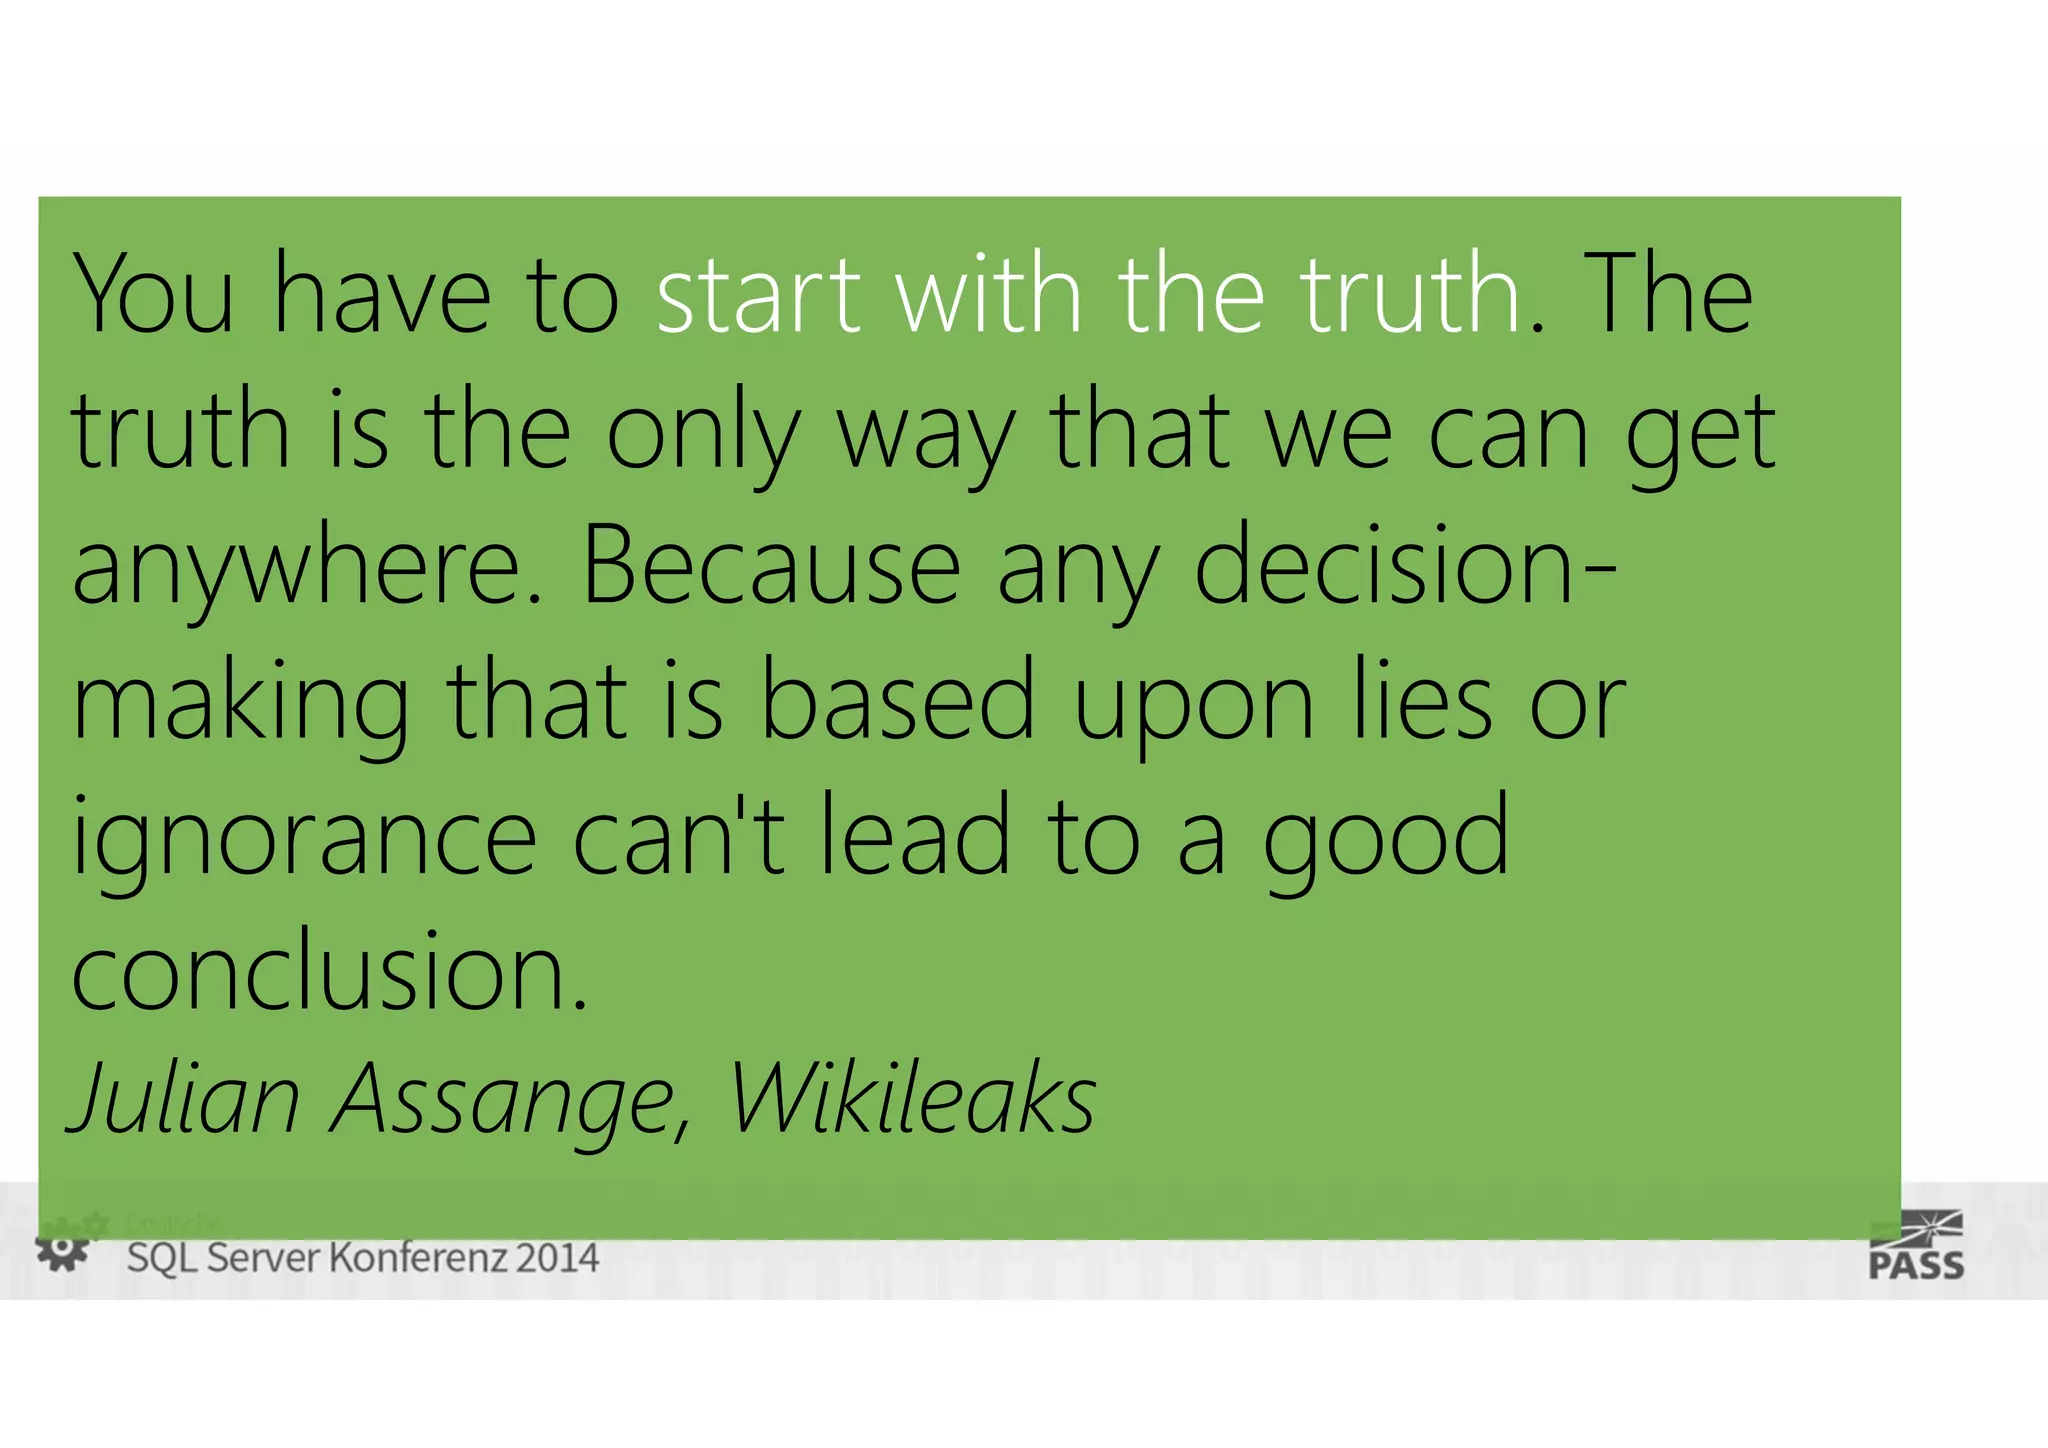
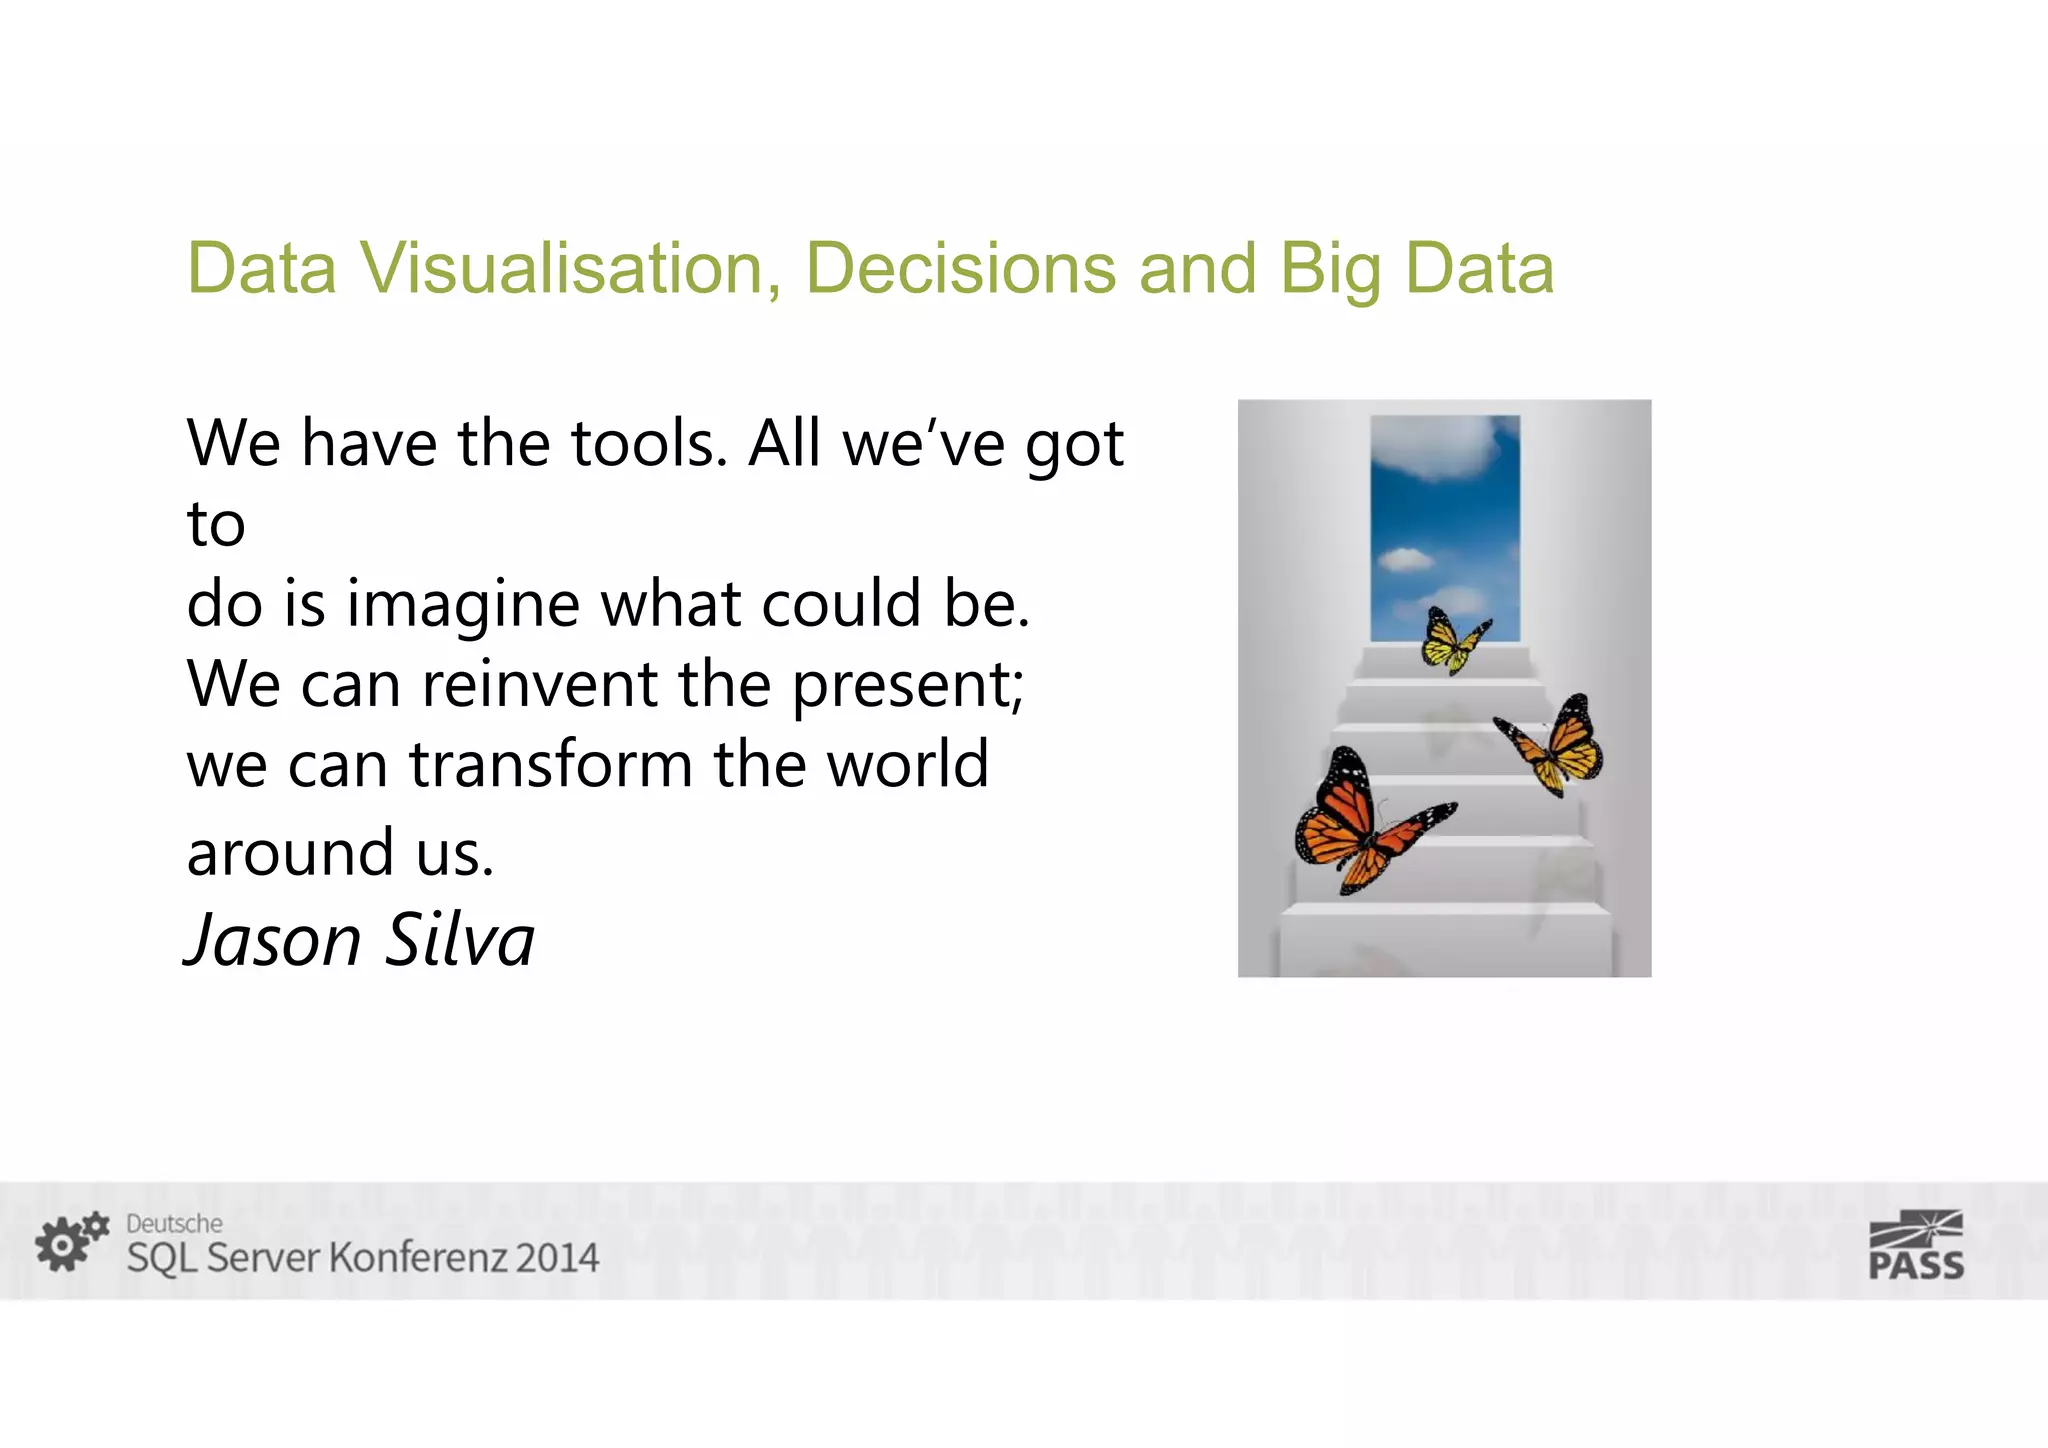
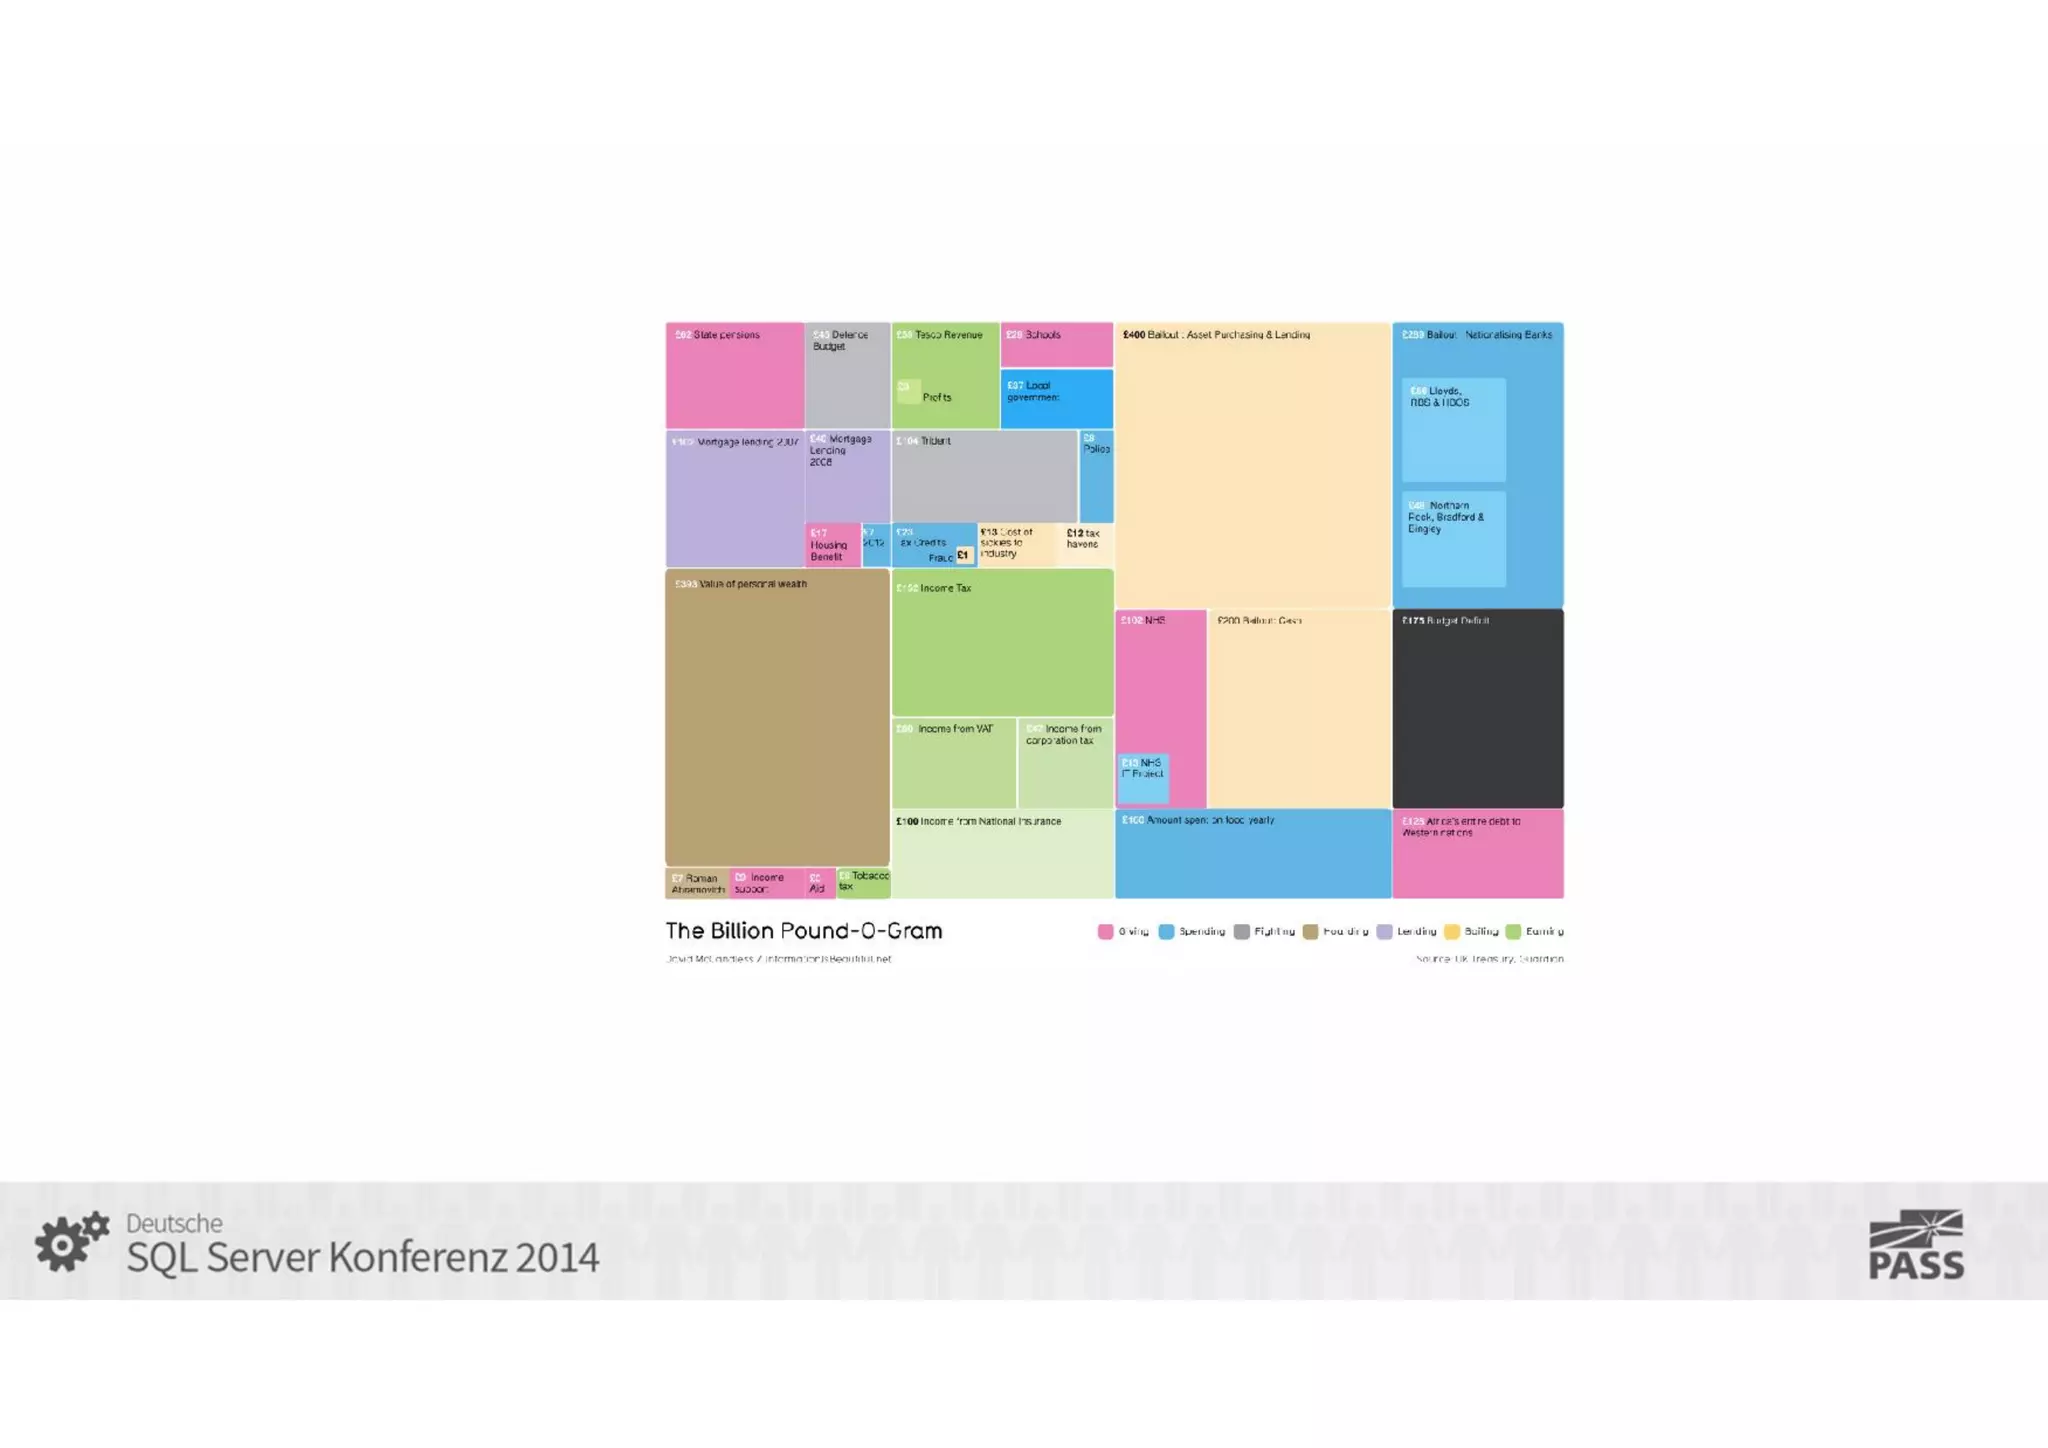
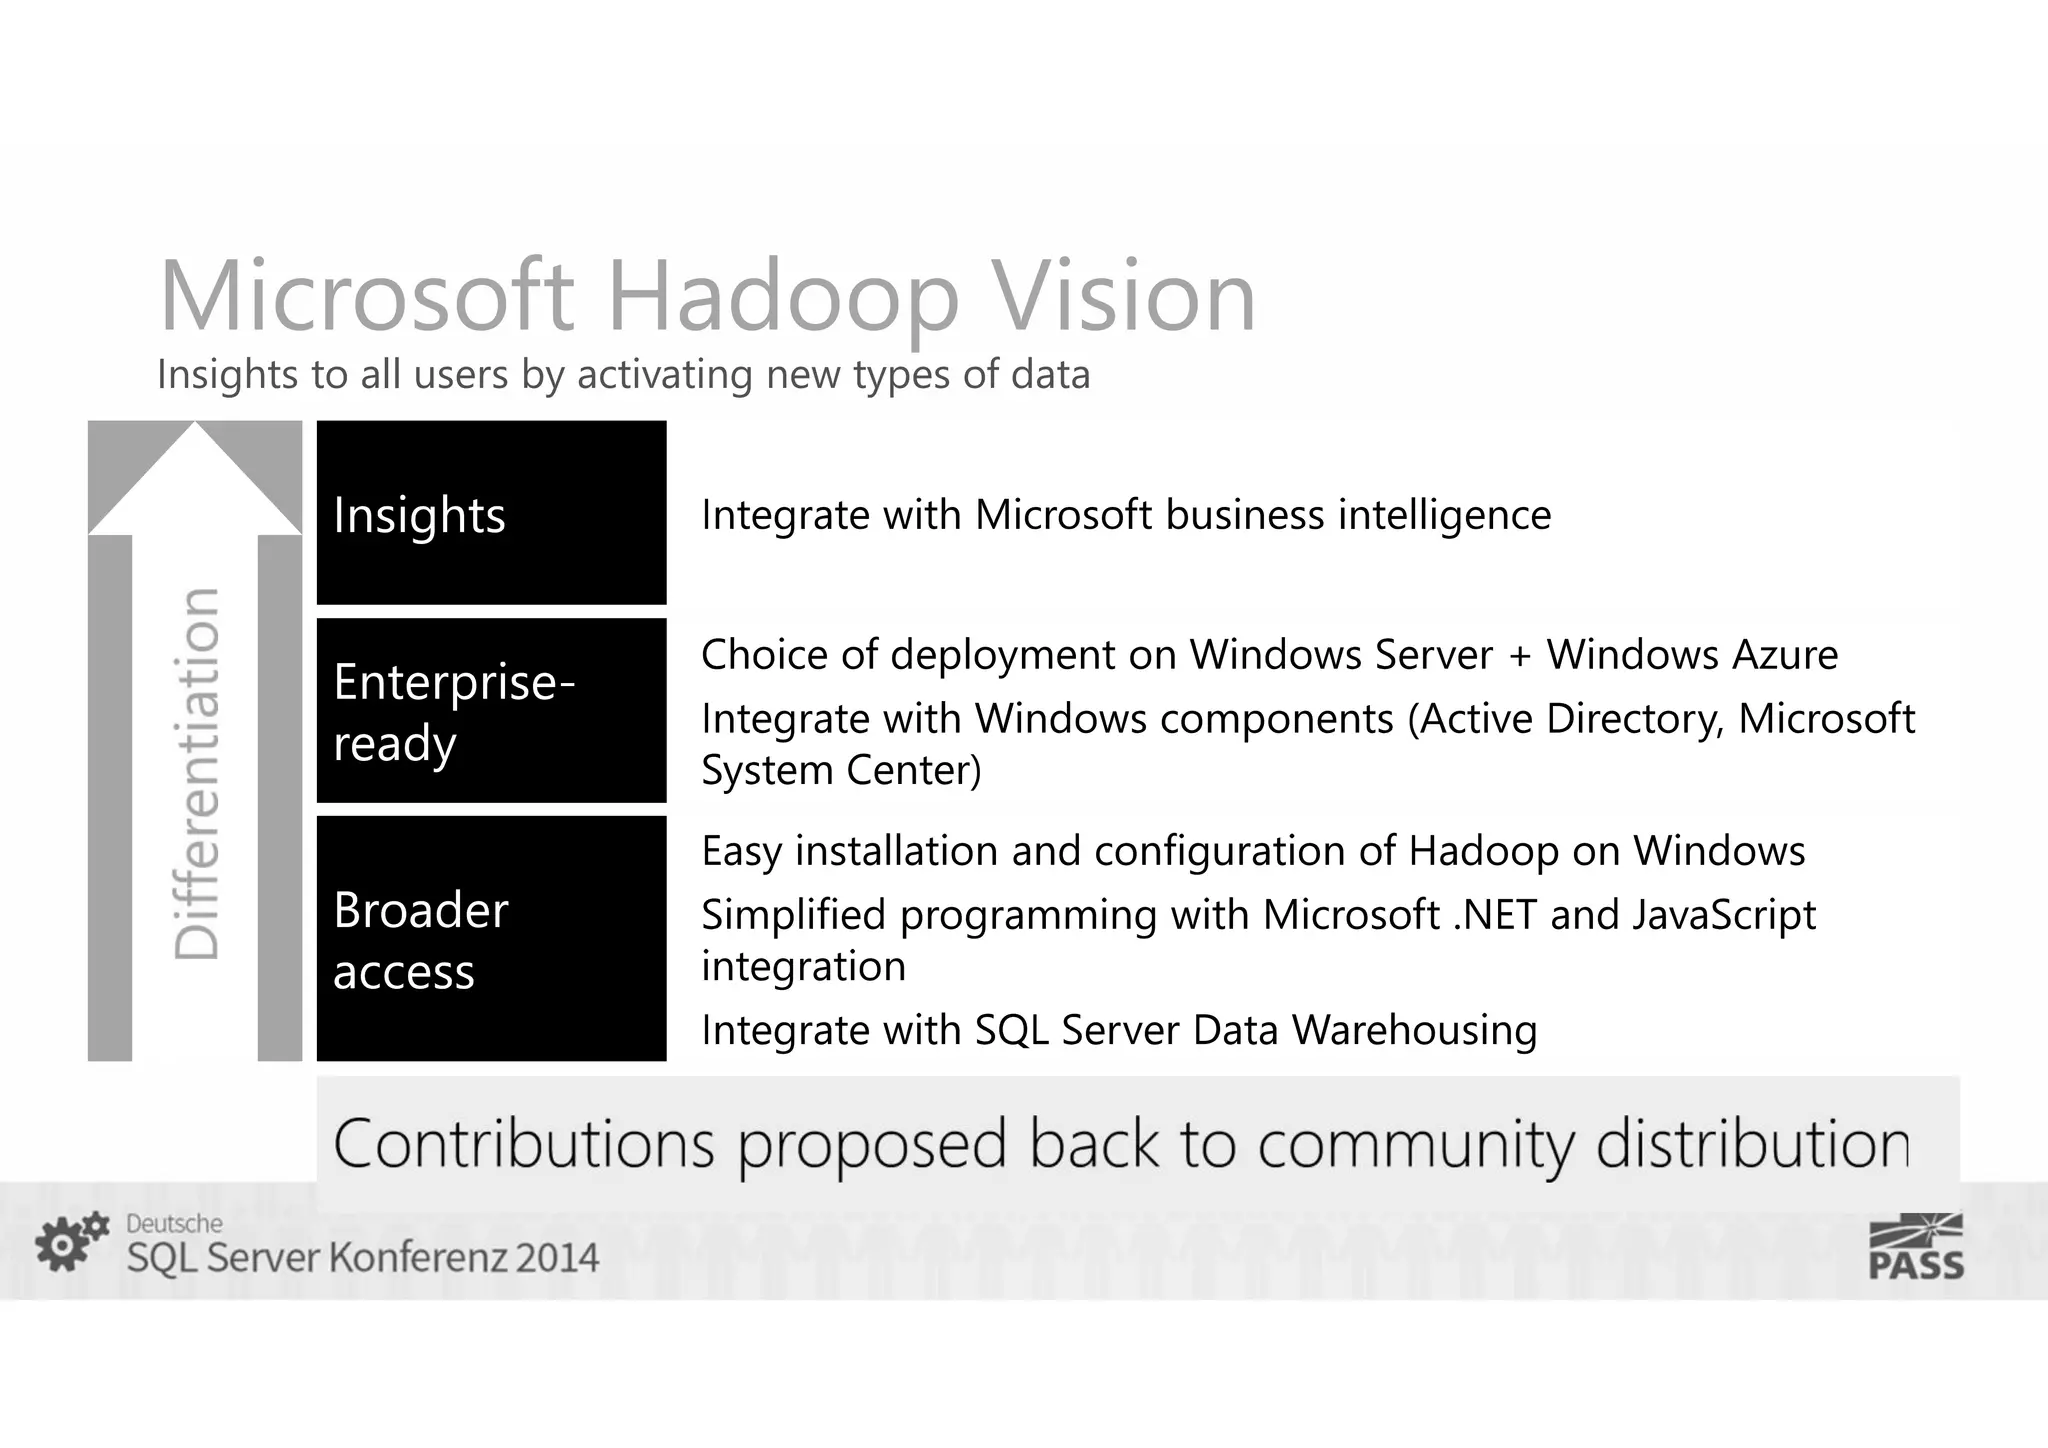
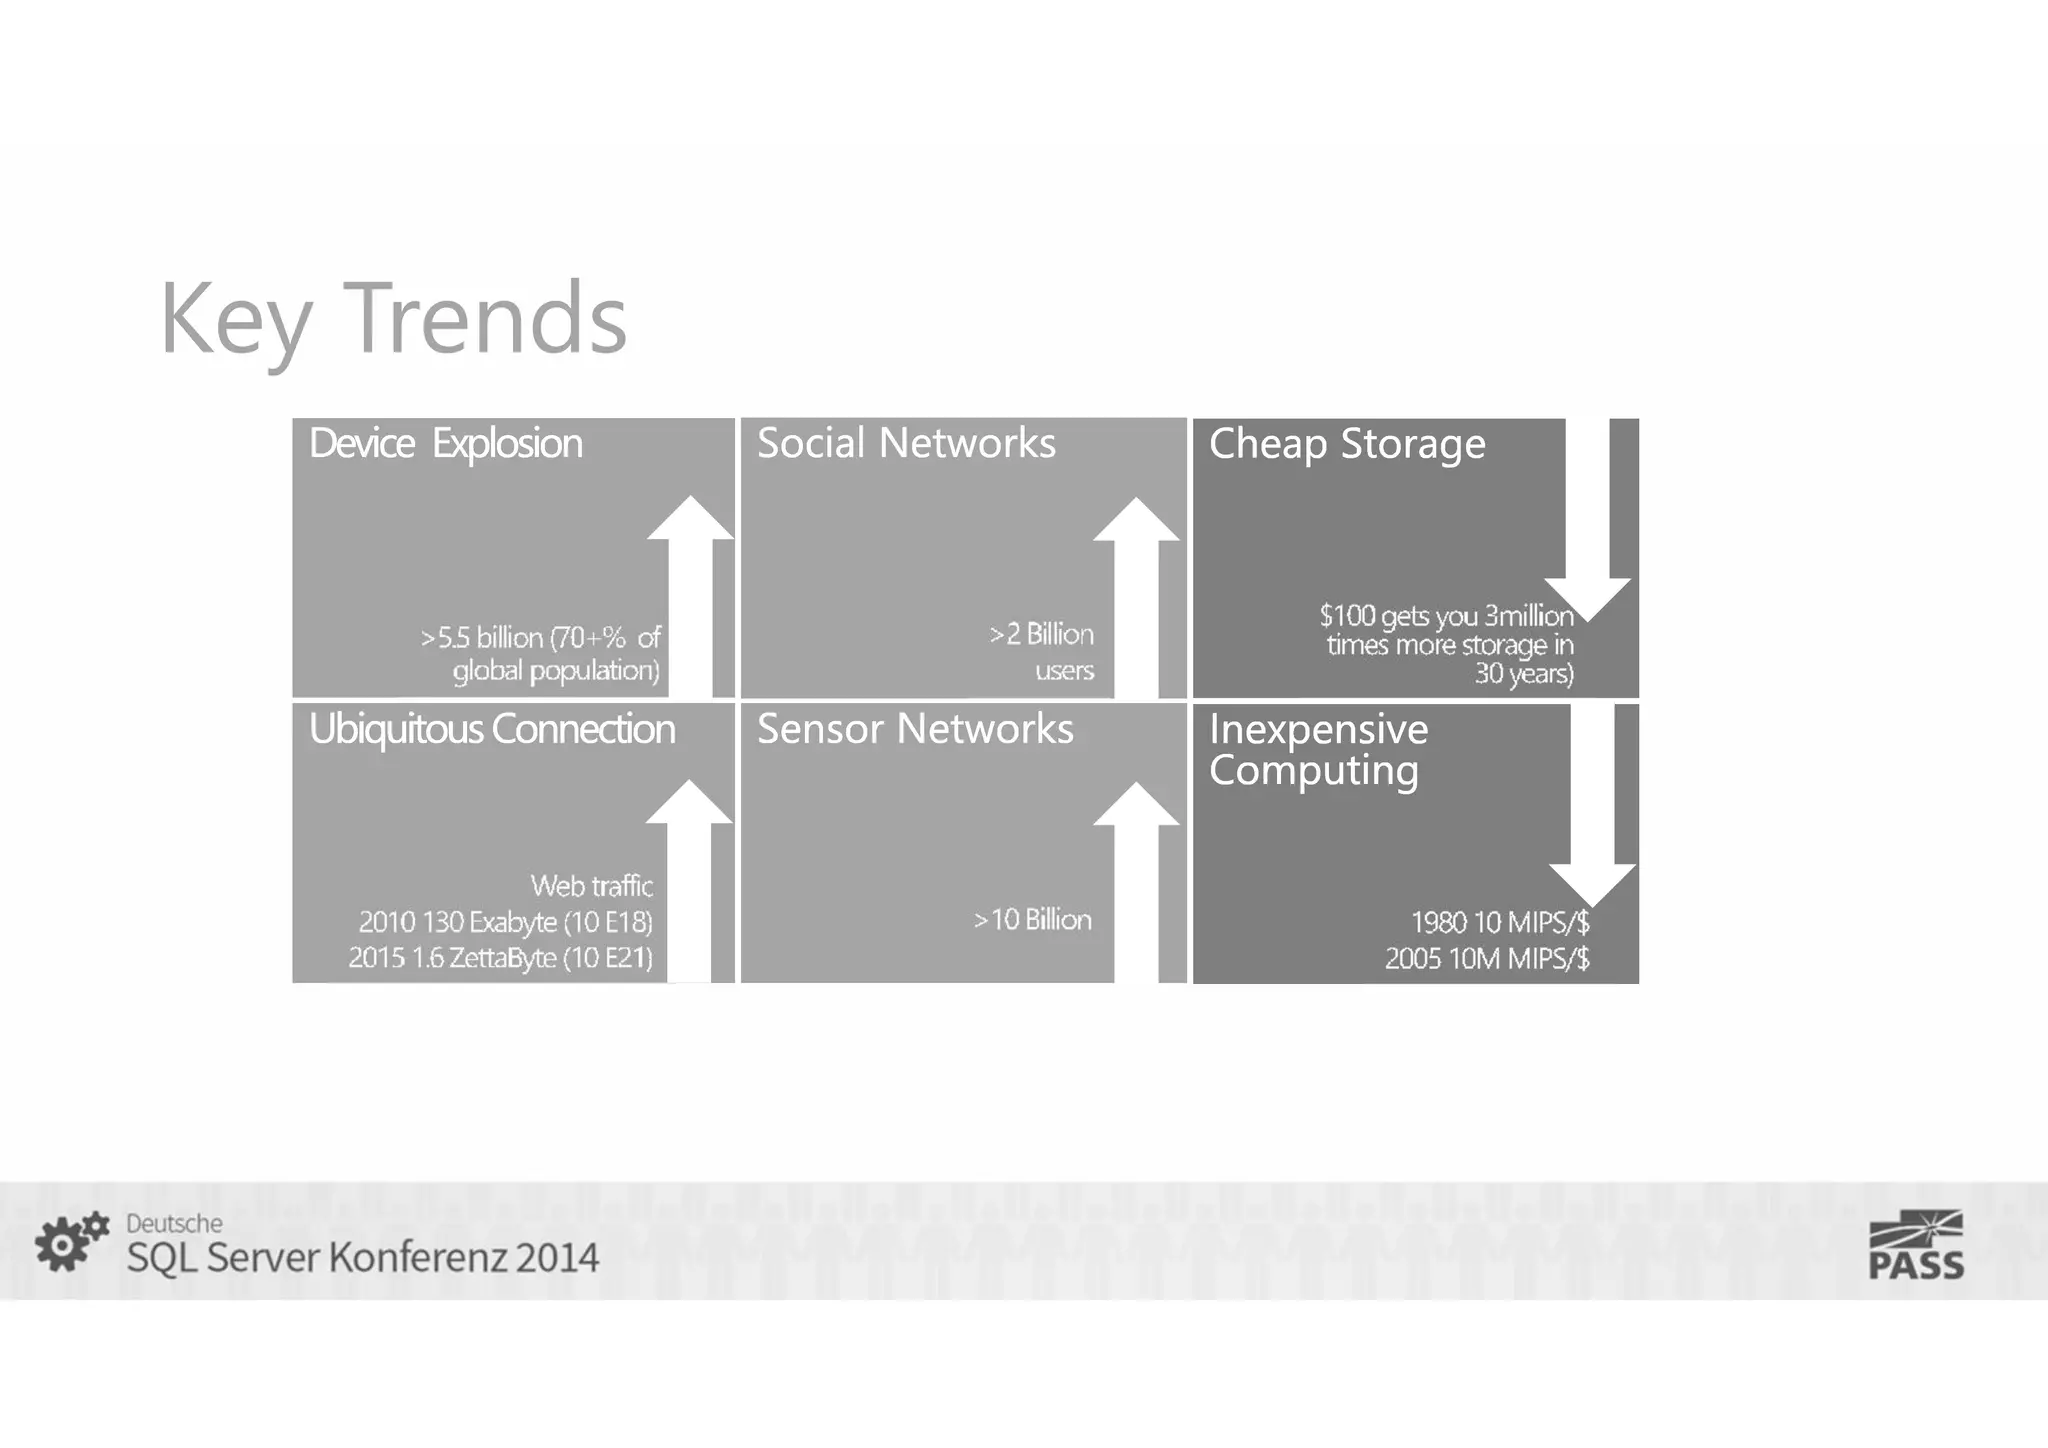
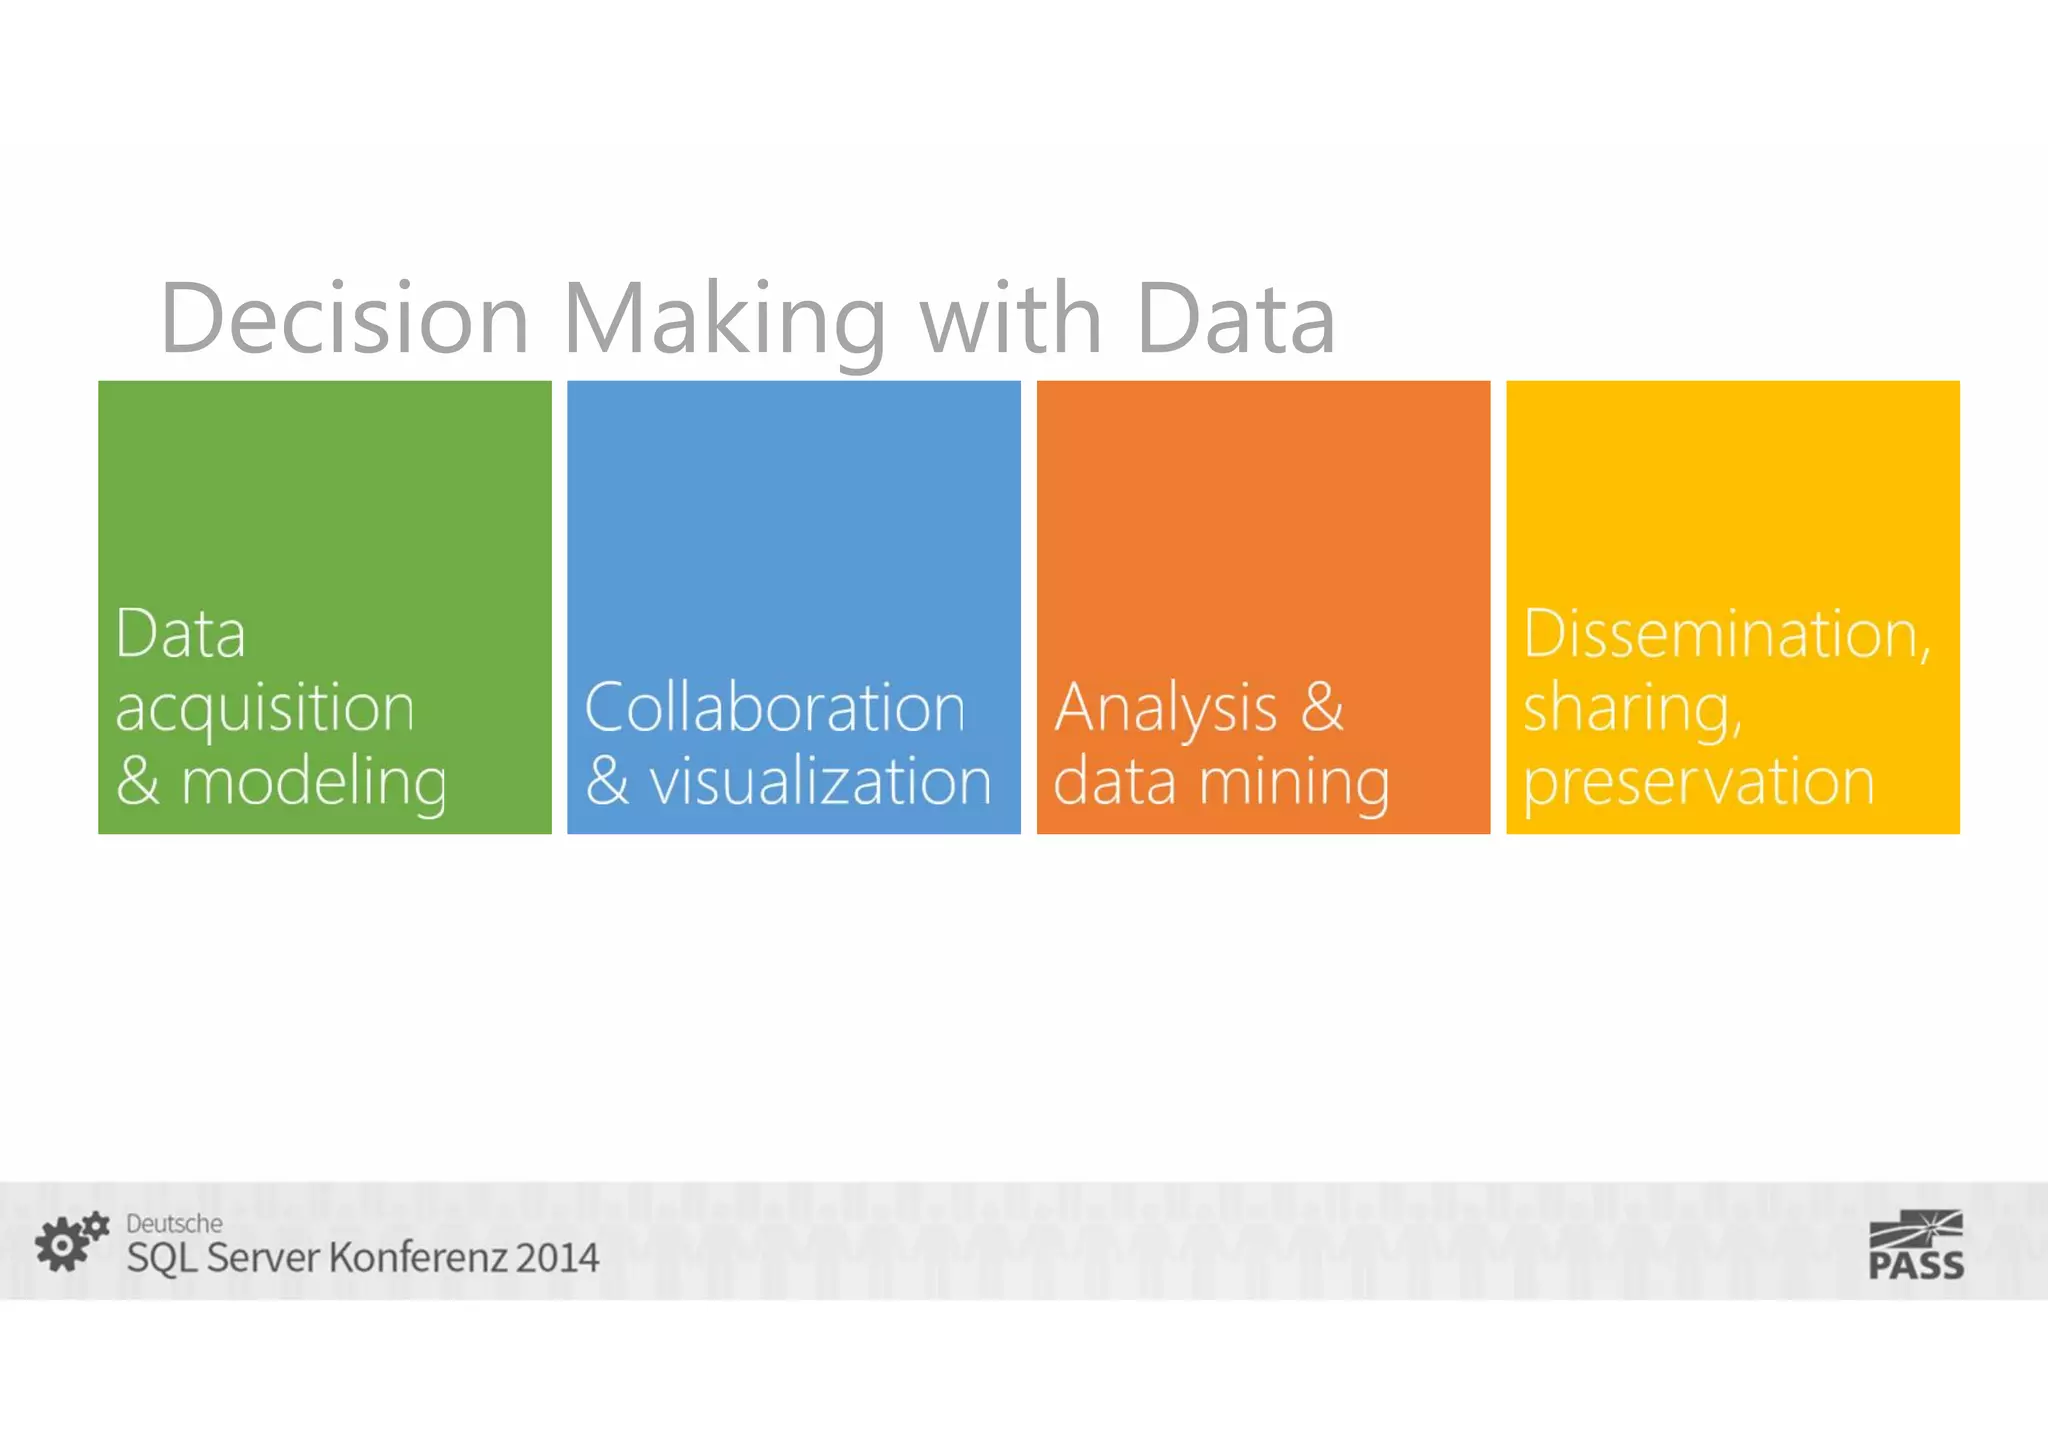
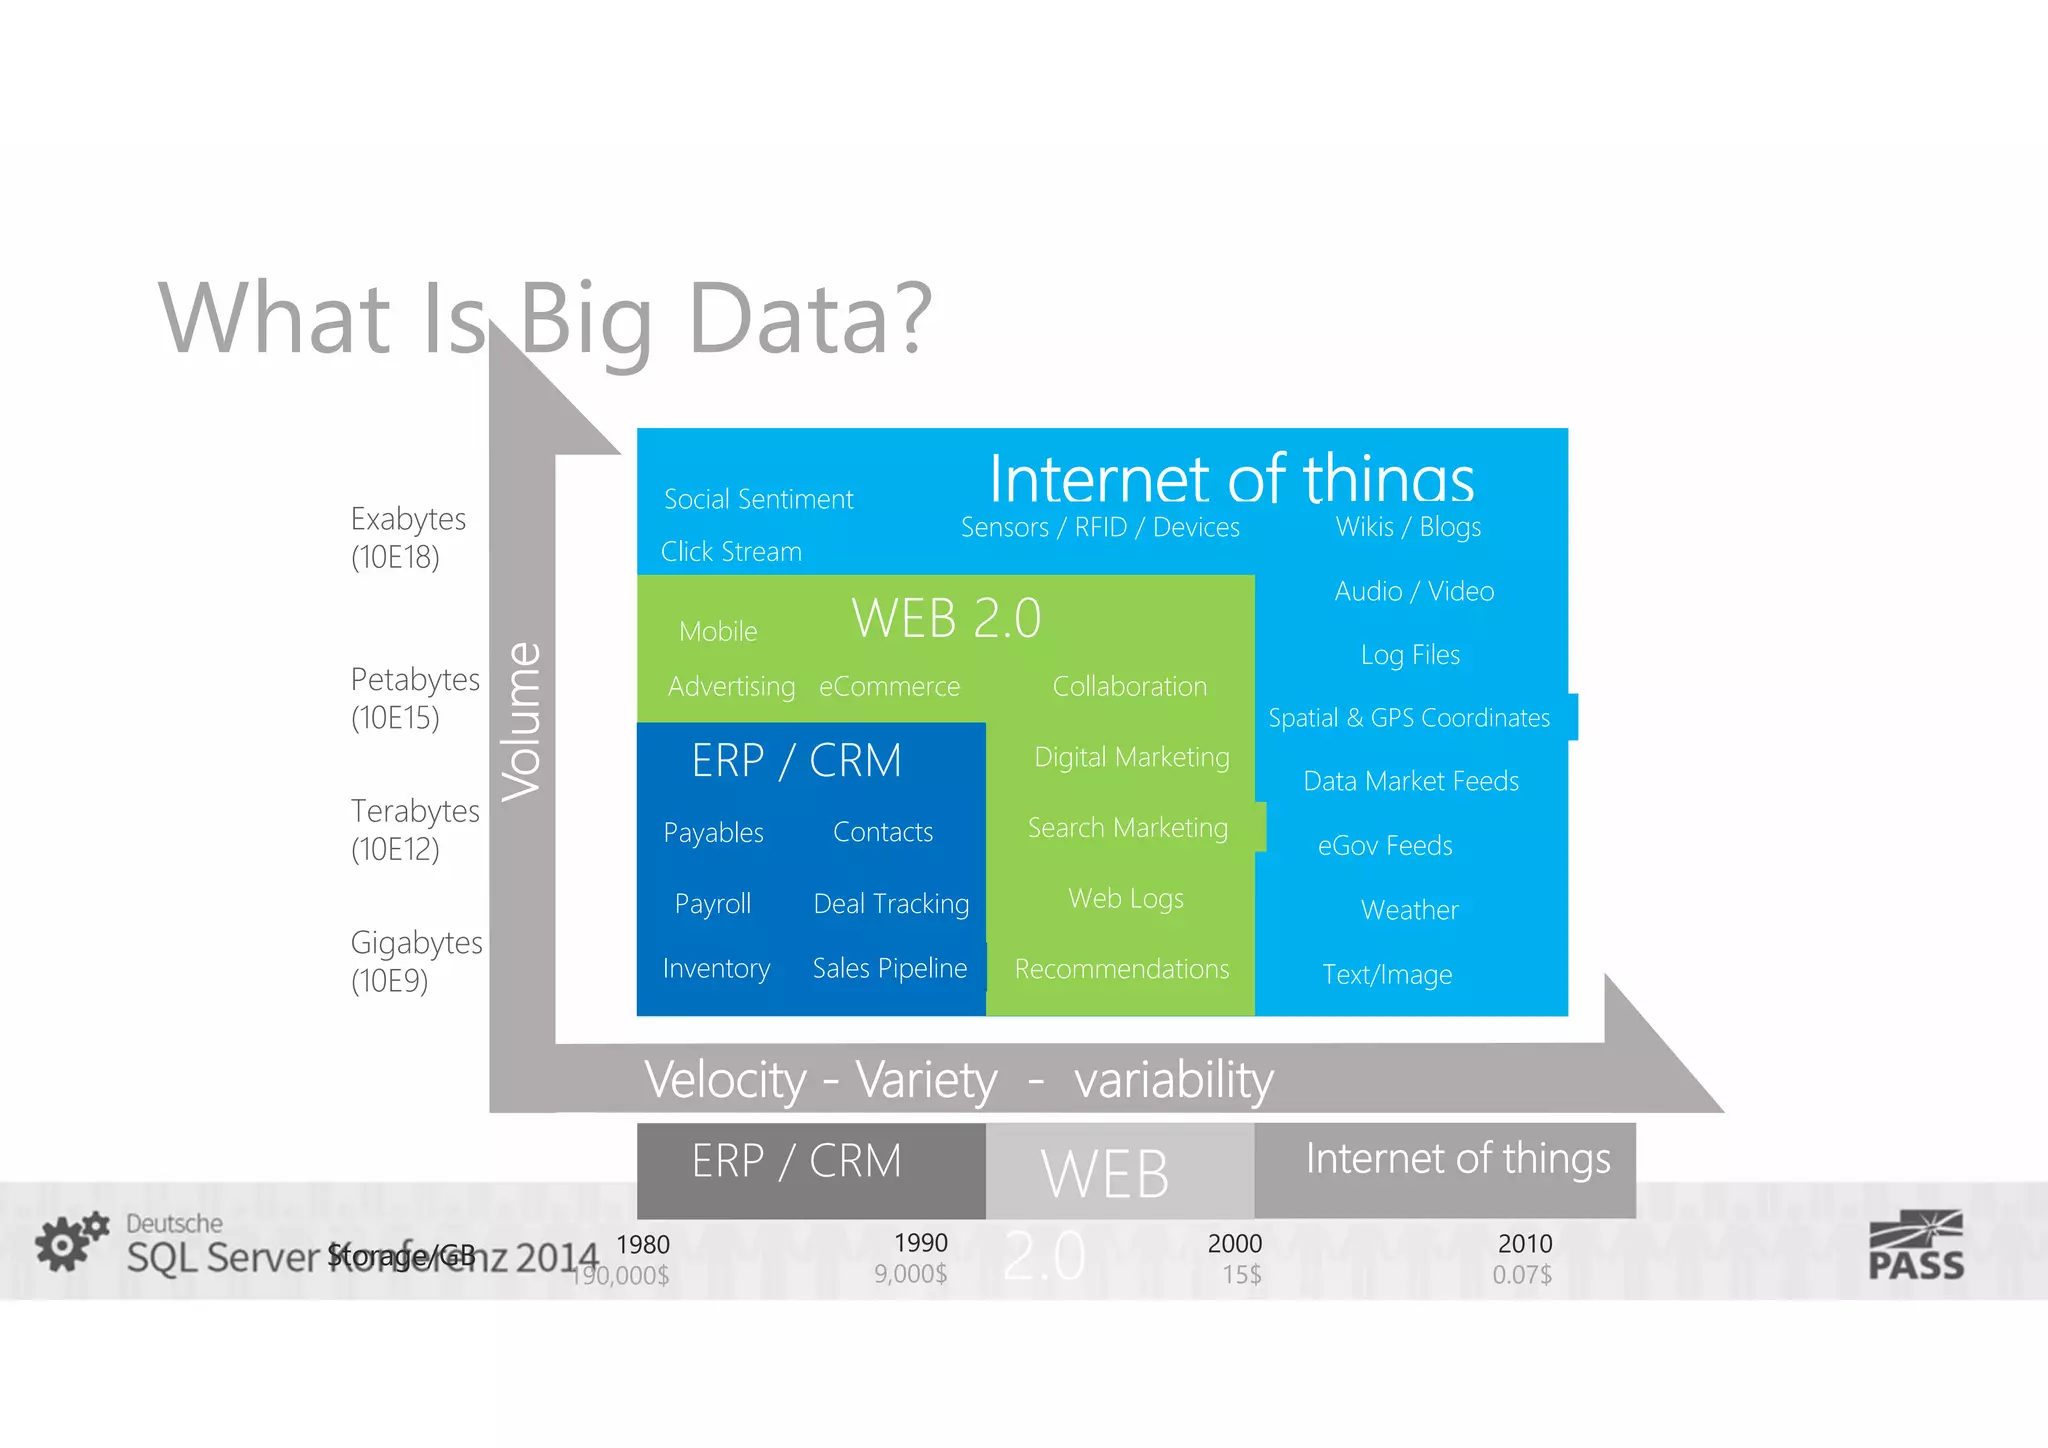
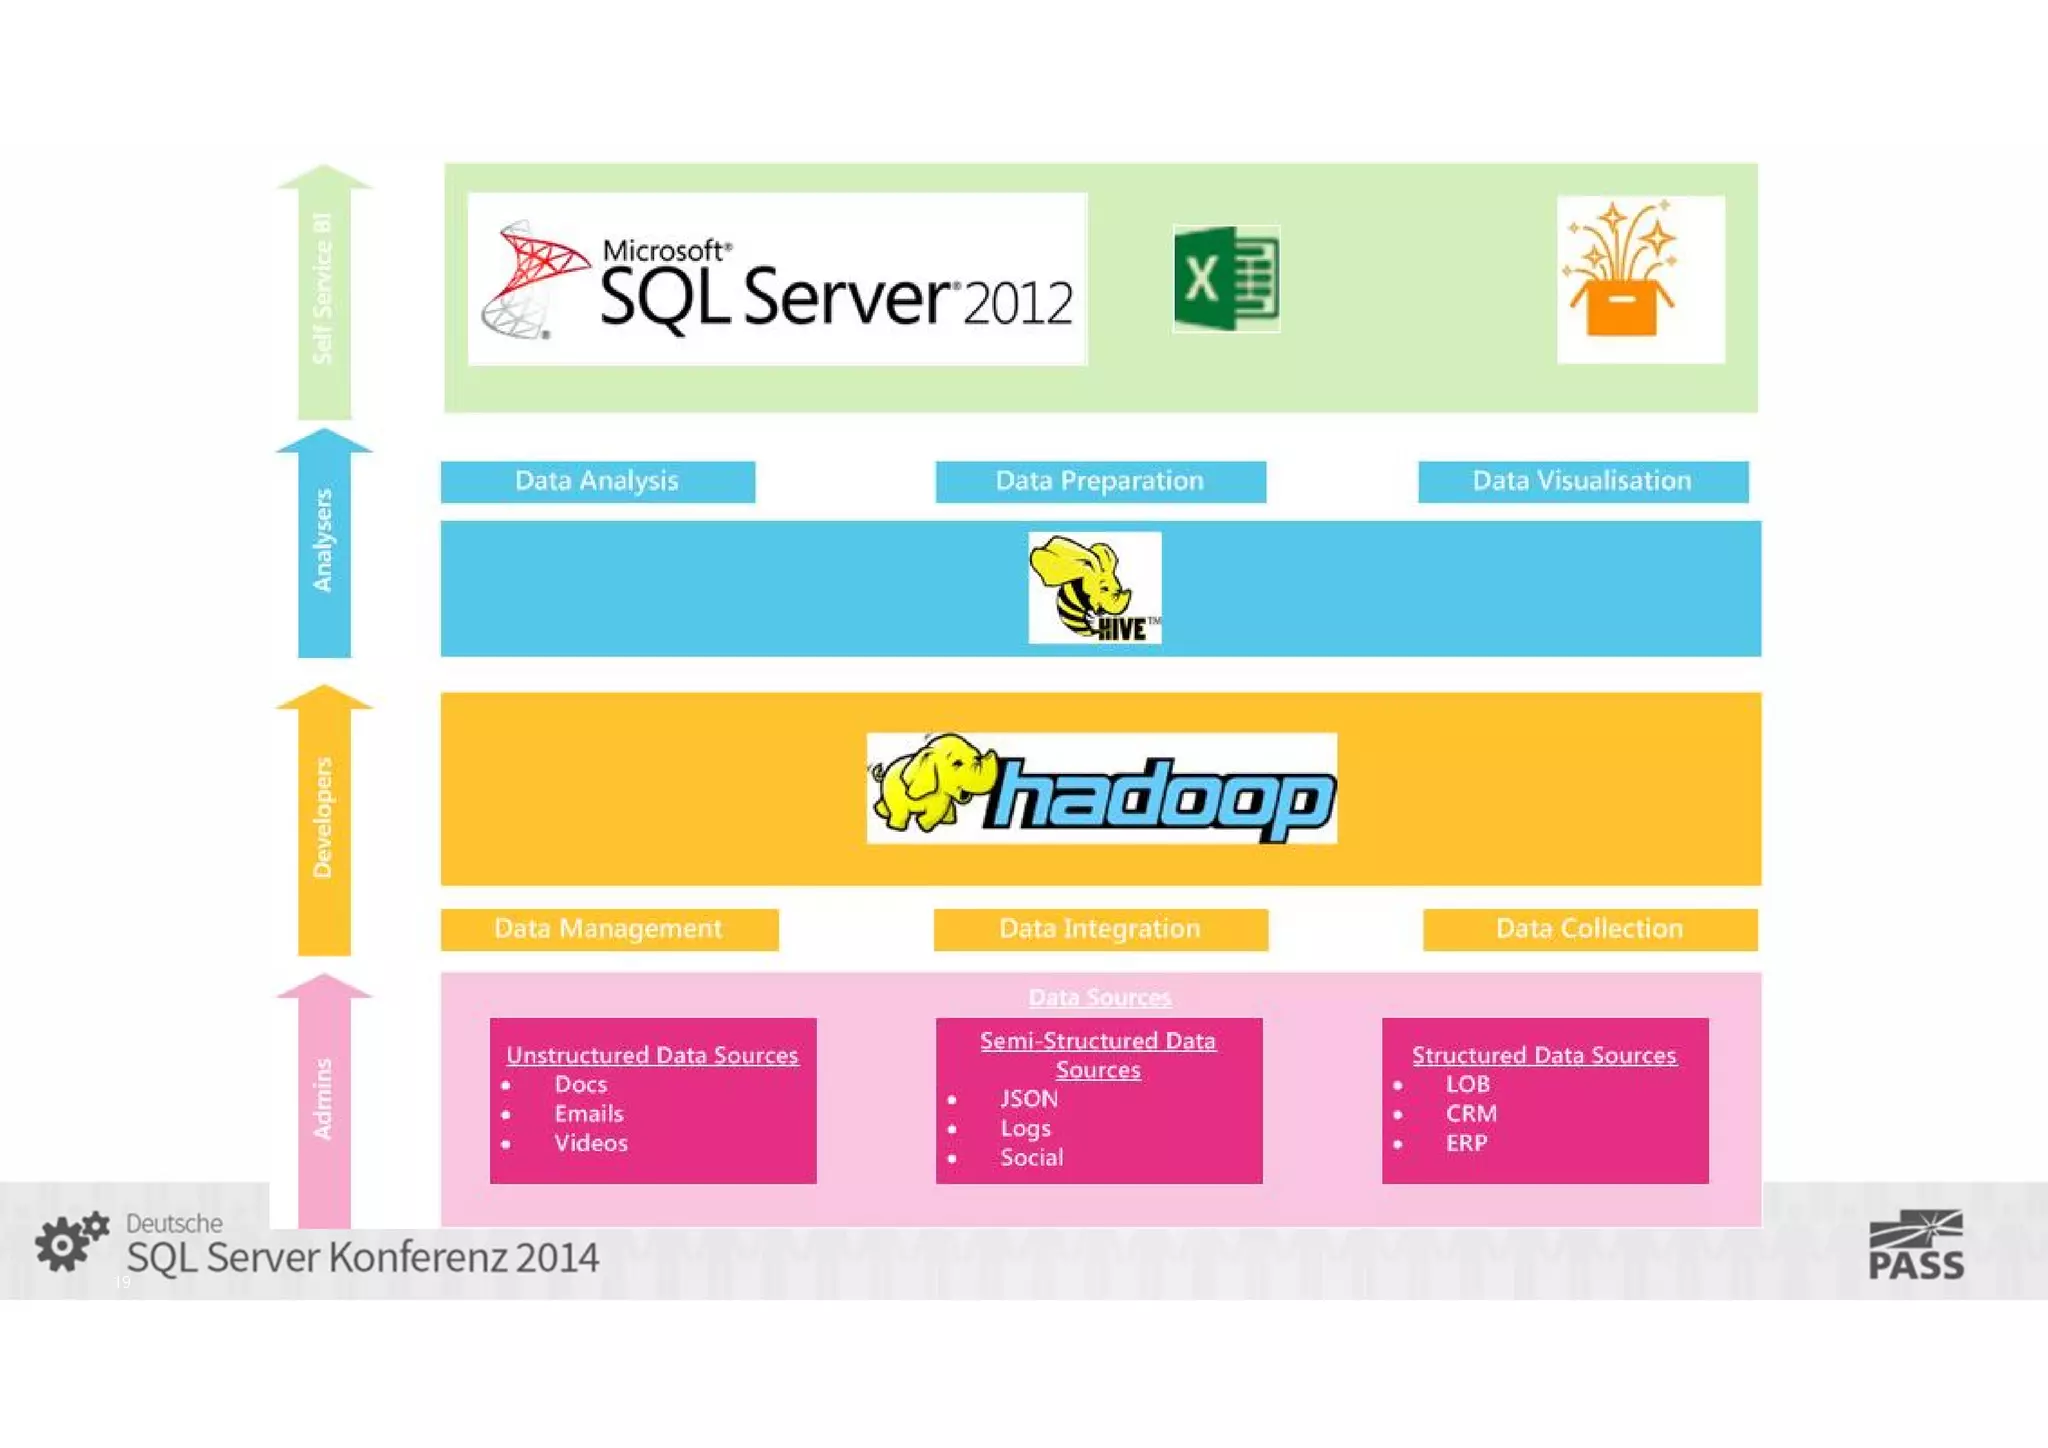
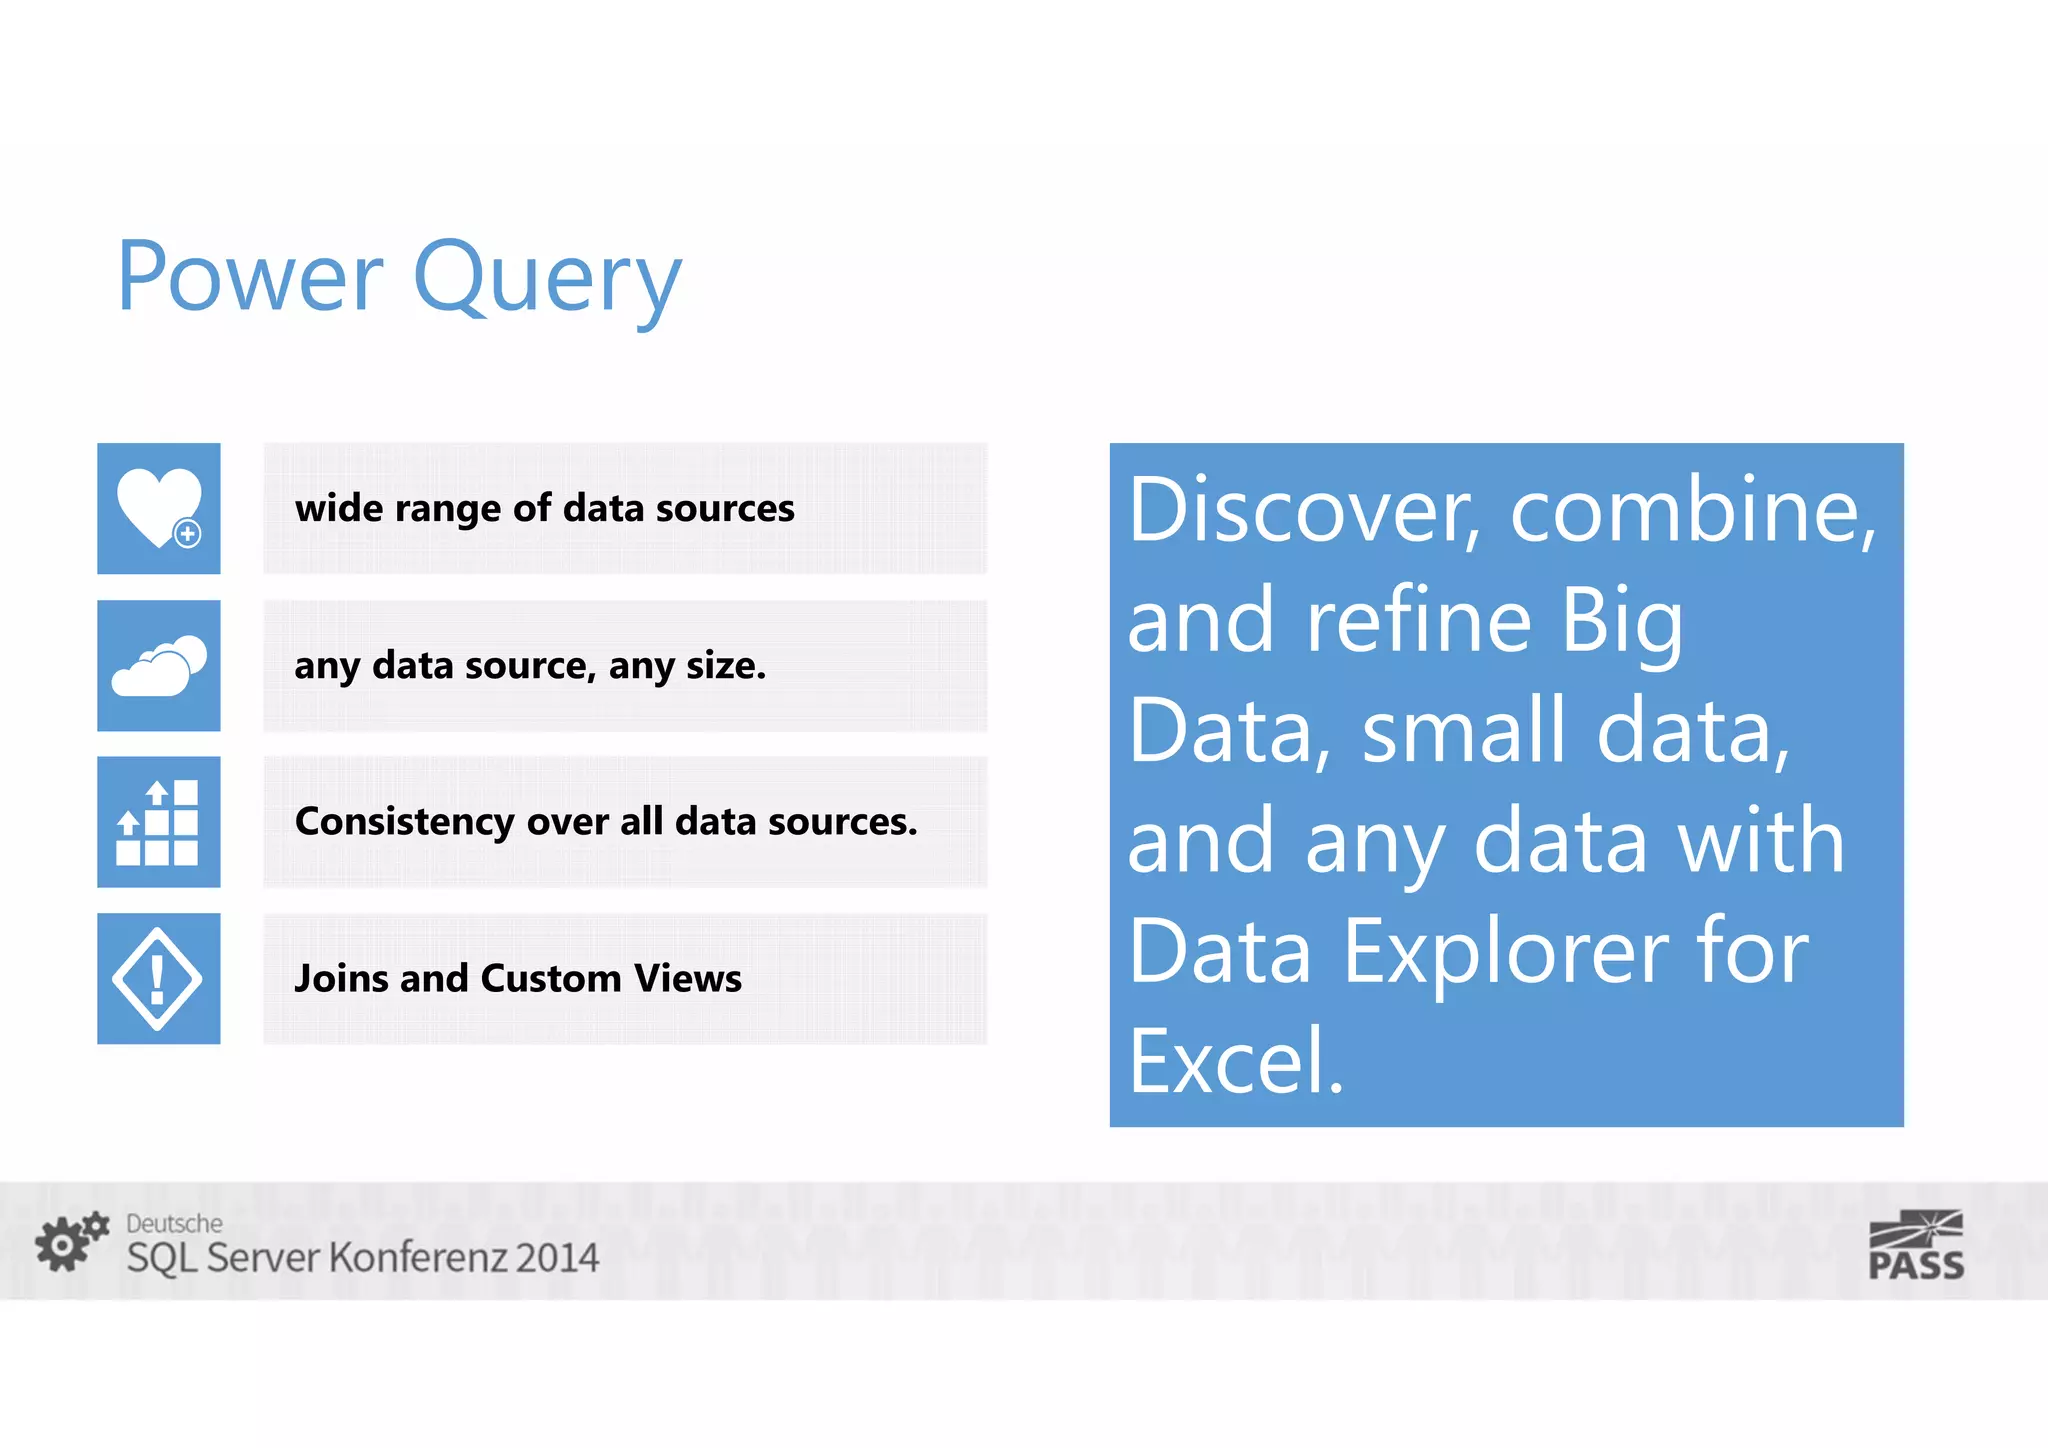
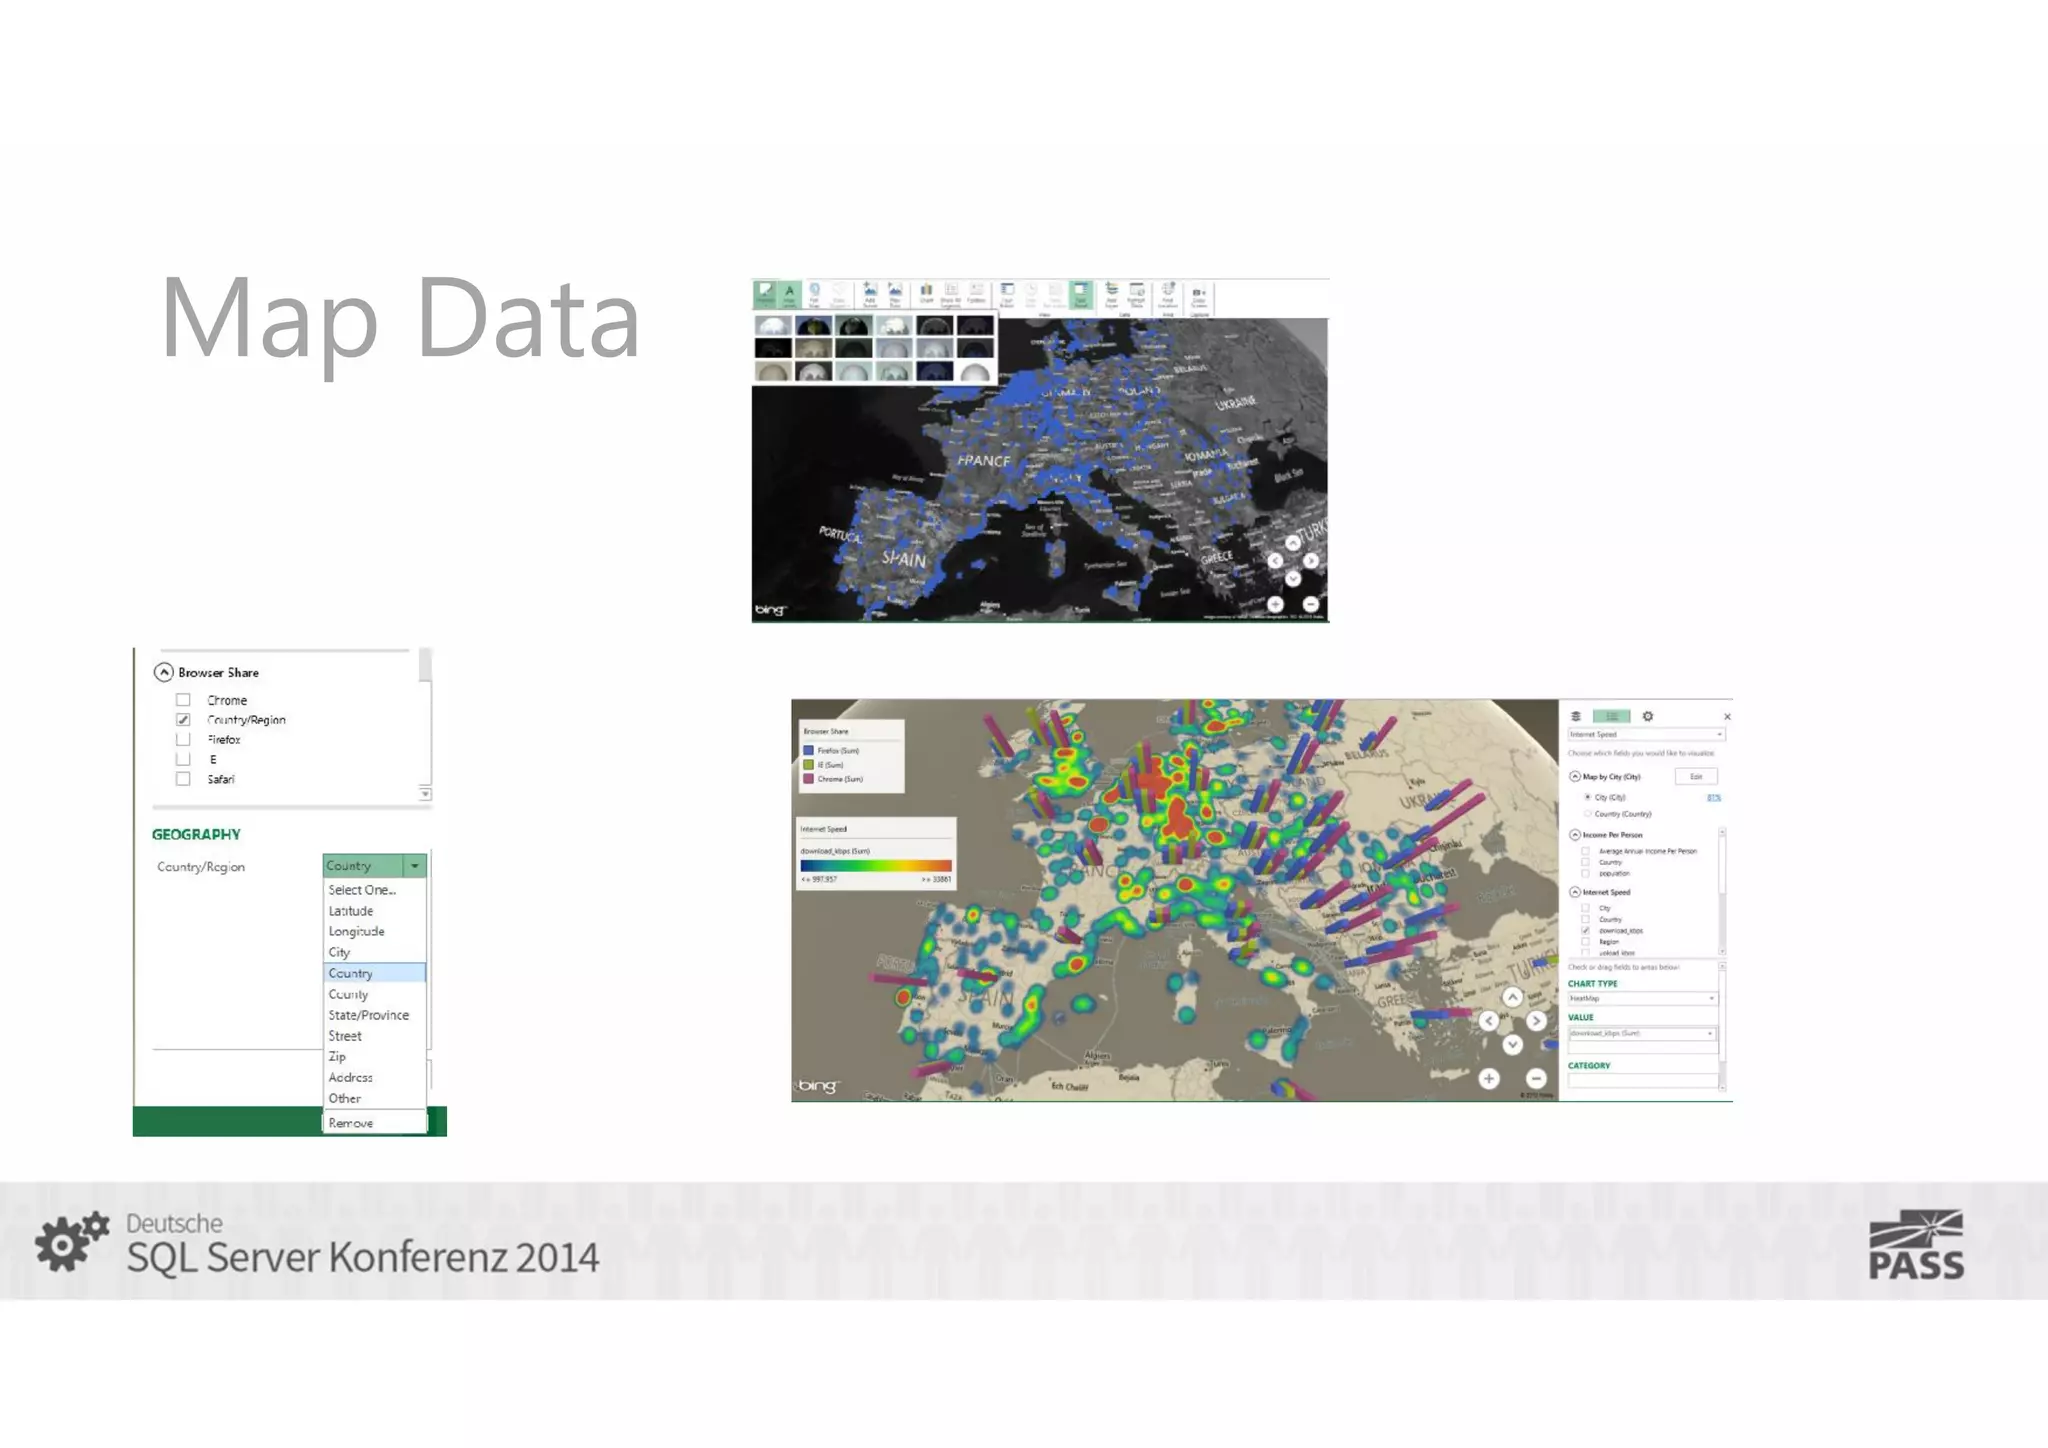
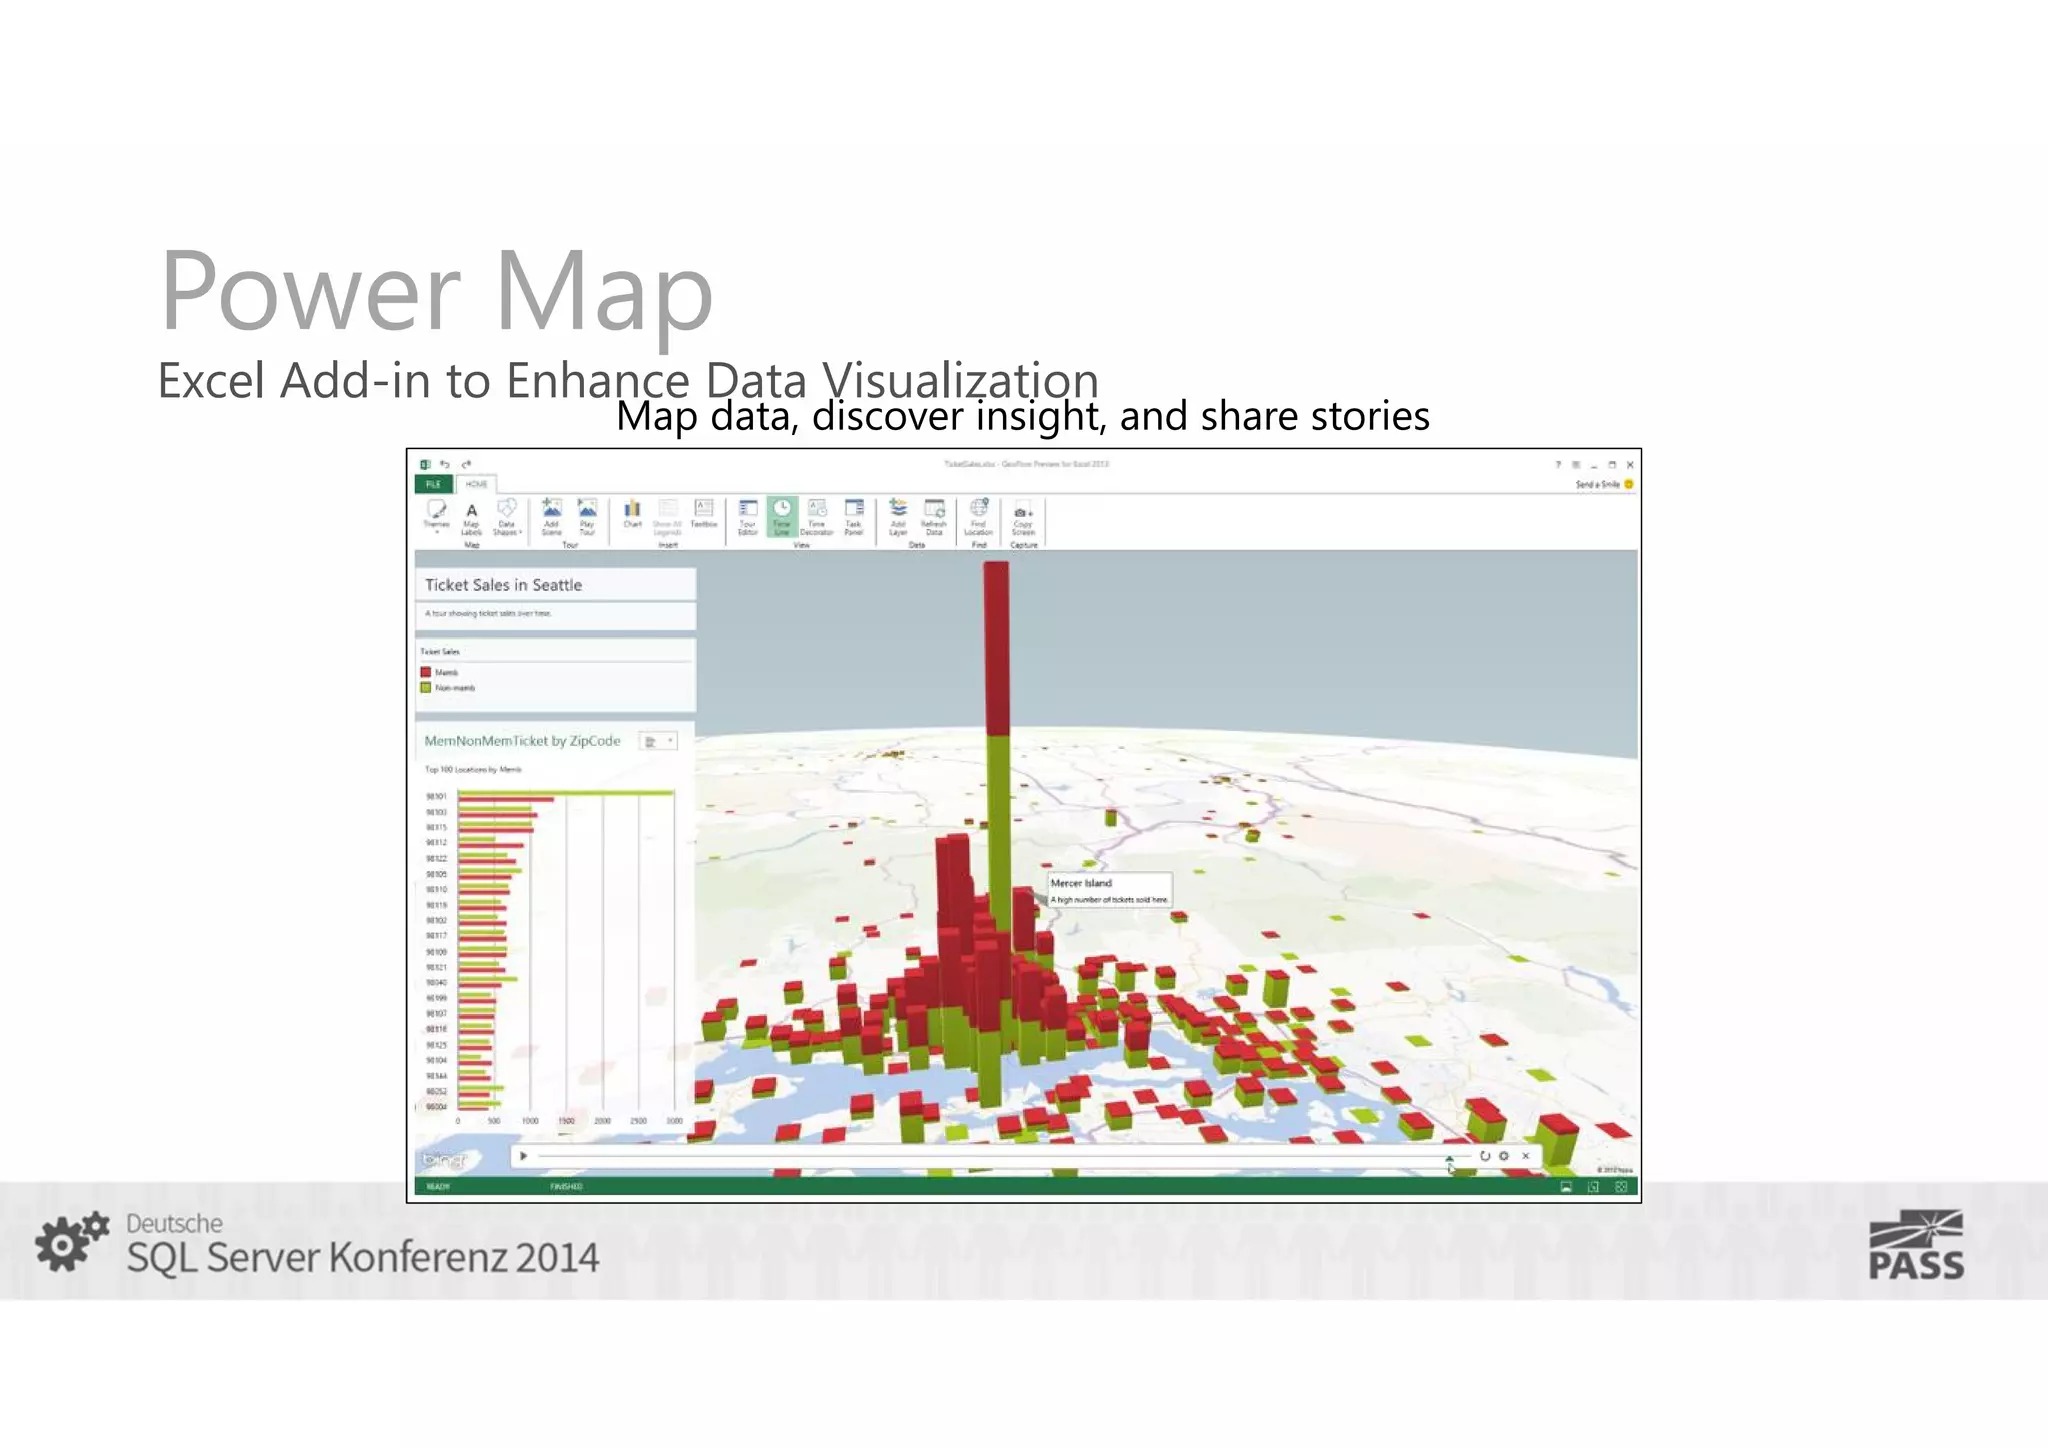
Democratization of Data
From Ideas to Decisions
Who am I?
• Jen Stirrup MVP
• PASS Director (Virtual Chapters) and holder of the Europe seat
• Joint owner of Copper Blue Consulting
• Focus on Data Visualisation and Business Intelligence
• Speaker at SQLBits, SQLPass and TechEd
Genius depends upon the
data within its reach.
Ernest Dimnet
You have to start with the truth. The
truth is the only way that we can get
anywhere. Because any decisionmaking that is based upon lies or
ignorance can't lead to a good
conclusion.
Julian Assange, Wikileaks
You have to start with the truth. The
truth is the only way that we can get
anywhere. Because any decisionmaking that is based upon lies or
ignorance can't lead to a good
conclusion.
Julian Assange, Wikileaks
Data Visualisation, Decisions and Big Data
We have the tools. All we’ve got
to
do is imagine what could be.
We can reinvent the present;
we can transform the world
around us.

Jason Silva
• Almost 50% of your brain
is dedicated to visual
processing.
• David van Essen

Researchers found that colour
visuals increase the willingness to
read by

80%

About 70% of your
sensory receptors are in
your eyes.
Pie Charts
Pie Charts
Pie Charts
Pie Charts
Trellis Charts
Microsoft Hadoop Vision
Insights to all users by activating new types of data
Key Trends
Decision Making with Data
What Is Big Data?

Terabytes
(10E12)

Click Stream

Volume

Petabytes
(10E15)

Internet of things
Wikis / Blogs
Sensors / RFID / Devices

Social Sentiment

Exabytes
(10E18)

Gigabytes
(10E9)

Mobile

WEB 2.0

Advertising eCommerce

ERP / CRM
Payables

Audio / Video

Contacts

Collaboration

Log Files
Spatial & GPS Coordinates

Digital Marketing
Search Marketing

Payroll

Deal Tracking

Web Logs

Inventory

Sales Pipeline

Recommendations

Data Market Feeds
eGov Feeds
Weather
Text/Image

Velocity - Variety - variability
ERP / CRM
Storage/GB

1980
190,000$

1990
9,000$

WEB
2.0

Internet of things
2000
15$

2010
0.07$
19
Hadoop vs RDBMs
Apache Hadoop isn’t a substitute for a
database
• It is not Relational
• Key Value pairs
• Big Data
Hadoop vs RDBMs
• Unstructured / Semi structured
• Structured
• Works together with RDBMs
Easy Access to Data, Big and Small
Microsoft Power
1 Billion Office Users

Discover

Analyze

Visualize

Share

Find

Q&A

Scalable | Manageable | Trusted

Mobile
Power Query
wide range of data sources

any data source, any size.
Consistency over all data sources.

Joins and Custom Views

Discover, combine,
and refine Big
Data, small data,
and any data with
Data Explorer for
Excel.
Power Query
Power Query Data Sources
Azure SQL
Database

Windows Azure
Marketplace
Windows Active
Directory

S

Azure HDInsight
Analyse and Model with Excel 2013
Power View
Introducing Power View
It is now also available in Excel 2013, and with new features:
•
•
•
•
•

Maps
Pie charts
Hierarchies
KPIs
Drill down/Drill
up

• Report styles,

themes and text
resizing
• Backgrounds with
images
• Hyperlinks

• Printing
Powerful Self-Service BI with Excel 2013
What Is Power Map?

Power Map for Microsoft Excel enables information workers to discover and share new insights
from geographical and temporal data through three-dimensional storytelling.
Power Map: Steps to 3D insights
Map Data

Discover Insights

Share Stories

• Data in Excel
• Geo-Code
• 3D and 3 Visuals

• Play over Time
• Annotate points
• Capture scenes

• Cinematic Effects
• Interactive Tours
• Share Workbook
Map Data
Power Map

Excel Add-in to Enhance Data Visualization

Map data, discover insight, and share stories
democratization of data sql-konferenz

democratization of data sql-konferenz

  • 1.
    Democratization of Data FromIdeas to Decisions
  • 2.
    Who am I? •Jen Stirrup MVP • PASS Director (Virtual Chapters) and holder of the Europe seat • Joint owner of Copper Blue Consulting • Focus on Data Visualisation and Business Intelligence • Speaker at SQLBits, SQLPass and TechEd
  • 4.
    Genius depends uponthe data within its reach. Ernest Dimnet
  • 5.
    You have tostart with the truth. The truth is the only way that we can get anywhere. Because any decisionmaking that is based upon lies or ignorance can't lead to a good conclusion. Julian Assange, Wikileaks
  • 6.
    You have tostart with the truth. The truth is the only way that we can get anywhere. Because any decisionmaking that is based upon lies or ignorance can't lead to a good conclusion. Julian Assange, Wikileaks
  • 7.
    Data Visualisation, Decisionsand Big Data We have the tools. All we’ve got to do is imagine what could be. We can reinvent the present; we can transform the world around us. Jason Silva
  • 8.
    • Almost 50%of your brain is dedicated to visual processing. • David van Essen Researchers found that colour visuals increase the willingness to read by 80% About 70% of your sensory receptors are in your eyes.
  • 9.
  • 10.
  • 11.
  • 12.
  • 13.
  • 15.
    Microsoft Hadoop Vision Insightsto all users by activating new types of data
  • 16.
  • 17.
  • 18.
    What Is BigData? Terabytes (10E12) Click Stream Volume Petabytes (10E15) Internet of things Wikis / Blogs Sensors / RFID / Devices Social Sentiment Exabytes (10E18) Gigabytes (10E9) Mobile WEB 2.0 Advertising eCommerce ERP / CRM Payables Audio / Video Contacts Collaboration Log Files Spatial & GPS Coordinates Digital Marketing Search Marketing Payroll Deal Tracking Web Logs Inventory Sales Pipeline Recommendations Data Market Feeds eGov Feeds Weather Text/Image Velocity - Variety - variability ERP / CRM Storage/GB 1980 190,000$ 1990 9,000$ WEB 2.0 Internet of things 2000 15$ 2010 0.07$
  • 19.
  • 20.
    Hadoop vs RDBMs ApacheHadoop isn’t a substitute for a database • It is not Relational • Key Value pairs • Big Data
  • 21.
    Hadoop vs RDBMs •Unstructured / Semi structured • Structured • Works together with RDBMs
  • 22.
    Easy Access toData, Big and Small
  • 23.
    Microsoft Power 1 BillionOffice Users Discover Analyze Visualize Share Find Q&A Scalable | Manageable | Trusted Mobile
  • 24.
    Power Query wide rangeof data sources any data source, any size. Consistency over all data sources. Joins and Custom Views Discover, combine, and refine Big Data, small data, and any data with Data Explorer for Excel.
  • 25.
  • 26.
    Power Query DataSources Azure SQL Database Windows Azure Marketplace Windows Active Directory S Azure HDInsight
  • 27.
    Analyse and Modelwith Excel 2013
  • 28.
  • 29.
    Introducing Power View Itis now also available in Excel 2013, and with new features: • • • • • Maps Pie charts Hierarchies KPIs Drill down/Drill up • Report styles, themes and text resizing • Backgrounds with images • Hyperlinks • Printing
  • 30.
    Powerful Self-Service BIwith Excel 2013
  • 31.
    What Is PowerMap? Power Map for Microsoft Excel enables information workers to discover and share new insights from geographical and temporal data through three-dimensional storytelling.
  • 32.
    Power Map: Stepsto 3D insights Map Data Discover Insights Share Stories • Data in Excel • Geo-Code • 3D and 3 Visuals • Play over Time • Annotate points • Capture scenes • Cinematic Effects • Interactive Tours • Share Workbook
  • 33.
  • 34.
    Power Map Excel Add-into Enhance Data Visualization Map data, discover insight, and share stories