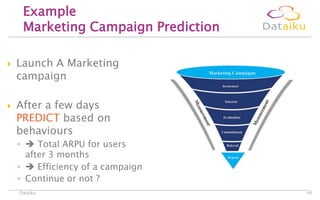
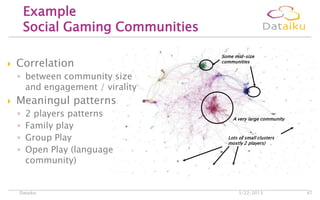
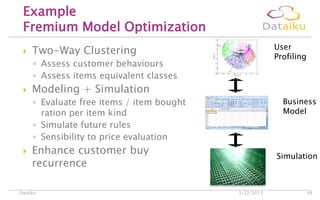
This document discusses how a data analytics lab can help a small European online game company optimize their business using data science techniques. It provides examples of how the company could use analytics to improve marketing campaigns, predict customer value, analyze social gaming communities, and optimize their freemium business model. The document advocates establishing a small cross-functional data team with the right expertise, tools, and focus on experimentation to help drive business decisions with data and analytics.
Dataiku - Big data paris 2015 - A Hybrid Platform, a Hybrid Team Dataiku
Between traditional Business Intelligence and "Big Data" approaches, many companies need to innovate and work in a hybrid manner. How and with what tools can business and technical profiles collaborate productively together? lorian Douetteau, Dataiku's CEO, answers these questions.
BreizhJUG - Janvier 2014 - Big Data - Dataiku - Pages JaunesDataiku
Presentation made at Rennes in January for the handsome BreizhJUG. This is a mixed presentation for big data technologies, which covers topics such as : Why Hadoop ? What next ? Machine Learning for big data in practice.
Dataiku productive application to production - pap is may 2015 Dataiku
Beyond Predictive Analytics : Deploying apps to production and keep them improving
Some smart companies have been putting predictive application in production for decades. Still, either because of lack of sharing or lack of generality, there is still no single and obvious way to put a predictive application in production today.
As a consequence, for most companies, transitioning analytics from development to production is still “the next frontier”.
Behind the single word "production” lays a great number of questions like: what exactly do you put in production: data, model, code all three ? Who is responsible for maintenance and quality check over time : business, tech or both ? How can I make my predictive app continuously improve and check that it delivers the promised business value over time ? What are the best practice for maintenance and updates by the way ? Will my data scientists keep working after first development or should I lay half of them off ? etc…
Let’s make a small analogy with the development of web sites in the 90’s and early 00’s :
Back then, the winners where not necessarily the web sites with an amazing design, but a winner had clearly made the necessary efforts and had a robust way to put their web site reliabily in production
Today, every web developper can enjoy the confort of Heroku, Amazon, Github, docker, Angular, bootstrap … and so we forget. How much time before we get the same confort for the predictive world ?
How to Build a Successful Data Team - Florian Douetteau (@Dataiku) Dataiku
As you walk into your office on Monday morning, before you've even had a chance to grab a cup of coffee, your CEO asks to see you. He's worried: both customer churn and fraudulent transactions have increased over the past 6 months. As Data Manager, you have 6 months to solve this problem.
As Data Manager, you know the challenges ahead:
- Multitudes of technology choices to make
- Building a team and solving the skill-set disconnect
- Data can be deceiving...
- Figuring out what the successful data product must be
Florian works in the “data” field since 01’, back when it was not yet big. He worked in successful startups in search engine, advertising, and gaming industries, holding various data or CTO roles. He started Dataiku in 2013, his first venture as a CEO, with the goal of alleviating the daily pains encountered by data teams all around.
The 3 Key Barriers Keeping Companies from Deploying Data Products Dataiku
Getting from raw data to deploying data-driven solutions requires technology, data, and people. All of which exist. So why aren’t we seeing more truly data-driven companies: what's missing and why? During Strata Hadoop World Singapore 2015, Pauline Brown, Director of Marketing at Dataiku, explains how lack of collaboration is what is keeping companies from building and deploying data products effectively. Learn more about Dataiku and Data Science Studio: www.dataiku.com
Back to Square One: Building a Data Science Team from ScratchKlaas Bosteels
Generally speaking, big data and data science originated in the west and are coming to Europe with a bit of a delay. There is at least one exception though: The London-based music discovery website Last.fm is a data company at heart and has been doing large-scale data processing and analysis for years. It started using Hadoop in early 2006, for instance, making it one of the earliest adopters worldwide. When I left Last.fm to join Massive Media, the social media company behind Netlog.com and Twoo.com, I basically moved from a data science forerunner to a newcomer. Massive Media had at least as much data to play with and tremendous potential, but they were not doing much with it yet. The data science team had to be build from the ground up and every step had to be argued for and justified along the way. Having done this exercise of evaluating everything I learned at Last.fm and starting over completely with a clean slate at Massive Media, I developed a pretty clear perspective on how to find good data scientists, what they should be doing, what tools they should be using, and how to organize them to work together efficiently as team, which is precisely what I would like to share in this talk.
Dataiku, Pitch at Data-Driven NYC, New York City, September 17th 2013Dataiku
Our pitch at Data-Driven NYC meetup on September 17th (http://datadrivennyc.com).
Speaking about Data Scientists pains and how Dataiku Data Science Studio can help them to more than Data Cleaners and Data Leak Fixers !
This session describes the roles and skill sets required when building a Data Science team, and starting a data science initiative, including how to develop Data Science capabilities, select suitable organizational models for Data Science teams, and understand the role of executive engagement for enhancing analytical maturity at an organization.
Objective 1: Understand the knowledge and skills needed for a Data Science team and how to acquire them.
After this session you will be able to:
Objective 2: Learn about the different organizational models for forming a Data Science team and how to choose the best for your organization.
Objective 3: Understand the importance of Executive support for Data Science initiatives and role it plays in their successful deployment.
Applied Data Science Course Part 1: Concepts & your first ML modelDataiku
In this first course of our Applied Data Science online course series, you'll learn about the mindset shift of going from small to big data, basic definitions and concepts, and an overview of the data science workflow.
There is an overwhelming list of expectations – and challenges – in this new, emerging and evolving role. In this presentation, given at the 2016 CDO Summit, Joe Caserta focuses on:
- Defining the CDO title
- Outlining the skills that enhance chances for success
- Listing all the many things the company thinks you are responsible for
- Providing an overview of the core technologies you need to be familiar with and will serve to ultimately support your success
- Presenting a concise list of the most pressing challenges
- Sharing insights and arguments for how best to meet the challenges and succeed in your new role
How the world of data analytics, science and insights is failing and how the principles from Agile, DevOps, and Lean are the way forward. #DataOps Given at DevOps Enterprise Summit 2019
Architecting Data For The Modern Enterprise - Data Summit 2017, Closing KeynoteCaserta
The “Big Data era” has ushered in an avalanche of new technologies and approaches for delivering information and insights to business users. What is the role of the cloud in your analytical environment? How can you make your migration as seamless as possible? This closing keynote, delivered by Joe Caserta, a prominent consultant who has helped many global enterprises adopt Big Data, provided the audience with the inside scoop needed to supplement data warehousing environments with data intelligence—the amalgamation of Big Data and business intelligence.
This presentation was given as the closing keynote at DBTA's annual Data Summit in NYC.
Big Data Everywhere Chicago: Platfora - Practices for Customer Analytics on H...BigDataEverywhere
Hadoop use cases have historically trended towards cost reduction through data warehouse offload. More recently, an uptick around customer-centric use cases have proven the ability for Hadoop to drive top-line revenue. In this session, Platfora solution architect Rob Rosen will discuss how the ability to coreelate multi-structured data in Hadoop leads to greater customer adoption, expanded cross-selling and reduced customer churn for enterprises deploying Hadoop-centric data lakes.
A modern, flexible approach to Hadoop implementation incorporating innovation...DataWorks Summit
A modern, flexible approach to Hadoop implementation incorporating innovations from HP Haven
Jeff Veis
Vice President
HP Software Big Data
Gilles Noisette
Master Solution Architect
HP EMEA Big Data CoE
Data Wrangling and the Art of Big Data DiscoveryInside Analysis
The Briefing Room with Dr. Robin Bloor, Trifacta and Zoomdata
Live Webcast March 10, 2015
Watch the Archive: https://bloorgroup.webex.com/bloorgroup/lsr.php?RCID=dd9fed3c7c476ae3a0f881ae6b53dcc5
Square pegs and round holes don't get along, which is one reason why traditional data management approaches simply won't work for Big Data. The variety and velocity of data types flying at us today require a new strategy for identifying, streamlining and utilizing information assets and processes. Decades-old technology won’t cut it – a combination of new tools and techniques must be used to enable effective discovery of insights in a timely fashion.
Register for this episode of The Briefing Room to hear veteran Analyst Dr. Robin Bloor explain why today's data landscape calls for a much different data management approach. He'll be briefed by Trifacta and Zoomdata, who will show how their technologies use a range of functionality – including machine learning – to help companies "wrangle" their data. They'll also demonstrate the optimal step-by-step process of working with new data types.
Visit InsideAnalysis.com for more information.
PASS Summit Data Storytelling with R Power BI and AzureMLJen Stirrup
How can we use technology to help the organization make data-driven decision-making part of its organizational DNA, while retaining the context of the business as a whole? How can we imprint data in the culture of the organization and make it easily accessible to everyone? Microsoft directly empowers businesses to derive insights and value from little and big data, through its release of user-friendly analytics through Azure Machine Learning (ML) combined with its acquisition of Revolution Analytics. Power BI can be used to create compelling visual stories around the analysis so that the work is not left to the data consumer. Together, these technologies can be used to make data and analytics part of the organization's DNA.
There are no prerequisites, but attendees are welcome to follow along with the demo if they have an Azure ML and Power BI account and R installed. Files will be released before the session.
Knowledge Graphs for a Connected World - AI, Deep & Machine Learning MeetupBenjamin Nussbaum
We live in an era where the world is more connected than ever before and the trajectory is such that data relationships will only continue to increase with no signs of slowing down. Connected data is the key to your business succeeding and growing in today’s connected world. Leading enterprises will be the ones that utilize relationship-centric technologies to leverage connections from their internal operations and supply chain to their customer and user interactions. This ability to utilize connected data to understand all the nuanced relationships within their organization will propel them forward as they act on more holistic insights.
Every organization needs a knowledge graph because connected data is an essential foundation to advancing business. Additional reading on connected can be found here: https://www.graphgrid.com/why-connected-data-is-more-useful/
Conférence Laboratoire des Mondes Virtuels_Dataiku_Choix technologiques pour ...Johan-André Jeanville
Capital Games organise une conférence le mercredi 22 mai, de 9h à 17h au Centre de Conférences de Microsoft, à Issy-les-Moulineaux. Elle permettra aux professionnels du jeu vidéo de monter en compétences sur les nouvelles méthodes de production de jeux connectés, parmi lesquelles l'analyse de données.
Présentation du cabinet Altana sur la Réglementation des données.
Slides from a recent Big Data Warehousing Meetup titled, Big Data Analytics with Microsoft.
See Power Pivot/ Power Query/ Power View/ Power Maps and Azure Machine Learning be used to analyze Big Data.
One challenge of dealing with Big Data project is to acquire both structured and instructed information in order to find the right correlation. During the event, we explained all the steps to build your model and enhance your existing data through Microsoft's Power BI.
We had an in-depth discussion about the innovations built into the latest stack of Microsoft Business Intelligence, and practical tips from Technology Specialist’s from Microsoft.
The session also featured demos to help you see the technology as an end-to-end solution.
For more information, visit www.casertaconcepts.com
Building a Data Strategy – Practical Steps for Aligning with Business GoalsDATAVERSITY
Developing a Data Strategy for your organization can seem like a daunting task – but it’s worth the effort. Getting your Data Strategy right can provide significant value, as data drives many of the key initiatives in today’s marketplace – from digital transformation, to marketing, to customer centricity, to population health, and more. This webinar will help demystify Data Strategy and its relationship to Data Architecture and will provide concrete, practical ways to get started.
Get Smart: The Present and Future of Data DiscoveryInside Analysis
Hot Technologies of 2013 with Bloor, Fitzgerald & Neutrino BI
Live Webcast July 17, 2013
http://www.insideanalysis.com
Somewhere in your data, discoveries wait to be found. Finding them can be quite a challenge, though, which is why data discovery gets so much attention these days. A whole array of tools is being promoted for data visualization and business discovery. But what are the component parts of this technology? And how can discovery tools be used to sift through vast amounts of data effectively? Register for this episode of Hot Technologies to find out!
Analysts Dr. Robin Bloor of The Bloor Group, and Jaime Fitzgerald of Fitzgerald Analytics will each offer their take on what constitutes a high-quality discovery tool. They'll then take a briefing from Jon Woodward of Neutrino BI, who will tout his company's platform for facilitating data discovery. He'll talk about the value of being able to go "direct to data" during the discovery process. He'll also outline their roadmap for developing a next-generation "smart" discovery platform.
Even if you have terabytes of business data, it might not be easy to apply AI-based analytics to it. The bottleneck is often Machine Learning (ML) expertise and scalable infrastructure.
We'll first look at how you can access vast amounts of data from the data warehouse directly in a Google Sheet. Then, you'll see how it's possible to train custom ML models with that data, without ever leaving the spreadsheet.
Speaker:
Karl Weinmeister
Google
Cloud AI Advocacy Manager
Emerging Trends in Data Architecture – What’s the Next Big Thing?DATAVERSITY
With technological innovation and change occurring at an ever-increasing rate, it’s hard to keep track of what’s hype and what can provide practical value for your organization. Join this webinar to see the results of a recent DATAVERSITY survey on emerging trends in Data Architecture, along with practical commentary and advice from industry expert Donna Burbank.
Bio-IT Trends From The Trenches (digital edition)Chris Dagdigian
Note: Contact me directly dag@bioteam.net if you would like a PDF download of these slides
This is Chris Dagdigian’s 10th year delivering his no holds barred, candid state of the industry address at BioIT World, and we are not going to let a pandemic stop him.
Instead of his typical talk, five distinguished panelists will join Chris for a spirited discussion on Current Events and Scientific Computing and the impacts of the COVID-19 Pandemic:
a2c Boston Big Data Meet-up: Agile Data Warehouse Designa2c
Preview this Big Data Seminar, and request the complete audio and animated download featuring Agile Data Warehouse Design - a step-by-step method for data warehousing / business intelligence (DW/BI) professionals to better collect and translate business intelligence requirements into successful dimensional data warehouse designs. The method utilizes BEAM✲ (Business Event Analysis and Modeling) - an agile approach to dimensional data modeling that can be used throughout analysis and design to improve productivity and communication between DW designers and BI stakeholders. a2c's Practice Director of Information Services and Author Jim Stagnitto and CTO John DiPietro designed this presentation to provide an overview of Agile Warehouse Design that will facilitate communication between Data Modelers and Business Intelligence Stakeholders in a fun and informative one hour session. Demystify this process and find out what the 96 Data Scientists who attended November's Boston Big Data Meet-up are talking about.
“Excellent presentation. It is good to hear meaningful …information about new developments in how Agile methodologies can be applied to DW/BI work. Big Kudos to the presenters and organizers. Thanks, I found it very useful and enjoyable.”- Ramon Venegas
“Extremely useful to understand how to apply Agile approach to DWH; how create a framework where model changes are welcome, and bring users to the process of DWH modeling.” – Alfredo Gomez
SPSNYC2019 - What is Common Data Model and how to use it?Nicolas Georgeault
Are you using PowerApps? Not yet or maybe just the Canvas option? All you need to know about the CDS Database, the way to deploy it and the way to use it to modernize your business applications using both Canvas and Model-Driven Apps.
Architecting for Big Data: Trends, Tips, and Deployment OptionsCaserta
Joe Caserta, President at Caserta Concepts addressed the challenges of Business Intelligence in the Big Data world at the Third Annual Great Lakes BI Summit in Detroit, MI on Thursday, March 26. His talk "Architecting for Big Data: Trends, Tips and Deployment Options," focused on how to supplement your data warehousing and business intelligence environments with big data technologies.
For more information on this presentation or the services offered by Caserta Concepts, visit our website: http://casertaconcepts.com/.
Power Digital - GA4 & BigQuery - CBUS WAW - Scott Zakrajsek.pdfTim Wilson
Scott Zakrajsek's presentation at Columbus Web Analytics Wednesday in November 2023—a brief overview of Google Analytics 4, how and why it integrates with Google BigQuery, and some of the basics of getting that data back out of BigQuery using SQL.
Building a New Platform for Customer Analytics Caserta
Caserta Concepts and Databricks partner up to bring you this insightful webinar on how a business can choose from all of the emerging big data technologies to figure out which one best fits their needs.
Scalable Predictive Analysis and The Trend with Big Data & AIJongwook Woo
The history and the latest trend of Big Data and Scalable Predictive Analysis for large scale data set using Distributed Machine Learning and Deep Learning with GPUs in Spark and Rapids; Invited talk at IS department of Yonsei University, Korea
Applied Data Science Part 3: Getting dirty; data preparation and feature crea...Dataiku
In our 3rd applied machine learning online course, we'll dive into different methods for data preparation, including handling missing values, dummification and rescaling.
Applied Data Science Course Part 2: the data science workflow and basic model...Dataiku
In the second part of our applied machine learning online course, you'll get an overview of the different steps in the data science workflow as well as a deep dive in 3 basic types of models: linear, tree-based and clustering.
The Rise of the DataOps - Dataiku - J On the Beach 2016 Dataiku
Many organisations are creating groups dedicated to data. These groups have many names : Data Team, Data Labs, Analytics Teams….
But whatever the name, the success of those teams depends a lot on the quality of the data infrastructure and their ability to actually deploy data science applications in production.
In that regards a new role of “DataOps” is emerging. Similar, to Dev Ops for (Web) Dev, the Data Ops is a merge between a data engineer and a platform administrator. Well versed in cluster administration and optimisation, a data ops would have also a perspective on the quality of data quality and the relevance of predictive models.
Do you want to be a Data Ops ? We’ll discuss its role and challenges during this talk
Before Kaggle : from a business goal to a Machine Learning problem Dataiku
Many think that a Data Science is like a Kaggle competition. There are, however big differences in the approach. This presentation is about designing carefully your evaluation scheme to avoid overfitting and unexpected production performances.
This is a presentation by Pierre Gutierrez (Dataiku’s data scientist).
Retrouvez l'intégralité de la présentation commune de Dataiku et Coyote sur la "Valorisation des données".
Cette présentation a été réalisée dans le cadre du Symposium du 04 Juin 2015, organisé par le Club Urba-EA et le Club Pilotes de Processus.
Plus d'informations sur www.dataiku.com
Dataiku at SF DataMining Meetup - Kaggle Yandex ChallengeDataiku
This is a presentation made on the 13th August 2014 at the SF Data Mining Meetup at Trulia. It's about Dataiku and the Kaggle Personalized Web Search Ranking challenge sponsored by Yandex
Dataiku big data paris - the rise of the hadoop ecosystemDataiku
Snapshot of the hadoop ecosystem at the beginning of 2014, with the rise of real time and in memory processing distributed frameworks that complement and supplant the Map Reduce paradigm
Connector Corner: Automate dynamic content and events by pushing a buttonDianaGray10
Here is something new! In our next Connector Corner webinar, we will demonstrate how you can use a single workflow to:
Create a campaign using Mailchimp with merge tags/fields
Send an interactive Slack channel message (using buttons)
Have the message received by managers and peers along with a test email for review
But there’s more:
In a second workflow supporting the same use case, you’ll see:
Your campaign sent to target colleagues for approval
If the “Approve” button is clicked, a Jira/Zendesk ticket is created for the marketing design team
But—if the “Reject” button is pushed, colleagues will be alerted via Slack message
Join us to learn more about this new, human-in-the-loop capability, brought to you by Integration Service connectors.
And...
Speakers:
Akshay Agnihotri, Product Manager
Charlie Greenberg, Host
JMeter webinar - integration with InfluxDB and GrafanaRTTS
Watch this recorded webinar about real-time monitoring of application performance. See how to integrate Apache JMeter, the open-source leader in performance testing, with InfluxDB, the open-source time-series database, and Grafana, the open-source analytics and visualization application.
In this webinar, we will review the benefits of leveraging InfluxDB and Grafana when executing load tests and demonstrate how these tools are used to visualize performance metrics.
Length: 30 minutes
Session Overview
-------------------------------------------
During this webinar, we will cover the following topics while demonstrating the integrations of JMeter, InfluxDB and Grafana:
- What out-of-the-box solutions are available for real-time monitoring JMeter tests?
- What are the benefits of integrating InfluxDB and Grafana into the load testing stack?
- Which features are provided by Grafana?
- Demonstration of InfluxDB and Grafana using a practice web application
To view the webinar recording, go to:
https://www.rttsweb.com/jmeter-integration-webinar
Dev Dives: Train smarter, not harder – active learning and UiPath LLMs for do...UiPathCommunity
💥 Speed, accuracy, and scaling – discover the superpowers of GenAI in action with UiPath Document Understanding and Communications Mining™:
See how to accelerate model training and optimize model performance with active learning
Learn about the latest enhancements to out-of-the-box document processing – with little to no training required
Get an exclusive demo of the new family of UiPath LLMs – GenAI models specialized for processing different types of documents and messages
This is a hands-on session specifically designed for automation developers and AI enthusiasts seeking to enhance their knowledge in leveraging the latest intelligent document processing capabilities offered by UiPath.
Speakers:
👨🏫 Andras Palfi, Senior Product Manager, UiPath
👩🏫 Lenka Dulovicova, Product Program Manager, UiPath
Epistemic Interaction - tuning interfaces to provide information for AI supportAlan Dix
Paper presented at SYNERGY workshop at AVI 2024, Genoa, Italy. 3rd June 2024
https://alandix.com/academic/papers/synergy2024-epistemic/
As machine learning integrates deeper into human-computer interactions, the concept of epistemic interaction emerges, aiming to refine these interactions to enhance system adaptability. This approach encourages minor, intentional adjustments in user behaviour to enrich the data available for system learning. This paper introduces epistemic interaction within the context of human-system communication, illustrating how deliberate interaction design can improve system understanding and adaptation. Through concrete examples, we demonstrate the potential of epistemic interaction to significantly advance human-computer interaction by leveraging intuitive human communication strategies to inform system design and functionality, offering a novel pathway for enriching user-system engagements.
Transcript: Selling digital books in 2024: Insights from industry leaders - T...BookNet Canada
The publishing industry has been selling digital audiobooks and ebooks for over a decade and has found its groove. What’s changed? What has stayed the same? Where do we go from here? Join a group of leading sales peers from across the industry for a conversation about the lessons learned since the popularization of digital books, best practices, digital book supply chain management, and more.
Link to video recording: https://bnctechforum.ca/sessions/selling-digital-books-in-2024-insights-from-industry-leaders/
Presented by BookNet Canada on May 28, 2024, with support from the Department of Canadian Heritage.
Smart TV Buyer Insights Survey 2024 by 91mobiles.pdf91mobiles
91mobiles recently conducted a Smart TV Buyer Insights Survey in which we asked over 3,000 respondents about the TV they own, aspects they look at on a new TV, and their TV buying preferences.
UiPath Test Automation using UiPath Test Suite series, part 4DianaGray10
Welcome to UiPath Test Automation using UiPath Test Suite series part 4. In this session, we will cover Test Manager overview along with SAP heatmap.
The UiPath Test Manager overview with SAP heatmap webinar offers a concise yet comprehensive exploration of the role of a Test Manager within SAP environments, coupled with the utilization of heatmaps for effective testing strategies.
Participants will gain insights into the responsibilities, challenges, and best practices associated with test management in SAP projects. Additionally, the webinar delves into the significance of heatmaps as a visual aid for identifying testing priorities, areas of risk, and resource allocation within SAP landscapes. Through this session, attendees can expect to enhance their understanding of test management principles while learning practical approaches to optimize testing processes in SAP environments using heatmap visualization techniques
What will you get from this session?
1. Insights into SAP testing best practices
2. Heatmap utilization for testing
3. Optimization of testing processes
4. Demo
Topics covered:
Execution from the test manager
Orchestrator execution result
Defect reporting
SAP heatmap example with demo
Speaker:
Deepak Rai, Automation Practice Lead, Boundaryless Group and UiPath MVP
GraphRAG is All You need? LLM & Knowledge GraphGuy Korland
Guy Korland, CEO and Co-founder of FalkorDB, will review two articles on the integration of language models with knowledge graphs.
1. Unifying Large Language Models and Knowledge Graphs: A Roadmap.
https://arxiv.org/abs/2306.08302
2. Microsoft Research's GraphRAG paper and a review paper on various uses of knowledge graphs:
https://www.microsoft.com/en-us/research/blog/graphrag-unlocking-llm-discovery-on-narrative-private-data/
Slack (or Teams) Automation for Bonterra Impact Management (fka Social Soluti...Jeffrey Haguewood
Sidekick Solutions uses Bonterra Impact Management (fka Social Solutions Apricot) and automation solutions to integrate data for business workflows.
We believe integration and automation are essential to user experience and the promise of efficient work through technology. Automation is the critical ingredient to realizing that full vision. We develop integration products and services for Bonterra Case Management software to support the deployment of automations for a variety of use cases.
This video focuses on the notifications, alerts, and approval requests using Slack for Bonterra Impact Management. The solutions covered in this webinar can also be deployed for Microsoft Teams.
Interested in deploying notification automations for Bonterra Impact Management? Contact us at sales@sidekicksolutionsllc.com to discuss next steps.
Kubernetes & AI - Beauty and the Beast !?! @KCD Istanbul 2024Tobias Schneck
As AI technology is pushing into IT I was wondering myself, as an “infrastructure container kubernetes guy”, how get this fancy AI technology get managed from an infrastructure operational view? Is it possible to apply our lovely cloud native principals as well? What benefit’s both technologies could bring to each other?
Let me take this questions and provide you a short journey through existing deployment models and use cases for AI software. On practical examples, we discuss what cloud/on-premise strategy we may need for applying it to our own infrastructure to get it to work from an enterprise perspective. I want to give an overview about infrastructure requirements and technologies, what could be beneficial or limiting your AI use cases in an enterprise environment. An interactive Demo will give you some insides, what approaches I got already working for real.
Key Trends Shaping the Future of Infrastructure.pdfCheryl Hung
Keynote at DIGIT West Expo, Glasgow on 29 May 2024.
Cheryl Hung, ochery.com
Sr Director, Infrastructure Ecosystem, Arm.
The key trends across hardware, cloud and open-source; exploring how these areas are likely to mature and develop over the short and long-term, and then considering how organisations can position themselves to adapt and thrive.
Accelerate your Kubernetes clusters with Varnish CachingThijs Feryn
A presentation about the usage and availability of Varnish on Kubernetes. This talk explores the capabilities of Varnish caching and shows how to use the Varnish Helm chart to deploy it to Kubernetes.
This presentation was delivered at K8SUG Singapore. See https://feryn.eu/presentations/accelerate-your-kubernetes-clusters-with-varnish-caching-k8sug-singapore-28-2024 for more details.
Software Delivery At the Speed of AI: Inflectra Invests In AI-Powered QualityInflectra
In this insightful webinar, Inflectra explores how artificial intelligence (AI) is transforming software development and testing. Discover how AI-powered tools are revolutionizing every stage of the software development lifecycle (SDLC), from design and prototyping to testing, deployment, and monitoring.
Learn about:
• The Future of Testing: How AI is shifting testing towards verification, analysis, and higher-level skills, while reducing repetitive tasks.
• Test Automation: How AI-powered test case generation, optimization, and self-healing tests are making testing more efficient and effective.
• Visual Testing: Explore the emerging capabilities of AI in visual testing and how it's set to revolutionize UI verification.
• Inflectra's AI Solutions: See demonstrations of Inflectra's cutting-edge AI tools like the ChatGPT plugin and Azure Open AI platform, designed to streamline your testing process.
Whether you're a developer, tester, or QA professional, this webinar will give you valuable insights into how AI is shaping the future of software delivery.
Builder.ai Founder Sachin Dev Duggal's Strategic Approach to Create an Innova...Ramesh Iyer
In today's fast-changing business world, Companies that adapt and embrace new ideas often need help to keep up with the competition. However, fostering a culture of innovation takes much work. It takes vision, leadership and willingness to take risks in the right proportion. Sachin Dev Duggal, co-founder of Builder.ai, has perfected the art of this balance, creating a company culture where creativity and growth are nurtured at each stage.
2. 5/22/2013Dataiku 2
Collocation
Big Apple
Big Mama
Big Data
Games Analytics
Current Life:
CEO, Dataiku
Tweet about this
@dataiku
@capital_games
Past Life:
Criteo
IsCool Entertainment
Exalead
Hello, My Name is
Florian Douetteau
Available on:
http://www.slideshare.net/Dataiku
3. The Stakes - Summary
5/22/2013Dataiku 3
Million Events
Billion $
Billion Events
Million $
Classic Business
Social Gaming
4. Meet Hal Alowne
5/22/2013Dataiku 4
Big Guys
• 100M$+ Revenue
• 10M+ games
• 10+ Data Scientist
Hal Alowne
BI Manager
Dim’s Private Showroom
Hey Hal ! We need
a big data platform
like the big guys.
Let’s just do as they do!
‟
”European Online Game Leader
• 10M$ Revenue
• 1 Million monthly games
• 1 Data Analyst (Hal Himself)
Wave Pox
CEO & Founder
W’ave G’ ames
Big Data
Copy Cat
Project
5. MERIT = TIME + ROI
5/22/2013Dataiku 5
Targeted
Newsletter
For New Comers
Facebook
Campaign
Optimization
Adapted Product
/ Promotions
TIME : 6 MONTHS ROI : APPS
Build a lab in 6 months
(rather than 18 months)
Find the right
people
(6 months?)
Choose the
technology
(6 months?)
Make it work
(6 months?)
Build the lab
(6 months)
Deploy apps
that actually deliver value
2013 2014
2013
• Train People
• Reuse working patterns
7. Our Goal
5/22/2013Dataiku 7
It’s utterly complex and
unreasonable
Our Goal:
Change his perspective
on data science projects
(sorry, we couldn’t
find a picture of Hal
Smiling)
8. Do the Basics
Understand Analytics
What to expect out of analytics
Quick Agenda
5/22/2013Dataiku 8
10. Do you track ?
◦ Customer Goals For
most important
features
◦ Time Spent
Level Progresison
Money Spent
◦ Campaigns and
generated campaign
Value
5/22/2013Dataiku 10
Suggestion #1
Check The Basics
11. Do A/B Tests
◦ Use Proven Solutions
◦ Start small (button size
and color)
◦ Check Impacts
◦ Treat new and existing
users differently
◦ Don’t give up after the
first A/B Test
5/22/2013Dataiku 11
Suggestion #2
DO A/B Tests (and not yourself)
12. Register Now / Give
Email Graphics:
From 25% to 2X More
Clicks
http://bit.ly/VOruXt
Changing button
from green to red:
Up to 21%
http://bit.ly/qFEBdK
5/22/2013Dataiku 12
Some Results
A/B Tests
14. Can be Built on top
of your production
systems
Do you have
◦ Cohorts
◦ Daily $$ Reports
◦ Basic $$ Segments
5/22/2013Dataiku 14
Suggestion #3
Have the Basic BI
15. Defined Customer Segments
◦ New Installs
◦ Engaged Users
◦ Engaged Paying Users
◦ …?
Defined Customer Sources
◦ Social Ads / Social Posts / .. Top Charts
/ …
◦ Country Segments
Do you have for each segment, evey
day
◦ Rolling last 30 days ARPUU ?
◦ Rolling last 30 days DAY ?
Do you follow every week
◦ The Segment Conversion Rate per
source ?
5/22/2013Dataiku 15
Sample Check list
(Gaming)
17. Product Success
driven by Quality
Margin / Customer
Value / Traffic /
Acquisition
5/22/2013Dataiku 17
At the Beginning
18. Margin for new
customers might
decline …
Margin for new
features might
decline …
Is your business
really scalable ?
5/22/2013Dataiku 18
But when you continue growing
19. Existing Customers
Existing Product Assets
Existing Specific
Business Model
And your KNOWLEDGE
of it
5/22/2013Dataiku 19
Where is your core business
advantage ?
20. 5/22/2013Dataiku 20
Data Driven Business
What your value ?
Number of
Customers
Customer Knowledge
Increase over time with:
- Time spend in your app
- User relationship (network effet)
- Partner / Other Apps Interactions
Your Value
21. 5/22/2013Dataiku 21
To Apply It ?
Product Optimization
Customer Acquisition
Optimization
Recommender/
Targeting for
newsletters
22. Dark Side
◦ Technology
Bright Side
◦ Business
5/22/2013Dataiku 22
Apply It !!
24. Technology is complex
5/22/2013Dataiku 24
Hadoop
Ceph
Sphere
Cassandra
Spark
Scikit-Learn
Mahout
WEKA
MLBase
RapidMiner
Panda
D3
Crossfilter
InfiniDB
LucidDB
Impala
Elastic Search
SOLR
MongoDB
Riak
Membase
Pig
Hive
Cascading
Talend
Machine Learning
Mystery Land
Scalability CentralNoSQL-Slavia
SQL Colunnar Republic
Vizualization County
Data Clean Wasteland
Statistician Old
House
R
25. Machine learning is complex
5/22/2013Dataiku 25
Find People that understand machine learning
and all this stuff
Try to understand
myself
26. Plumbing is not complex
(but difficult)
5/22/2013Dataiku 26
Implicit User Data
(Views, Searches…)
Content Data
(Title, Categories, Price, …)
Explicit User Data
(Click, Buy, …)
User Information
(Location, Graph…)
500TB
50TB
1TB
200GB
Transformation
Matrix
Transformation
Predictor
Per User Stats
Per Content Stats
User Similarity
Rank Predictor
Content Similarity
28. People Microsoft Excel
5/22/2013Dataiku 28
How did you build your great
product ?
29. Data Team Data Tools
5/22/2013Dataiku 29
How will you continue growing your
great product(s) ?
The Business Guy
who knows maths
The Crazy Analyst
that reveals patterns
The Coding Guy That
is enthusiastic
30. data lab, (n. m): a small group
with all the expertise, including
business minded people,
machine learning knowledge and
the right technology
A proven organization used by
successful data-driven
companies over the past few
years (eBay, LinkedIn, Walmart…)
TEAM + TOOLS= LAB
5/22/2013Dataiku 30
31. Short Term Focus Long Term Drive
Business People Optimize Margin, …. Create new business
revenue streams
Marketing People Optimize click ratio Brand awareness and
impact
IT People Make IT work Clean and efficient
Architecture
Data People Get Stats Right, make
predictions
Create Data Driven
Features
It’s just a new team
5/22/2013Dataiku 31
33. You can’t
« design »
insights, you
explore and
discover them…
Iterate quickly
with constant
feedback
Try a lot, don’t
be afraid to fail!
Free
but not as “free beer”
5/22/2013Dataiku 33
Function
Form
Experience
Emotion
Surprise
Culture
Explore
and Refine
Experiment
Generate
Ideas
Select &
Develop
Enhance
or
Discard
Gather
Feedback
36. Classic Columnar Architecture
5/22/2013Dataiku 36
Lots of data Some Place To
Pour It In
Some Tool To
To Some Maths And Graphs
Web Tracking Logs
Raw Server Logs
Order / Product / Customer
Facebook Info
Open Data (Weather, Currency …)
37. The Corinthian Architecture
5/22/2013Dataiku 37
Lots of data
Some Place
To Perform
Rapid Calculations
Some Tools To
Do Some Maths
And Charts
Some Place To
Pour It In And
Clean / Prepare It
38. The Corinthian Architecture
5/22/2013Dataiku 38
Lots of data
Some Place
To Perform
Rapid Calculations
Some Tools To
Do Some Maths
And Charts
Some Place To
Pour It In And
Clean / Prepare It
Statistics
Cohorts
Regressions
Bar Charts For Marketing
Nice Infography for you Company Board
39. The Corinthian Architecture
5/22/2013Dataiku 39
Lots of data
Some Database
To Perform
Rapid Calculations
Some Tools To
Do Some Maths
Some Other
To Do Some
Charts
Some Place To
Pour It In And
Clean / Prepare It
40. The One Database won’t
make it all problem
5/22/2013Dataiku 40
Lots of data
Some Database
To Perform
Rapid Calculations
Some Tools To
Do Some Maths
Some Other
To Do Some
Charts
Some Place To
Pour It In And
Clean / Prepare It
JOIN / Aggregate
Rapid Goup By Computations
Direct Access to the computed Results
to production etc..
41. The Roman Social Forum
5/22/2013Dataiku 41
Lots of data
Some Database
To Perform
Rapid Calculations
And some database
for graphs
Some Tools To
Do Some Maths
Some Other
To Do Some
Charts
Some Place To
Pour It In And
Clean / Prepare It
42. The Key Value Store
5/22/2013Dataiku 42
Lots of data
Some Database
To Perform
Rapid Calculations
And some database
for graphs And
Some Distributed Key
Value Store
Some Tools To
Do Some Maths
Some Other
To Do Some
Charts
Some Place To
Pour It In And
Clean / Prepare It
43. Action requires Prediction
5/22/2013Dataiku 43
Lots of data
Some Database
To Perform
Rapid Calculations
And some database
for graphs And
Some Distributed Key
Value Store
Some Tools To
Do Some Maths
Some Other
To Do Some
Charts
Some Place To
Pour It In And
Clean / Prepare It
Draw A Line For the future
What are my real users groups ?
Should I launch a discount offering or not ?
To everybody or to specific users only ?
44. The Medieval Fairy Land
5/22/2013Dataiku 44
Lots of data
Some Tools To
Do Some Maths
Some Other
To Do Some
Charts and some
MACHINE LEARNING
Some Place To
Pour It In And
Clean / Prepare It
Some Database
To Perform
Rapid Calculations
And some database
for graphs And
Some Distributed Key
Value Store
46. Launch A Marketing
campaign
After a few days
PREDICT based on
behaviours
◦ Total ARPU for users
after 3 months
◦ Efficiency of a campaign
◦ Continue or not ?
Example
Marketing Campaign Prediction
Dataiku 46
47. A very large community
Some mid-size
communities
Lots of small clusters
mostly 2 players)
Correlation
◦ between community size
and engagement / virality
Meaningul patterns
◦ 2 players patterns
◦ Family play
◦ Group Play
◦ Open Play (language
community)
Example
Social Gaming Communities
5/22/2013Dataiku 47
48. Two-Way Clustering
◦ Assess customer behaviours
◦ Assess items equivalent classes
Modeling + Simulation
◦ Evaluate free items / item bought
ration per item kind
◦ Simulate future rules
◦ Sensibility to price evaluation
Enhance customer buy
recurrence
Example
Fremium Model Optimization
5/22/2013Dataiku 48
Business
Model
User
Profiling
Simulation