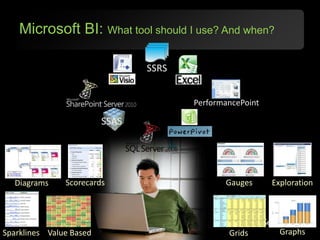
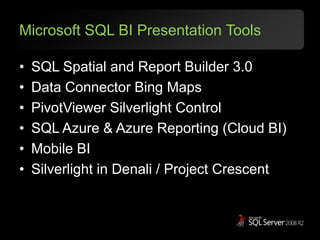
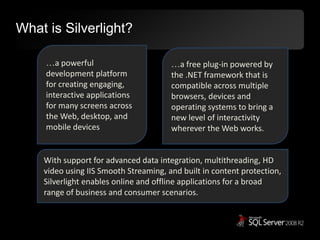
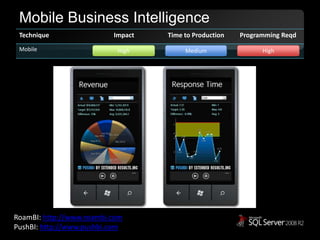
Bring Microsoft BI Dashboards to Life with Cool VisualizationsMark KromerMicrosoft Technology Specialistmkromer@microsoft.comhttp://www.sqlmag.com/blogs/sql-server-bi.aspxhttp://mssqldude.wordpress.comhttp://twitter.com/mssqldude
Microsoft BI: What tool should I use? And when?SSRSPerformancePointSSASGaugesScorecardsExplorationDiagramsGraphsValue BasedSparklinesGrids
BI Visualization Business DriversWhy spend the time on “cool” BI dashboards?They’re cool!Eye CandyCompelling to the end-userKeeps business users engagedEncourages data explorationImprove BI Application & Database ROIAccess important data quickly in small area (Tufte / Sparkline)Make it easier to make better decisions
Microsoft SQL BI Presentation ToolsSQL Spatial and Report Builder 3.0Data Connector Bing MapsPivotViewer Silverlight ControlSQL Azure & Azure Reporting (Cloud BI)Mobile BISilverlight in Denali / Project Crescent
Comparing the TechniquesLowLowLowMediumLowLowMediumMediumMediumHighHighMediumHighHighHighHighMediumHigh
Microsoft BI Dashboard Designer:SharePoint and PerformancePointMediumLowLow
Report BuilderLowLowLow
Open Source ControlsMediumMediumMediumCodePlexDataConnector: http://dataconnector.codeplex.com
What is Silverlight?…a powerful development platform for creating engaging, interactive applications for many screens across the Web, desktop, and mobile devices…a free plug-in powered by the .NET framework that is compatible across multiple browsers, devices and operating systems to bring a new level of interactivity wherever the Web works. With support for advanced data integration, multithreading, HD video using IIS Smooth Streaming, and built in content protection, Silverlight enables online and offline applications for a broad range of business and consumer scenarios.
Microsoft .NET Application PlatformDeliver applications across the UX ContinuumConsistent Tools & Application ModelDesignDevelopDeployBrowserClientUser Experience Continuum
Works with what you have
Packaged Silverlight ControlsHighHighMediumPivotViewer blog: http://petcu40.blogspot.comPivotViewerCTP1 Download: http://www.microsoft.com/downloads/en/details.aspx?displaylang=en&FamilyID=d31f609d-a353-41ad-a1a4-f81456e3a6c4
Custom Controls:Data Binding TechniquesMDX from SSASADOMDXMLAADO, ODBC, OLEDB, etc. from SQL ServerSilverlight Data BindingODataXML from SQL Server
Custom Silverlight ControlsHighHighHigh
Mobile Business IntelligenceHighMediumHighRoamBI: http://www.roambi.comPushBI: http://www.pushbi.com
To the Cloud … Cloud BIEmpower decision-makers on any deviceReal-time BIDirect knowledge pointsNot drill-downNot dashboardSilverlightAzureSQL ServerPowerPivot
SQL Server Denali: Project Crescent
Thank youMark KromerMicrosoft Technology SpecialistSQL Server Data Platformmkromer@microsoft.com

Microsoft BI Cool Data Visualizations

Editor's Notes

  • #3 Slide Script:In just a few clicks they can build some very nice-looking, interactive, professional reports using the powerful wizards in Report Builder 3.0 and the existing report elements from the Report Part Gallery.  What’s great about this is that users can take different elements that they like from multiple reports - regardless of the version of Reporting Services used to create those reports – and use them as building blocks for creating some very nice-looking, interactive, professional reports in just a few clicks…giving a whole new meaning to self-service reporting. This approach delivers greater efficiency to IT Professionals because it takes them out of the business of constantly modifying existing reports or creating similar reports for end users. Instead they can create some nicely designed report parts that can be used more broadly across the organization. This is a great segue to our final focus area for enabling Managed Self Service BI.