Download as PDF, PPTX
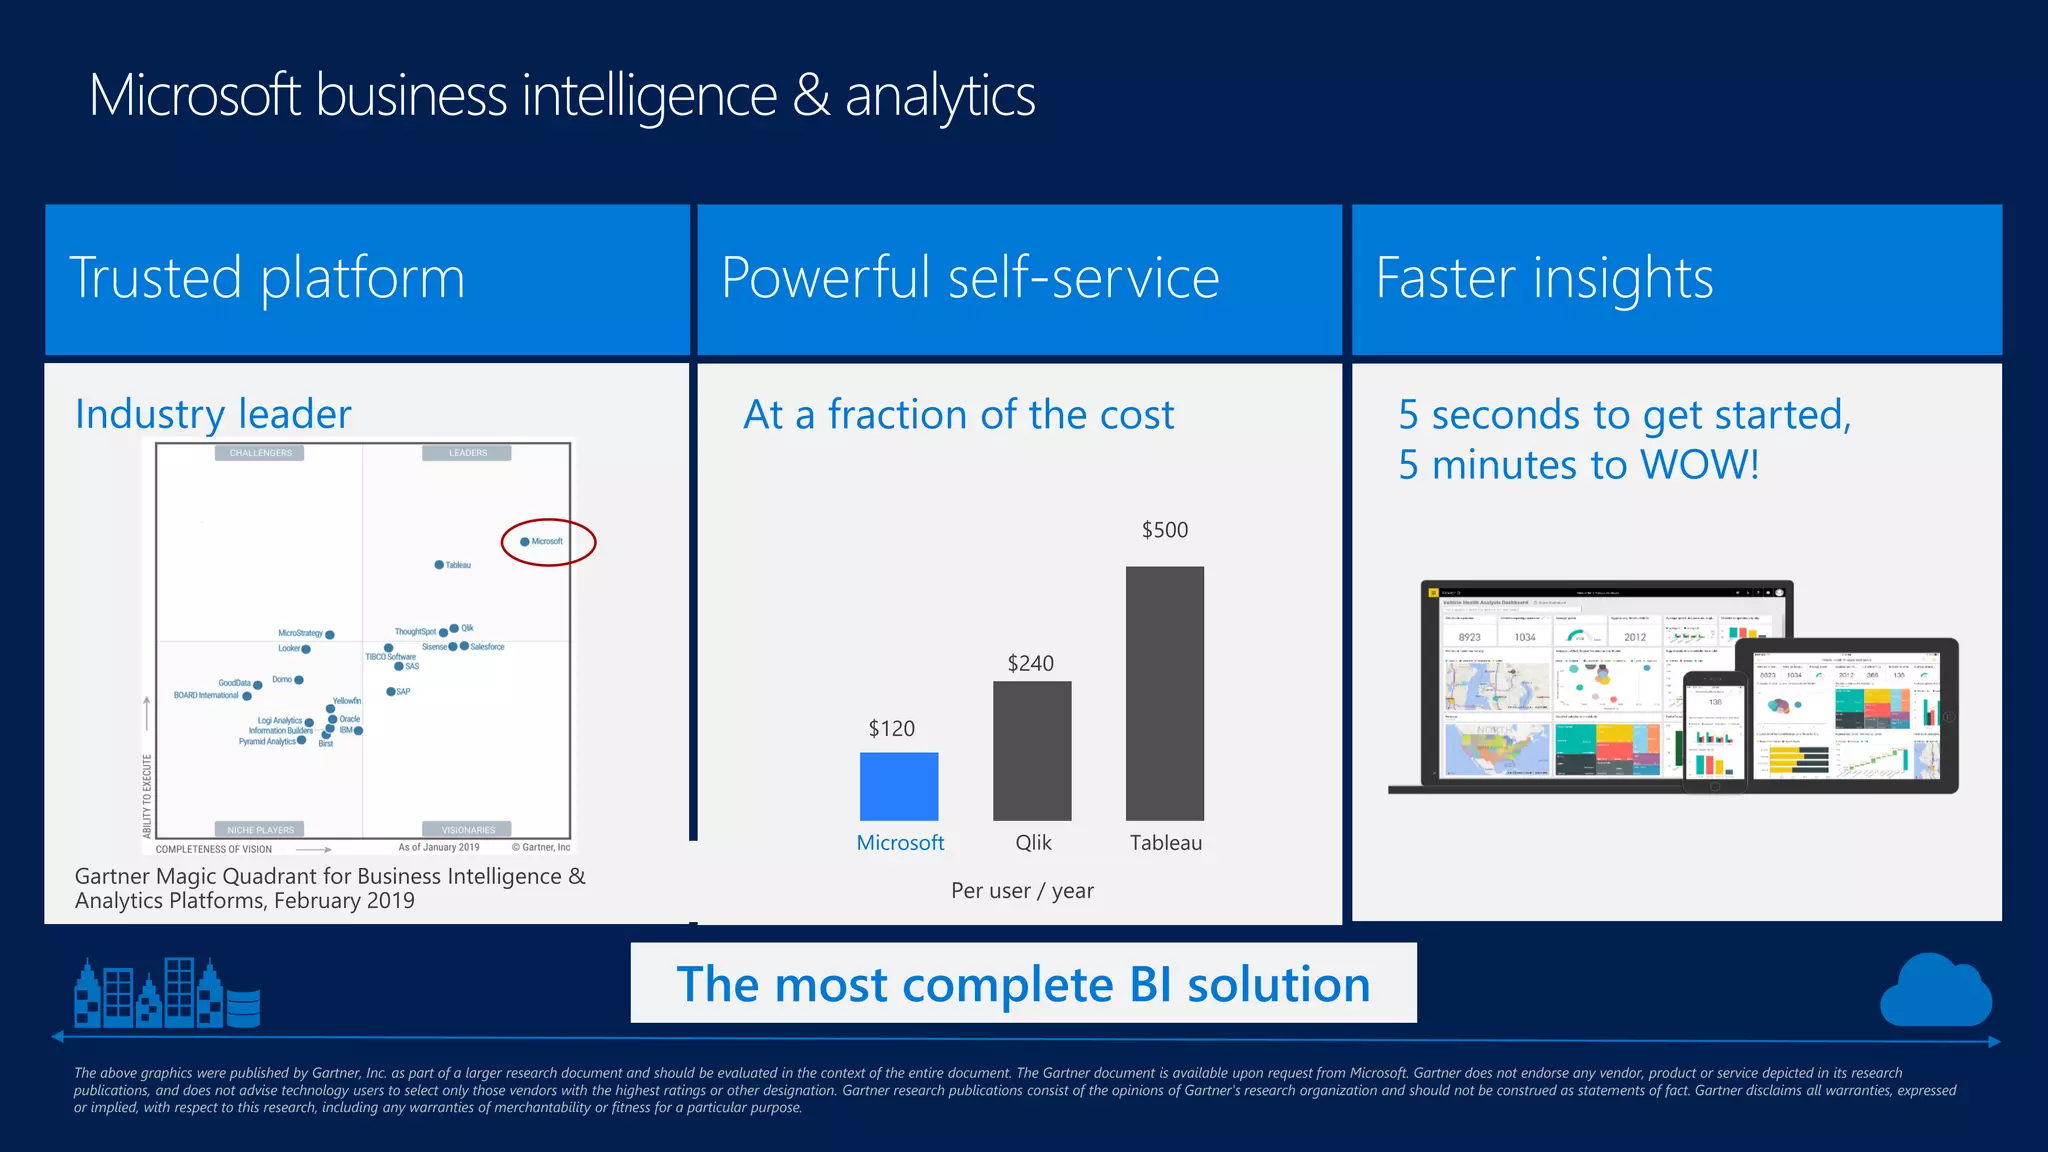
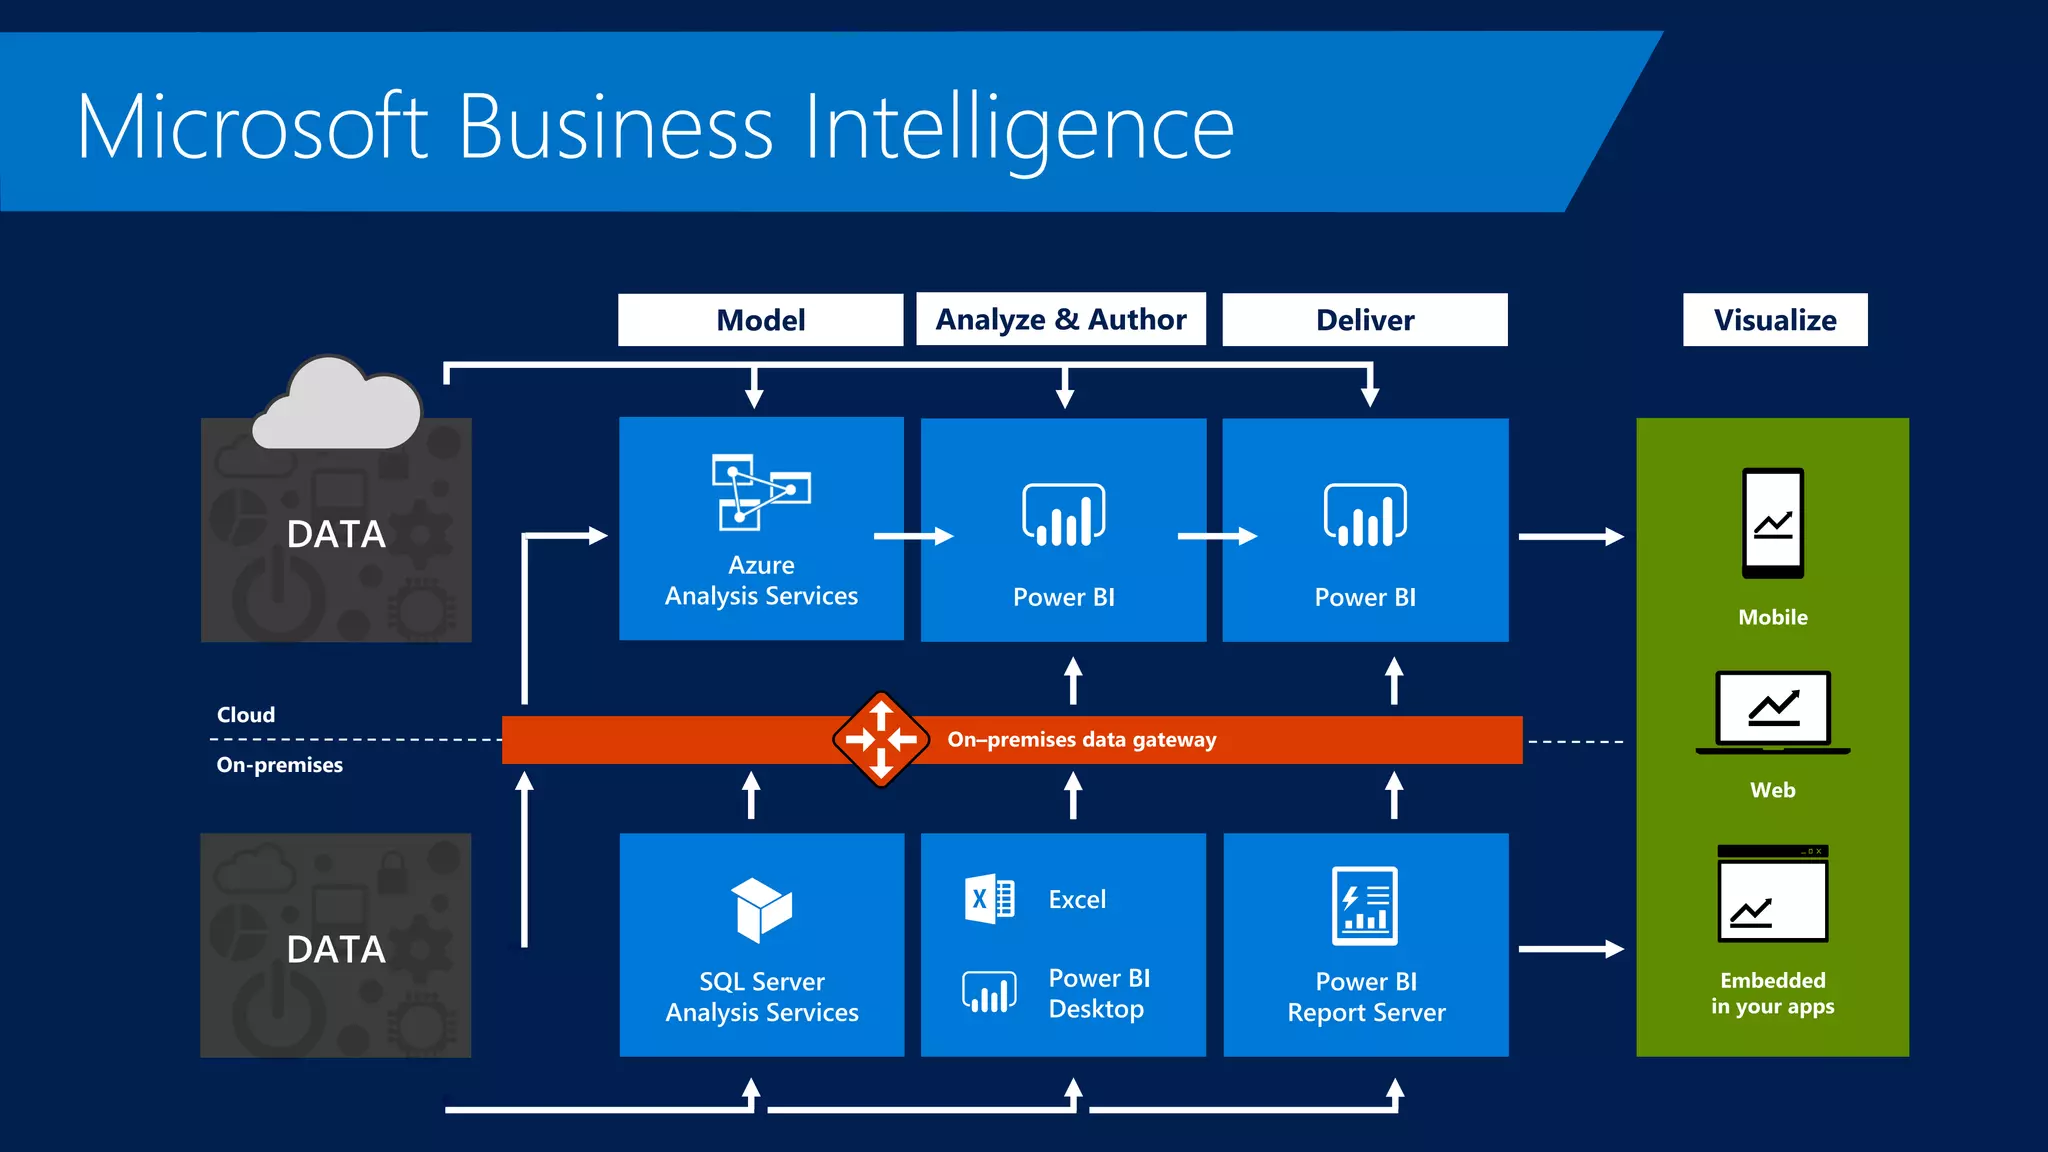
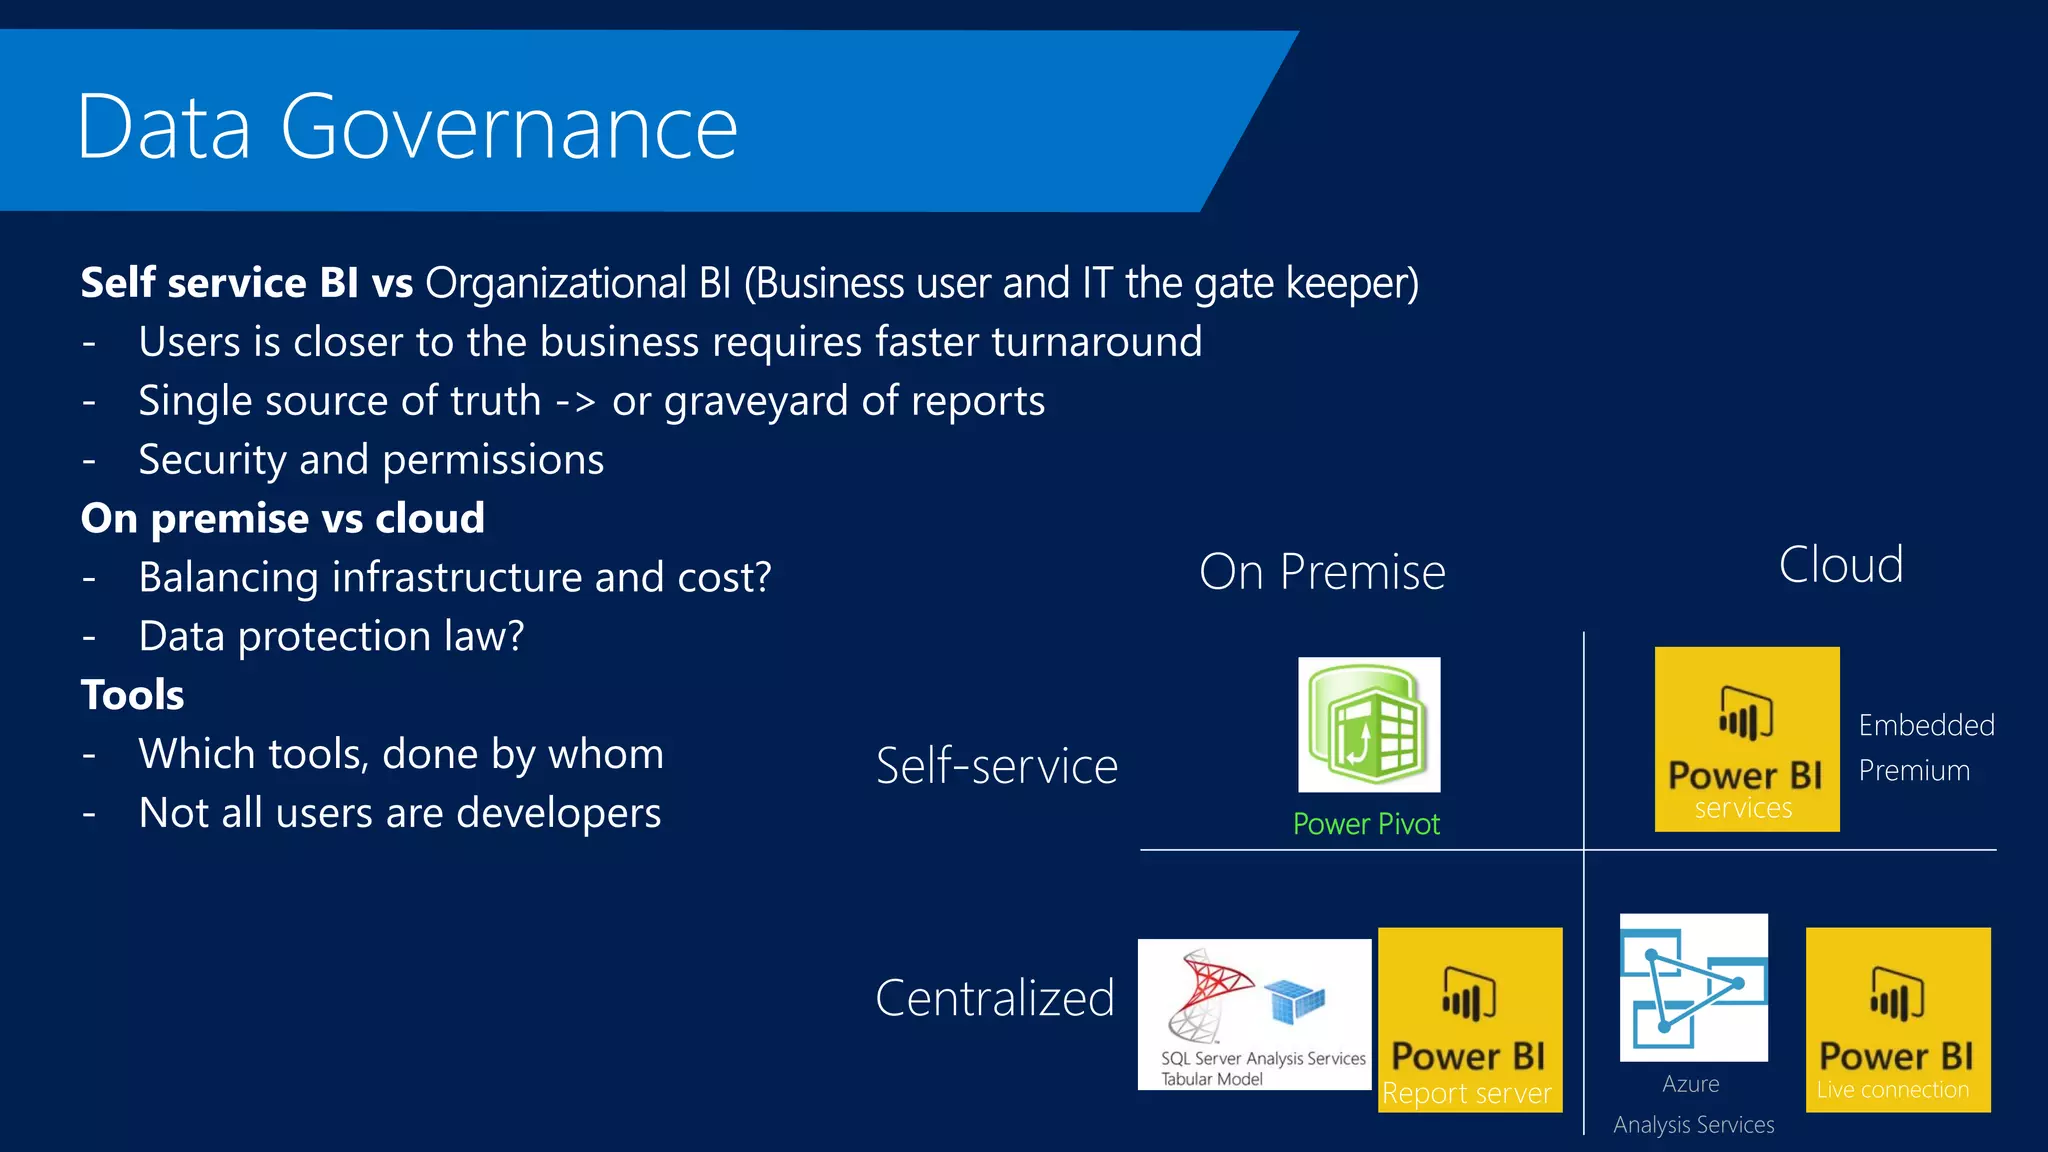
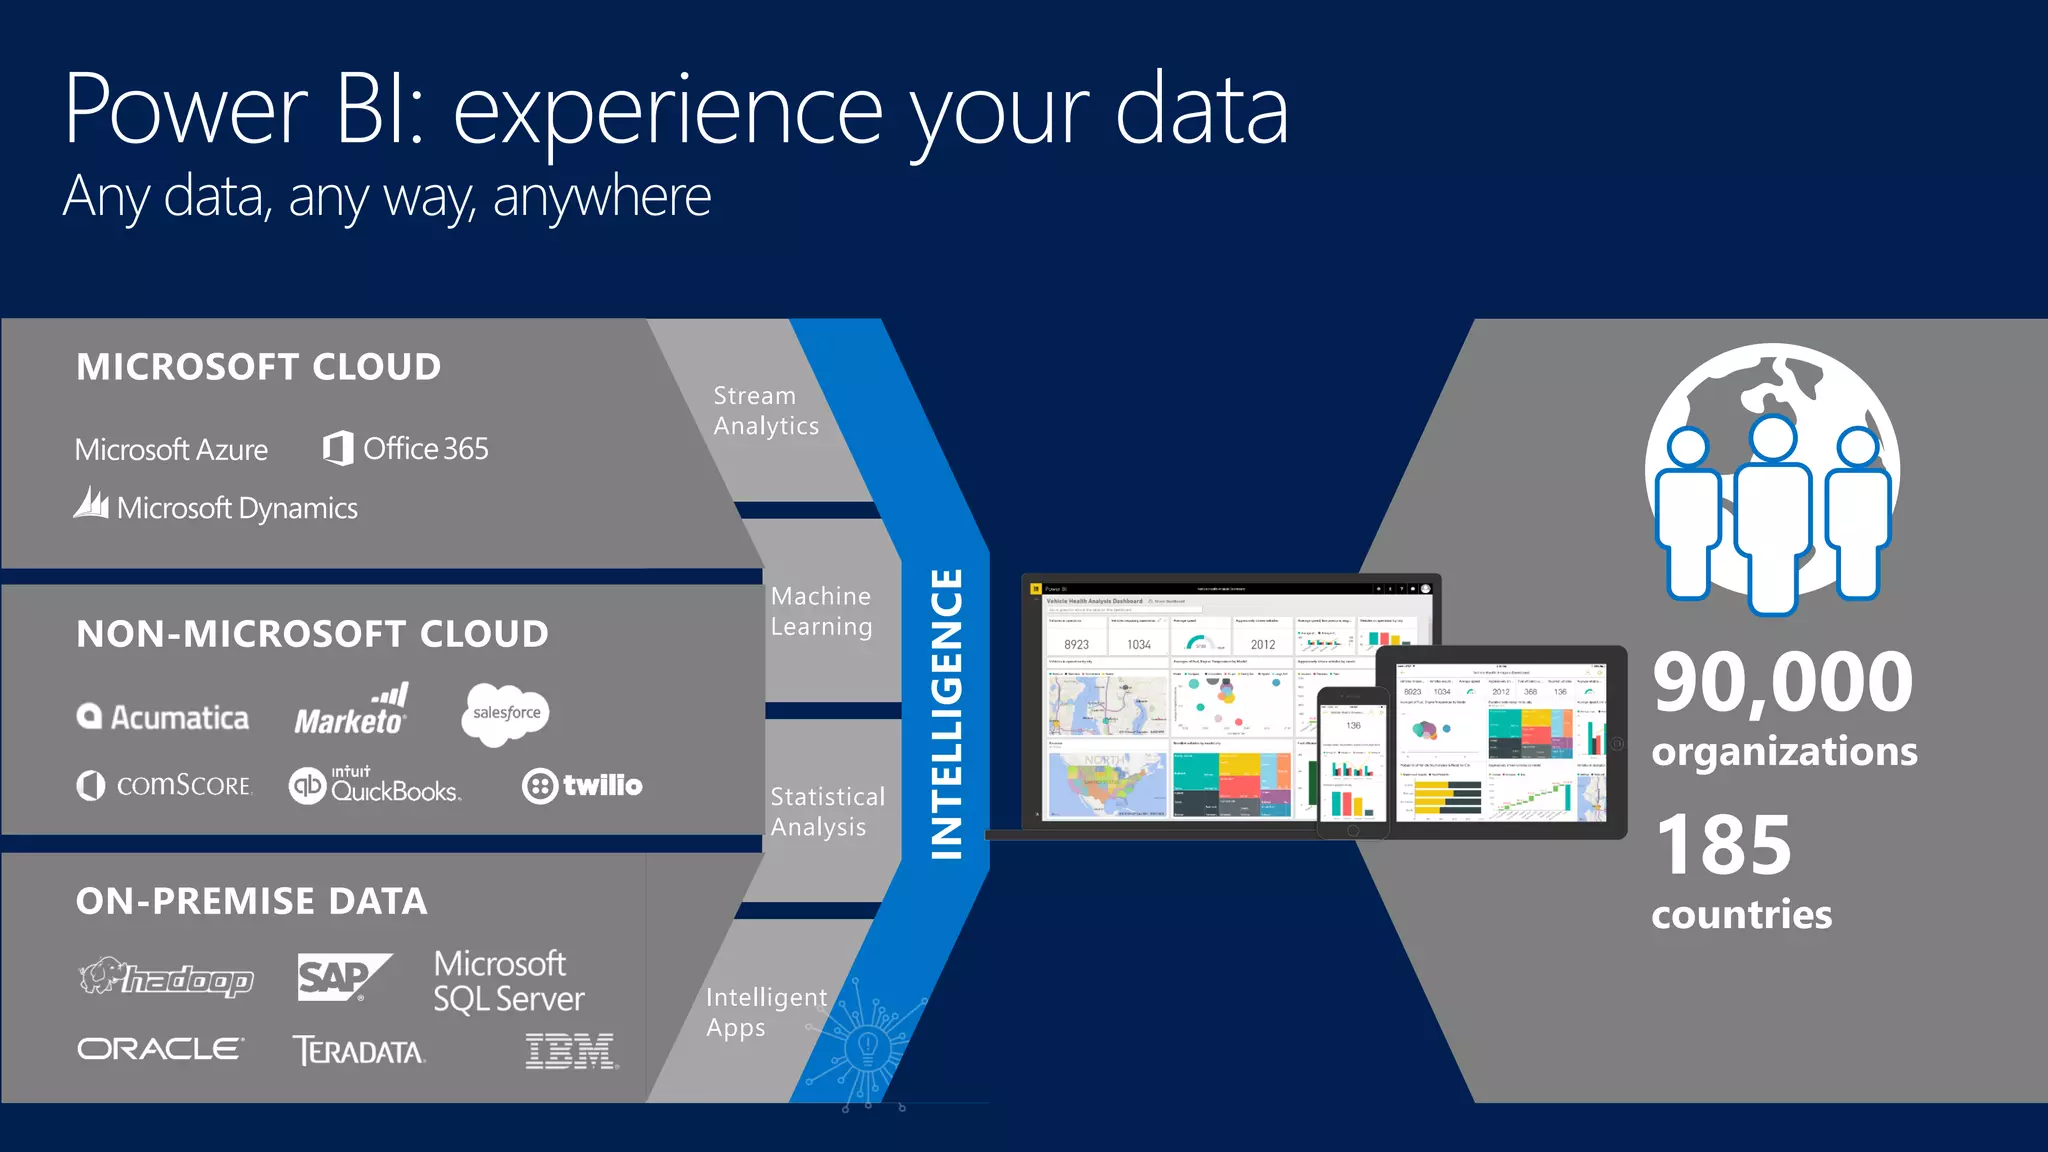
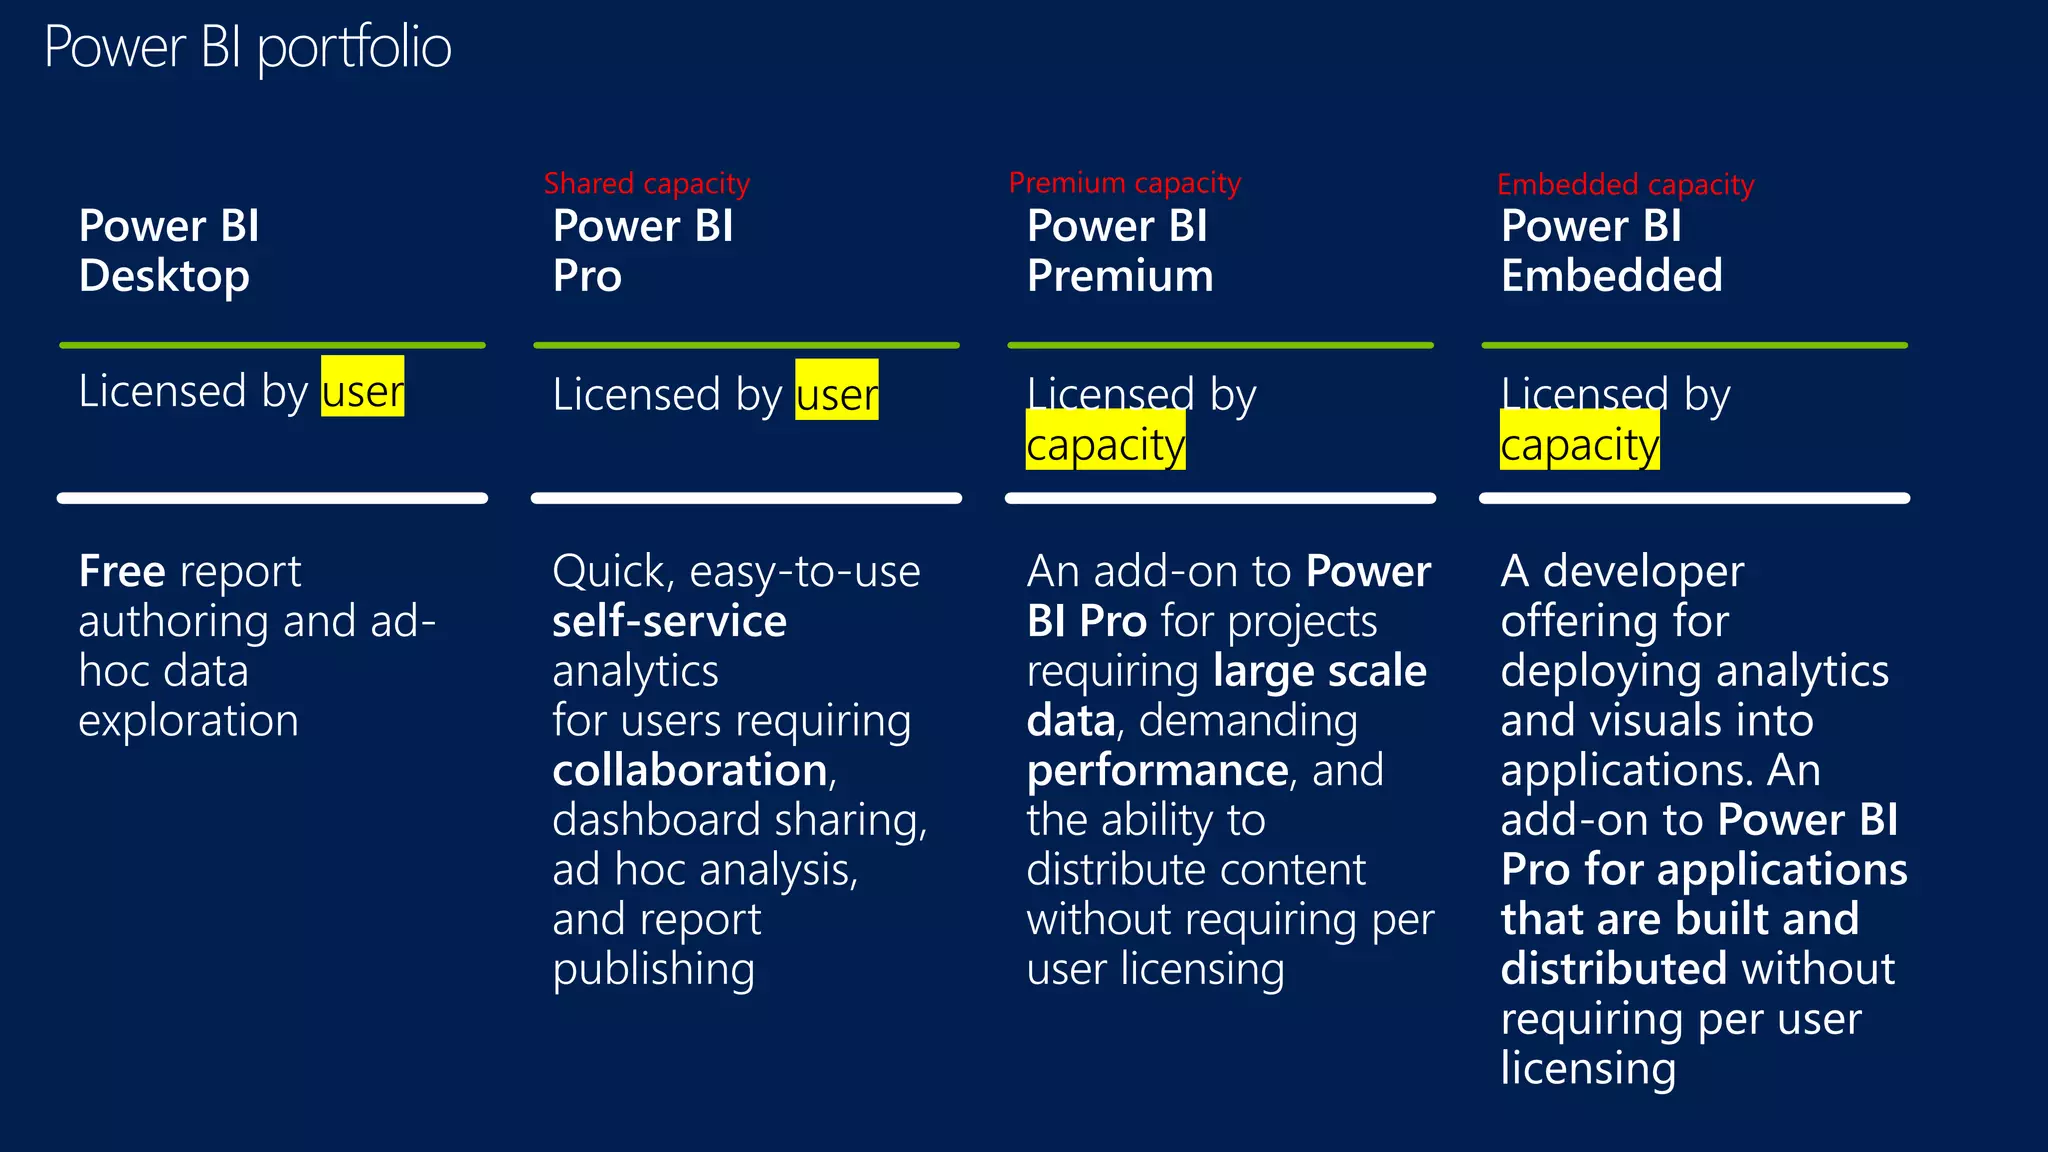
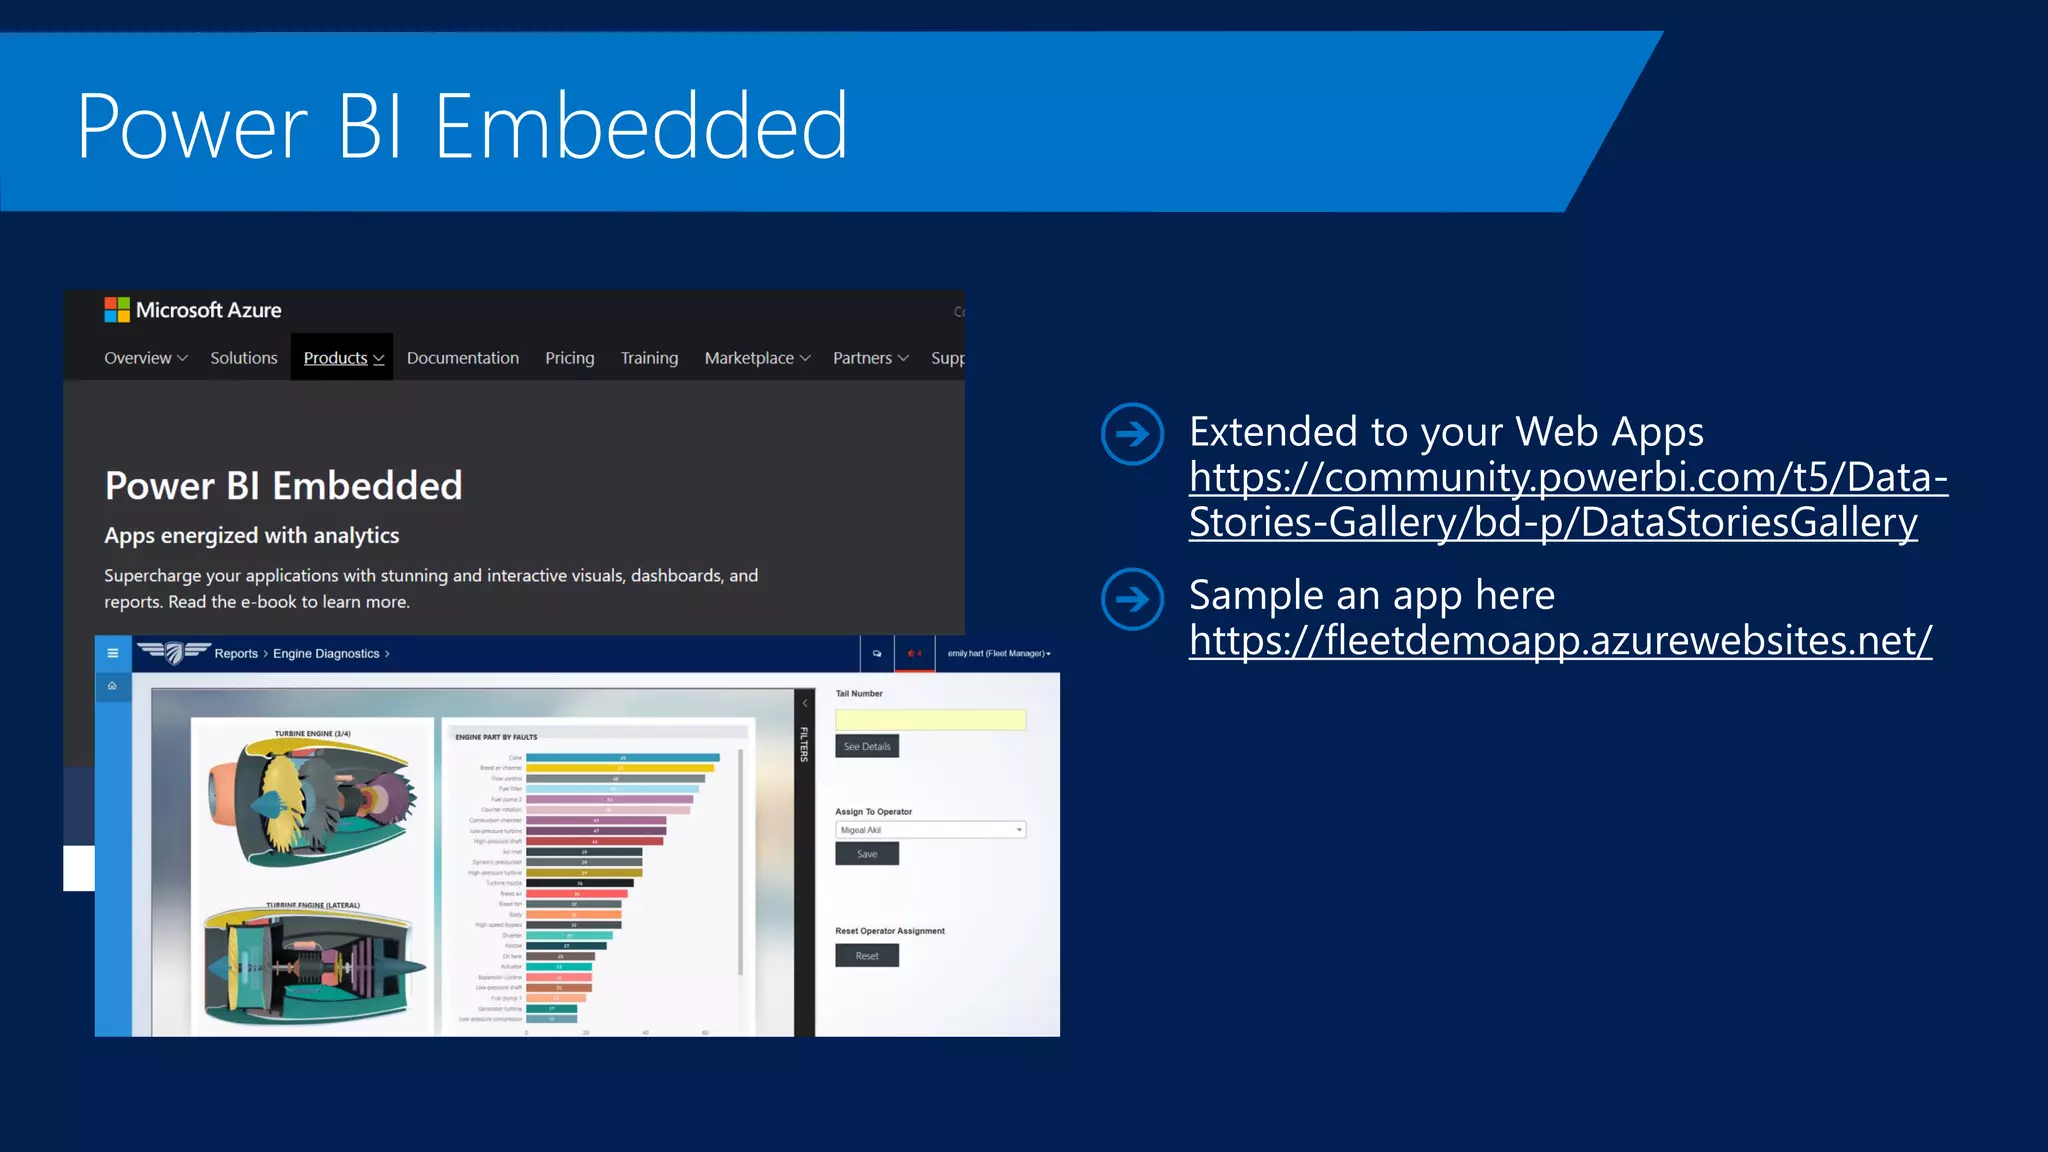

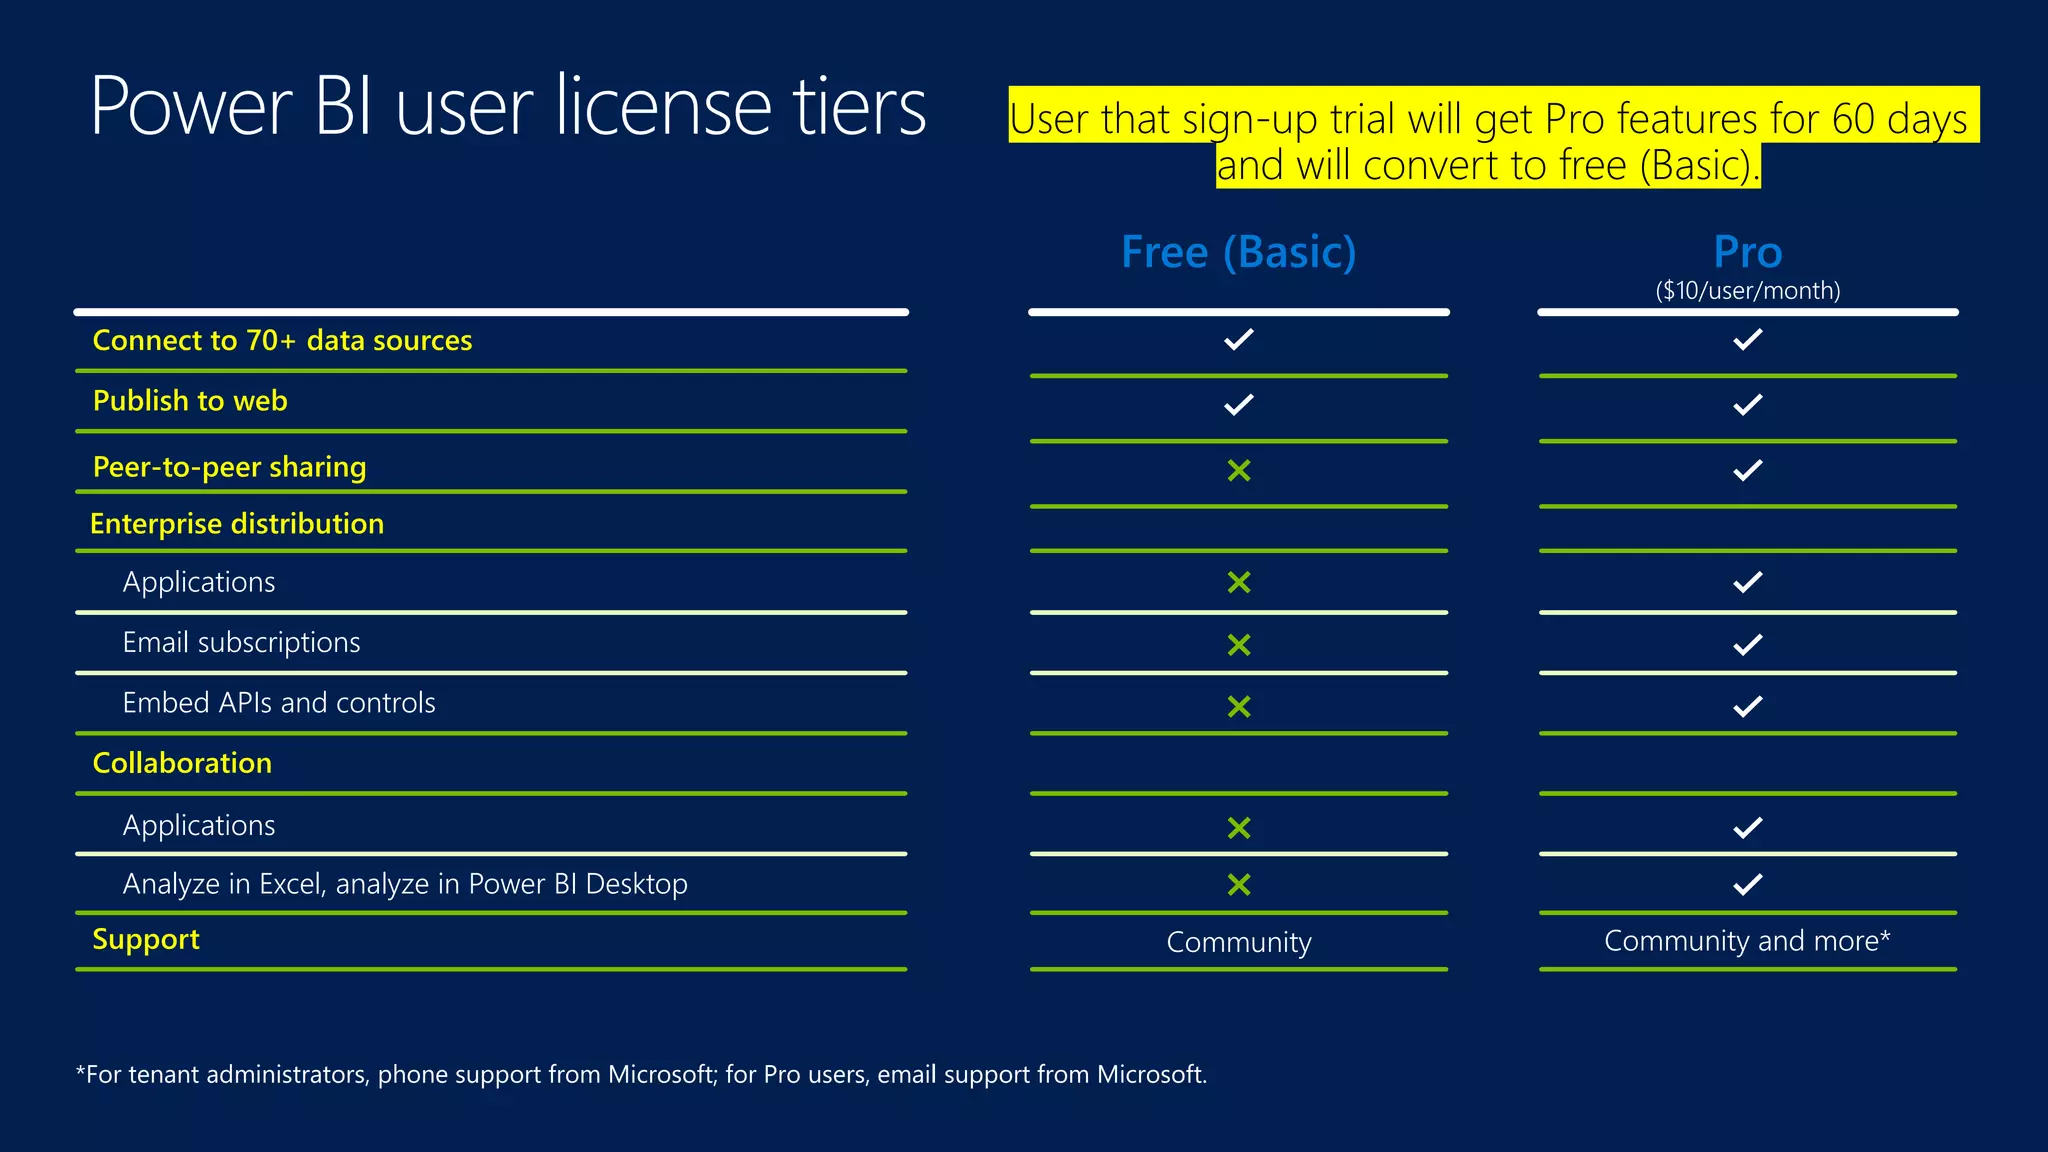
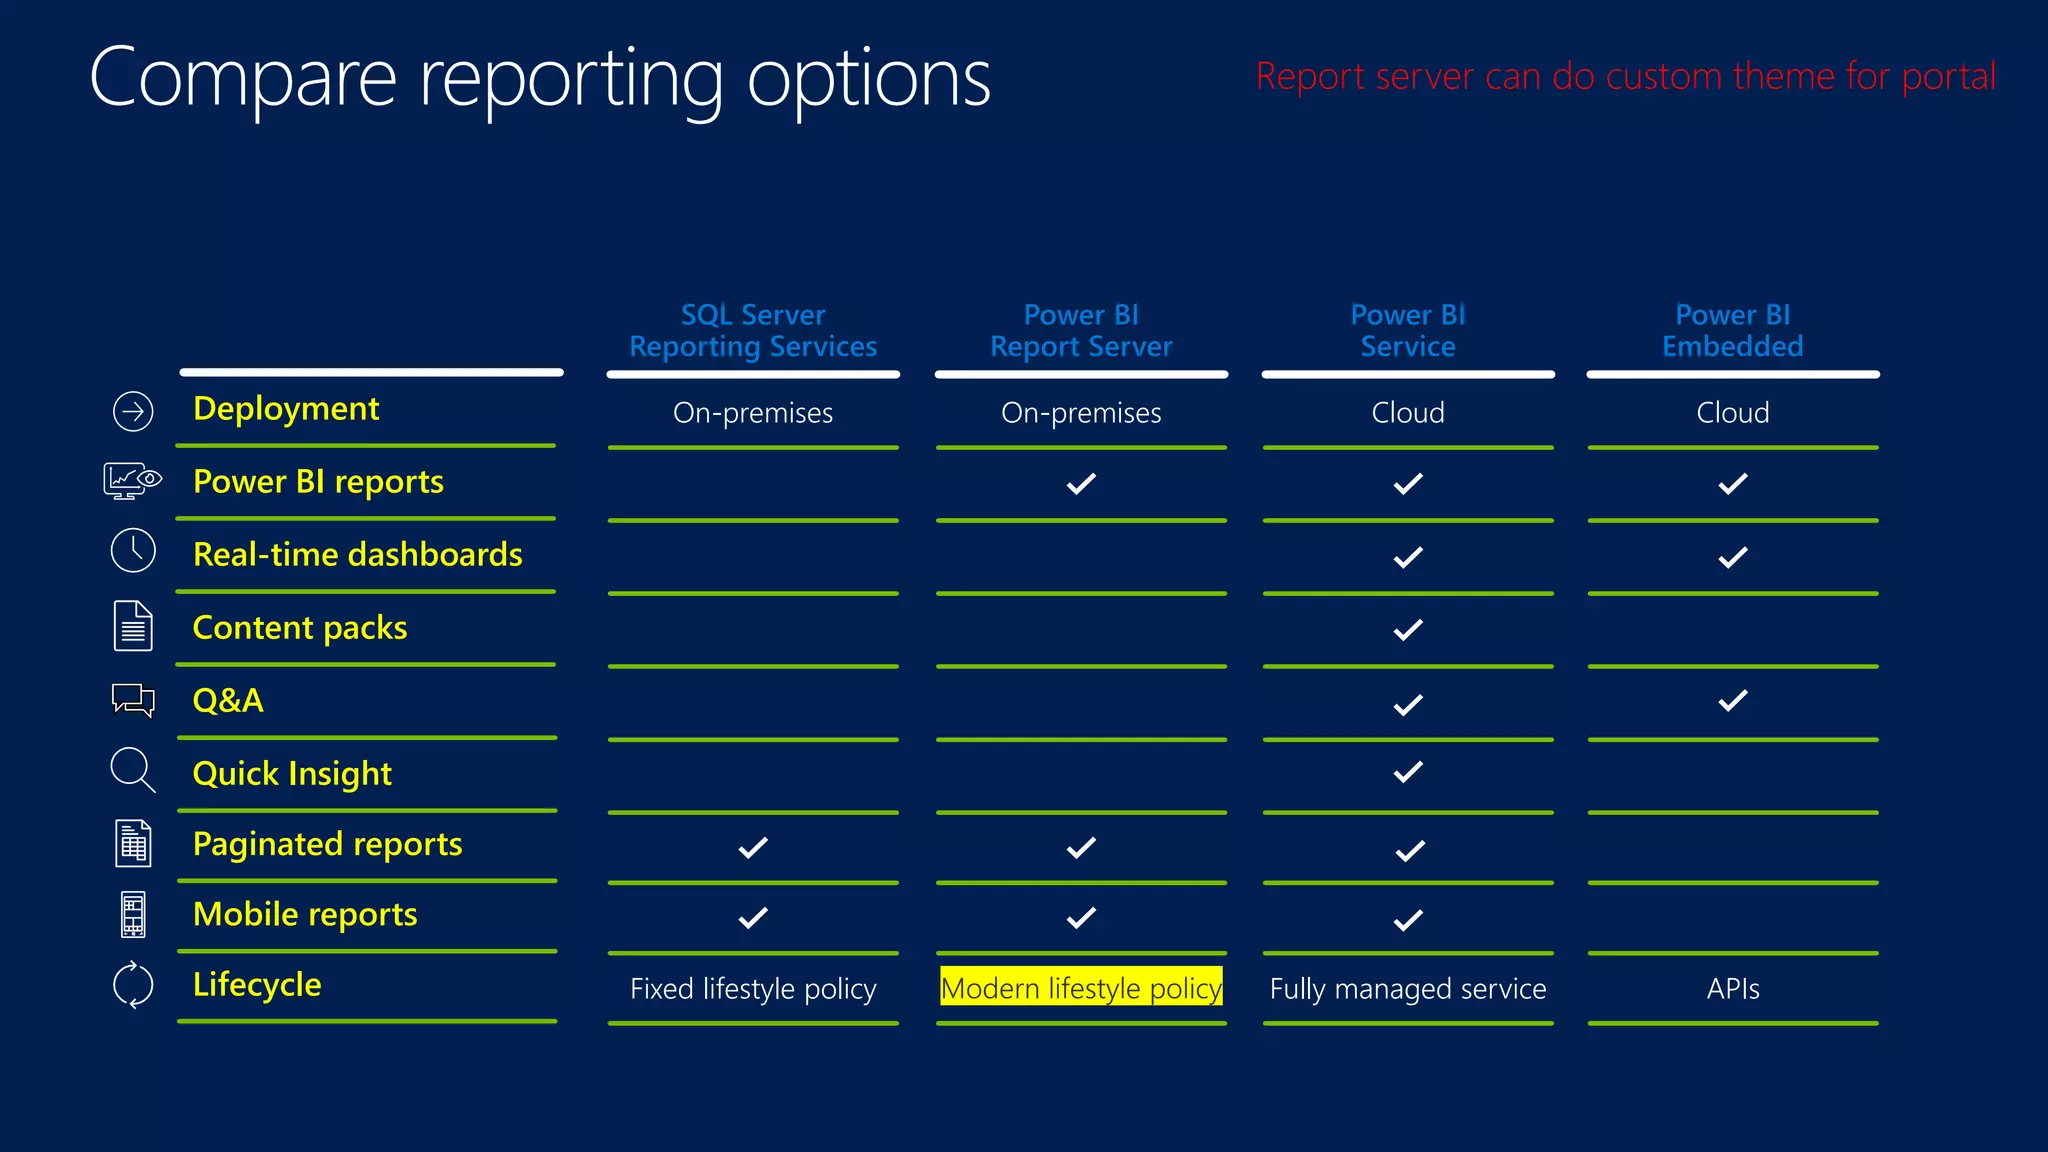
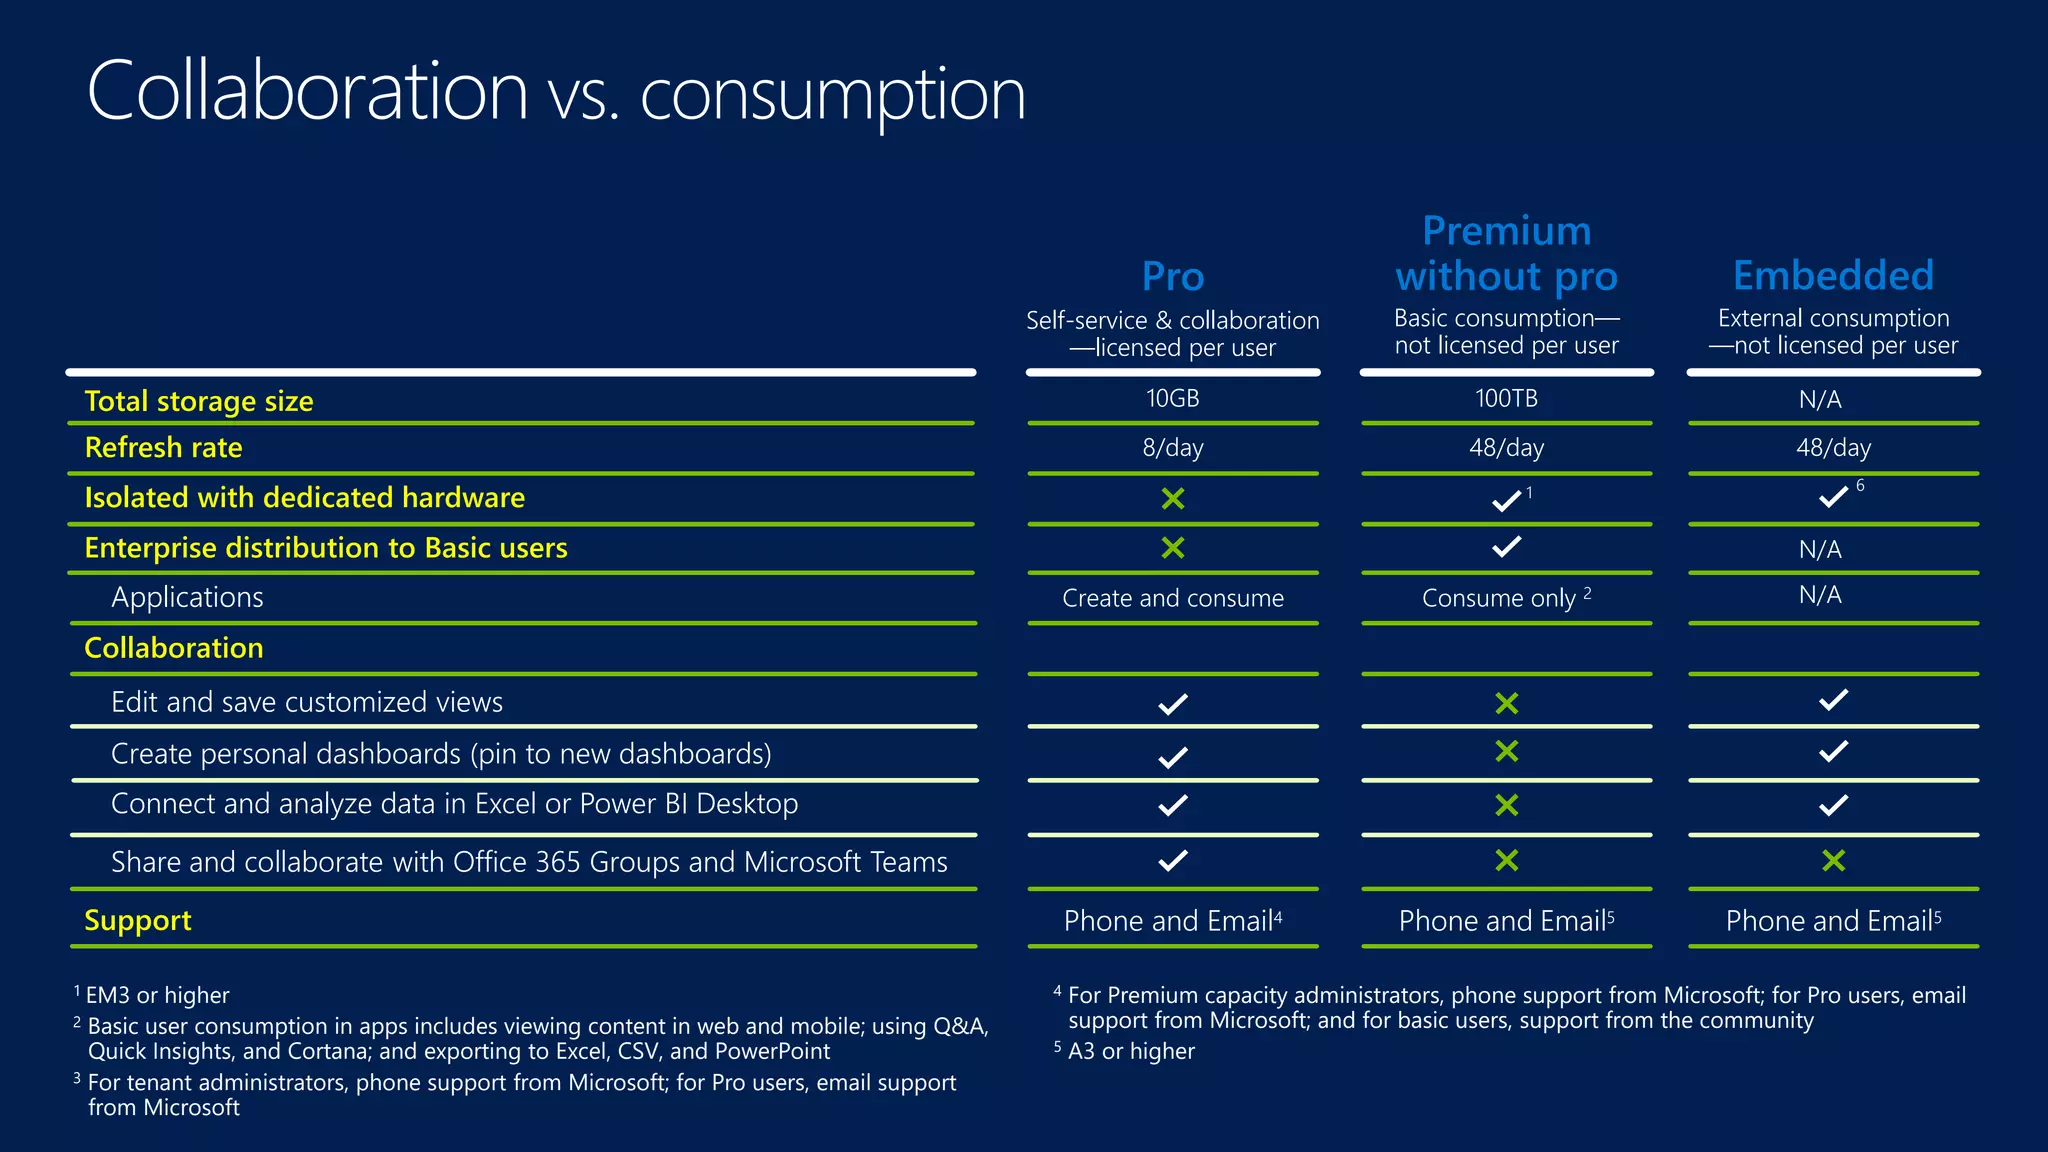
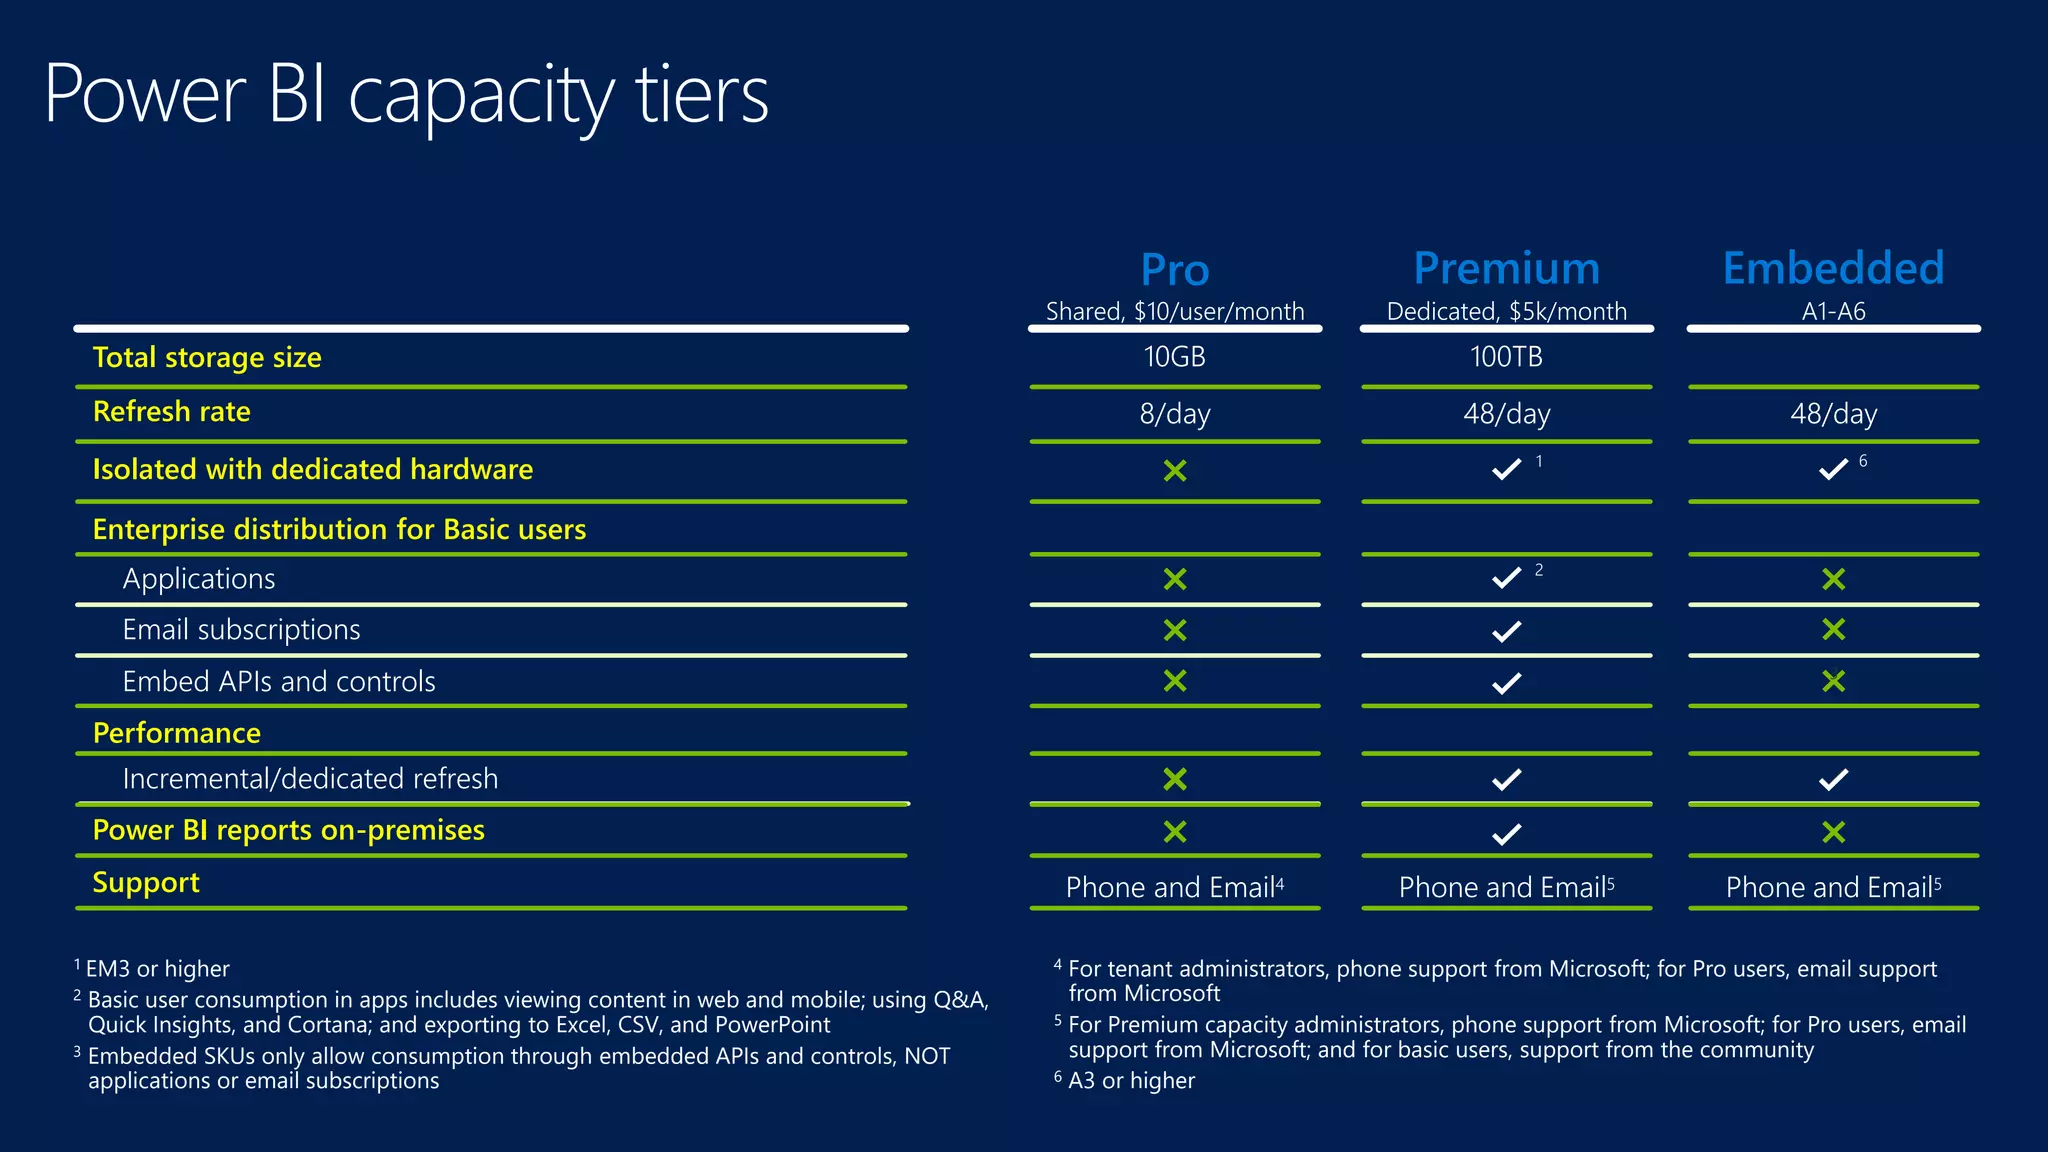
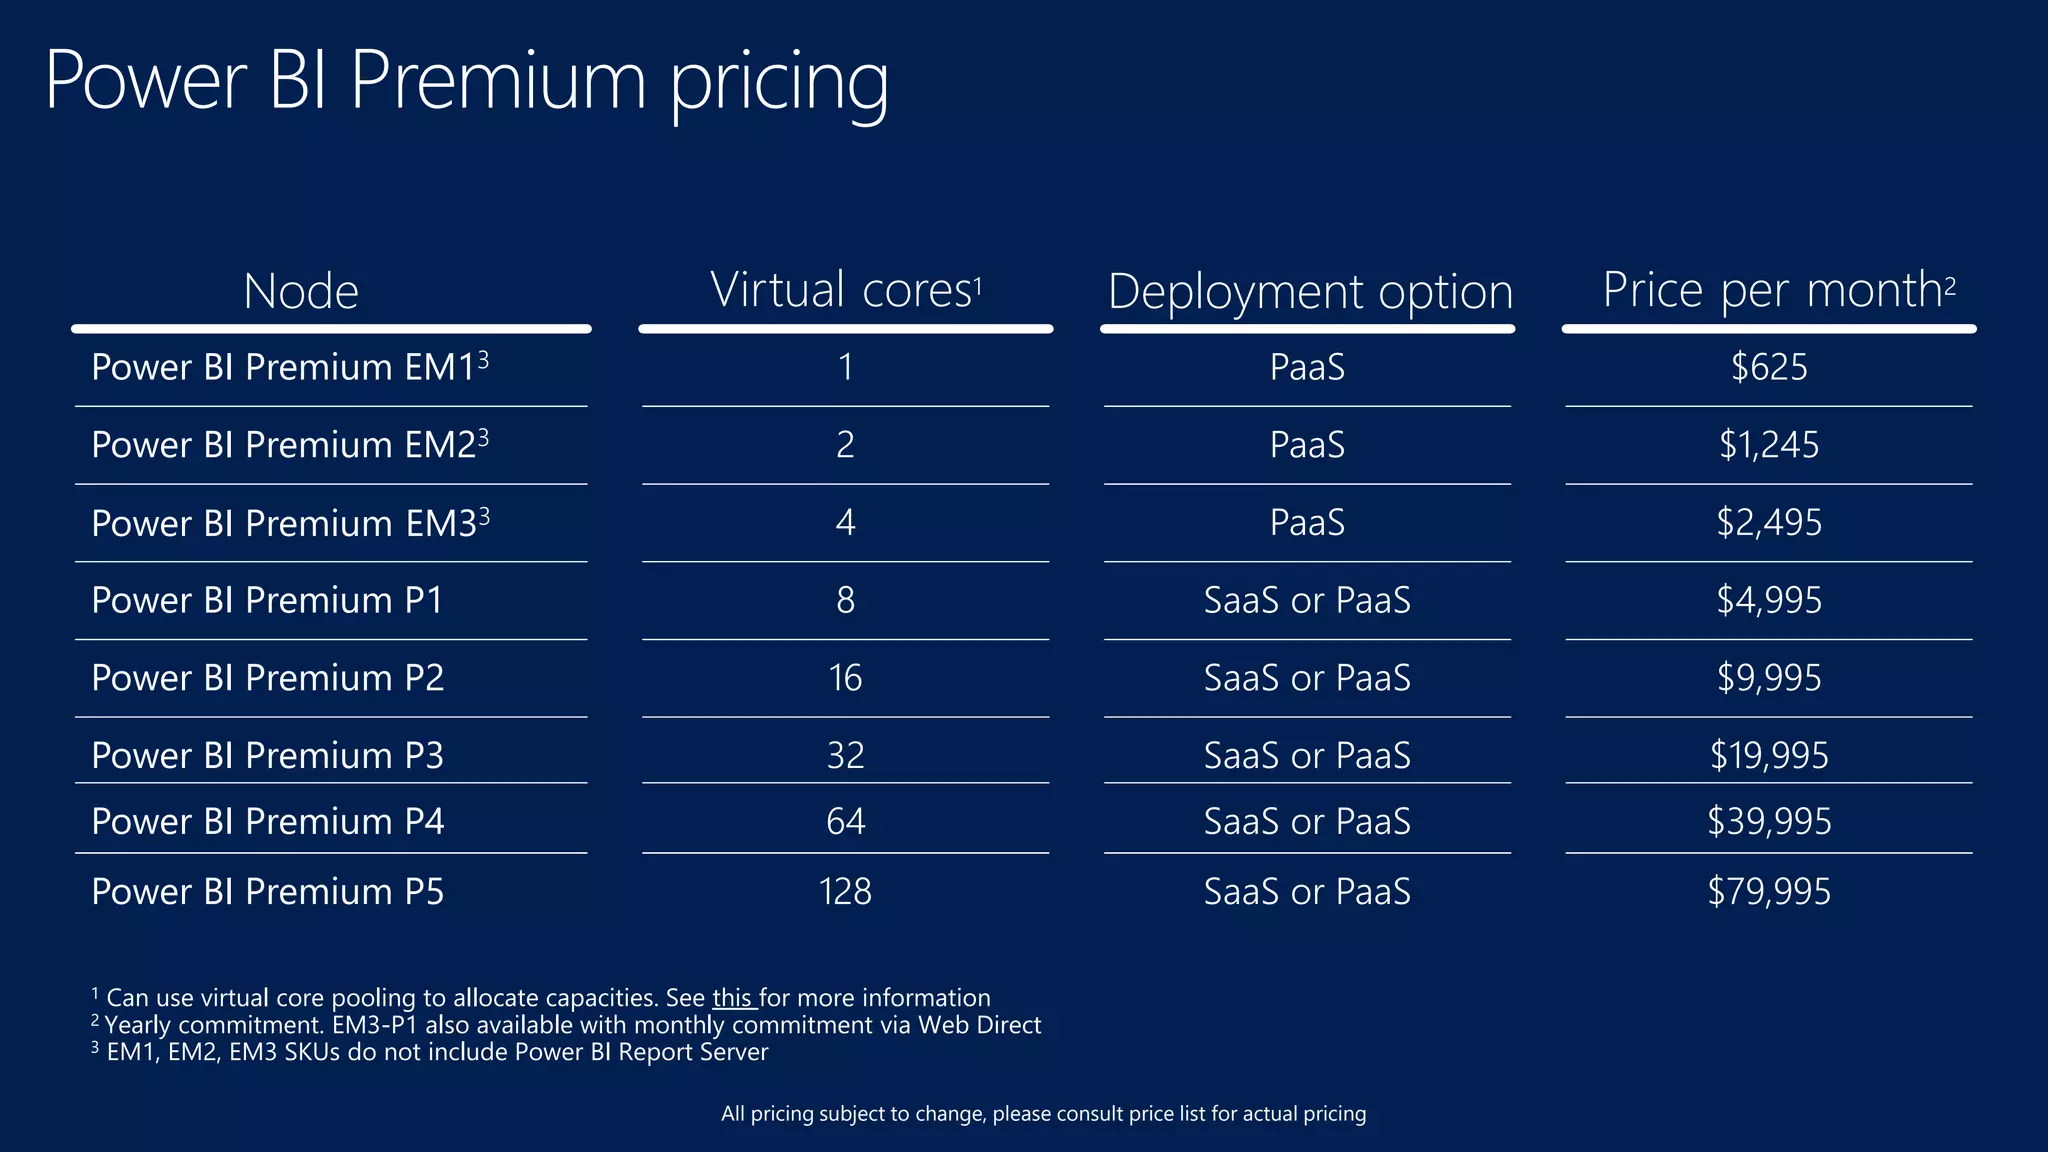
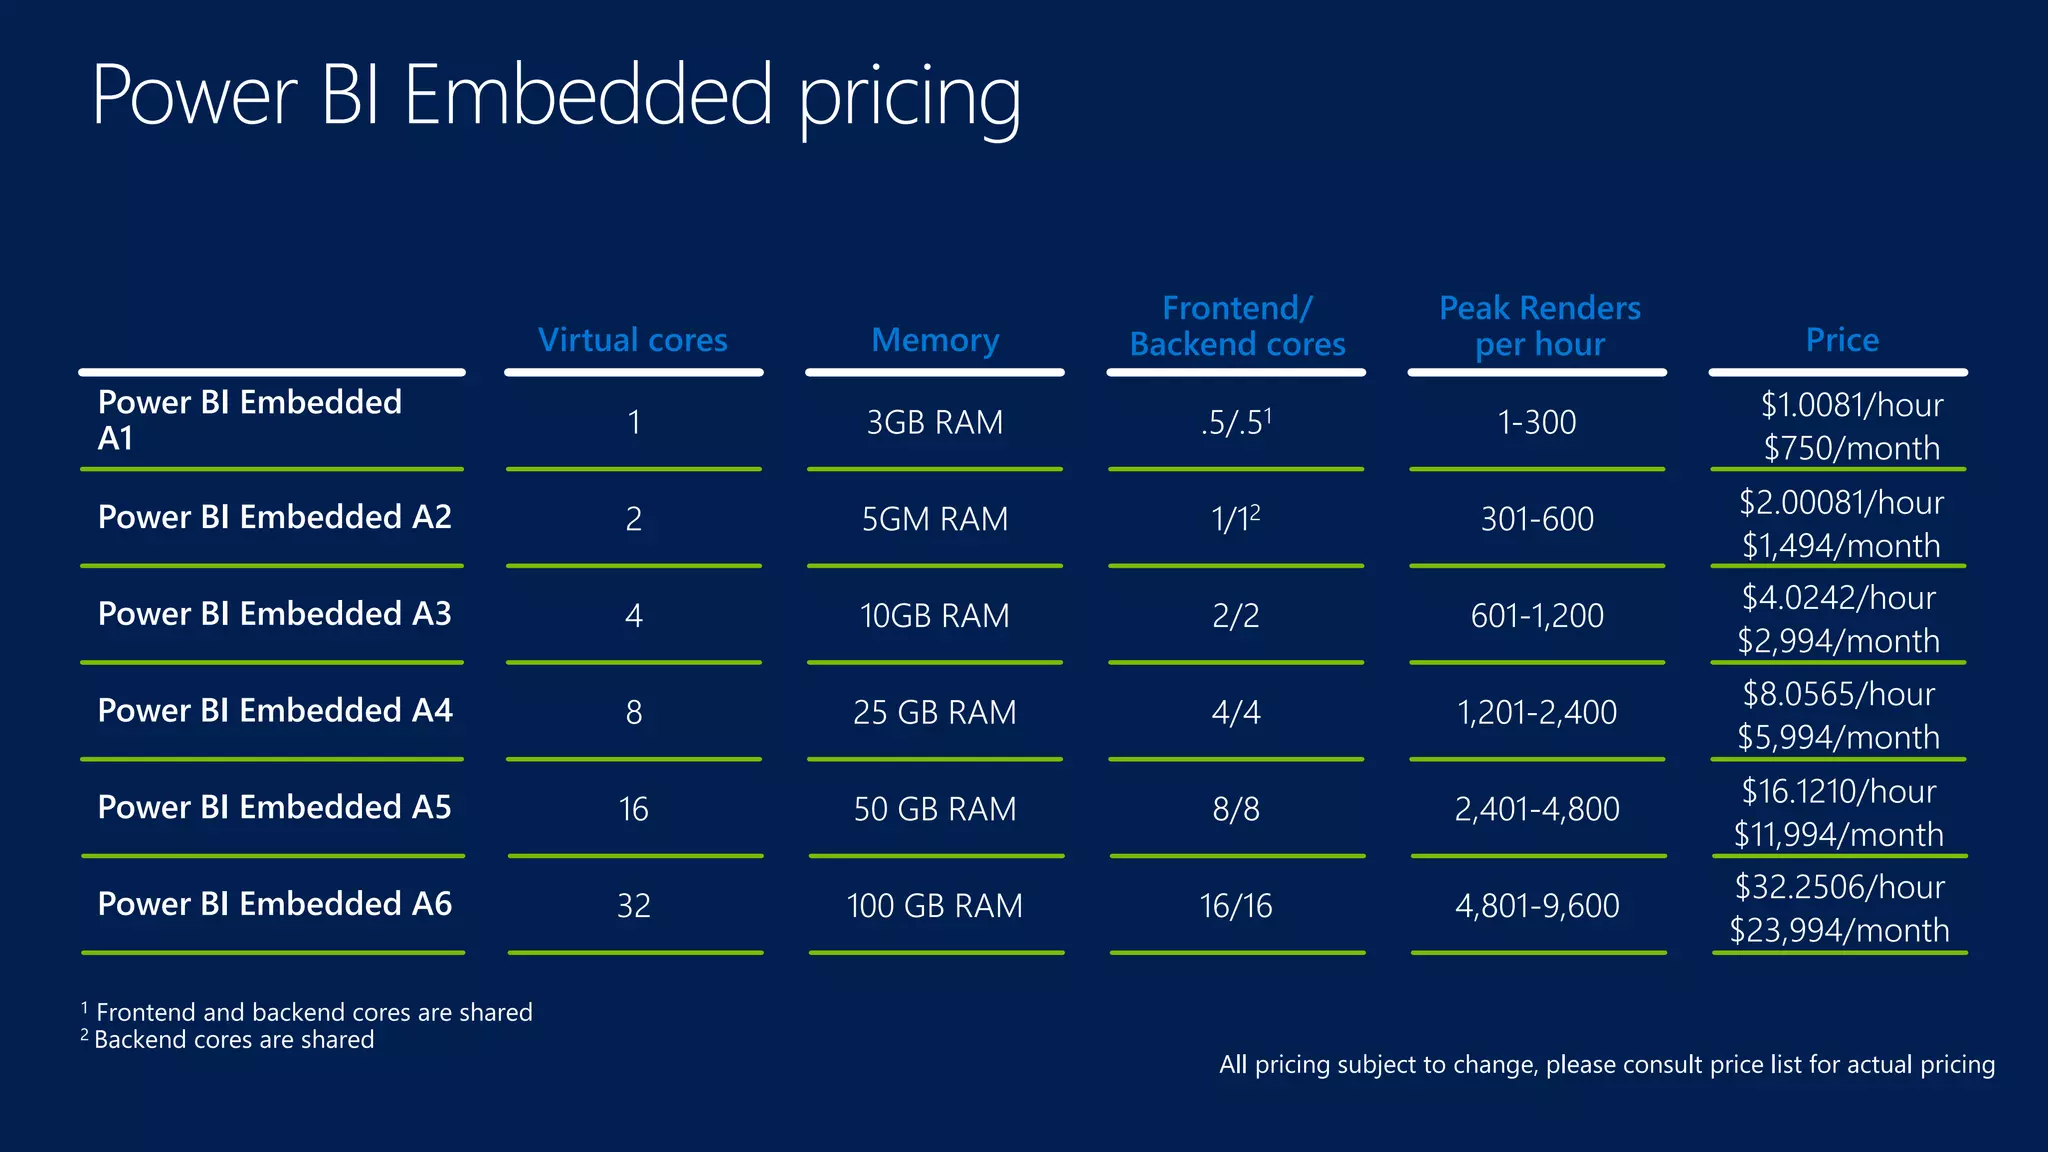
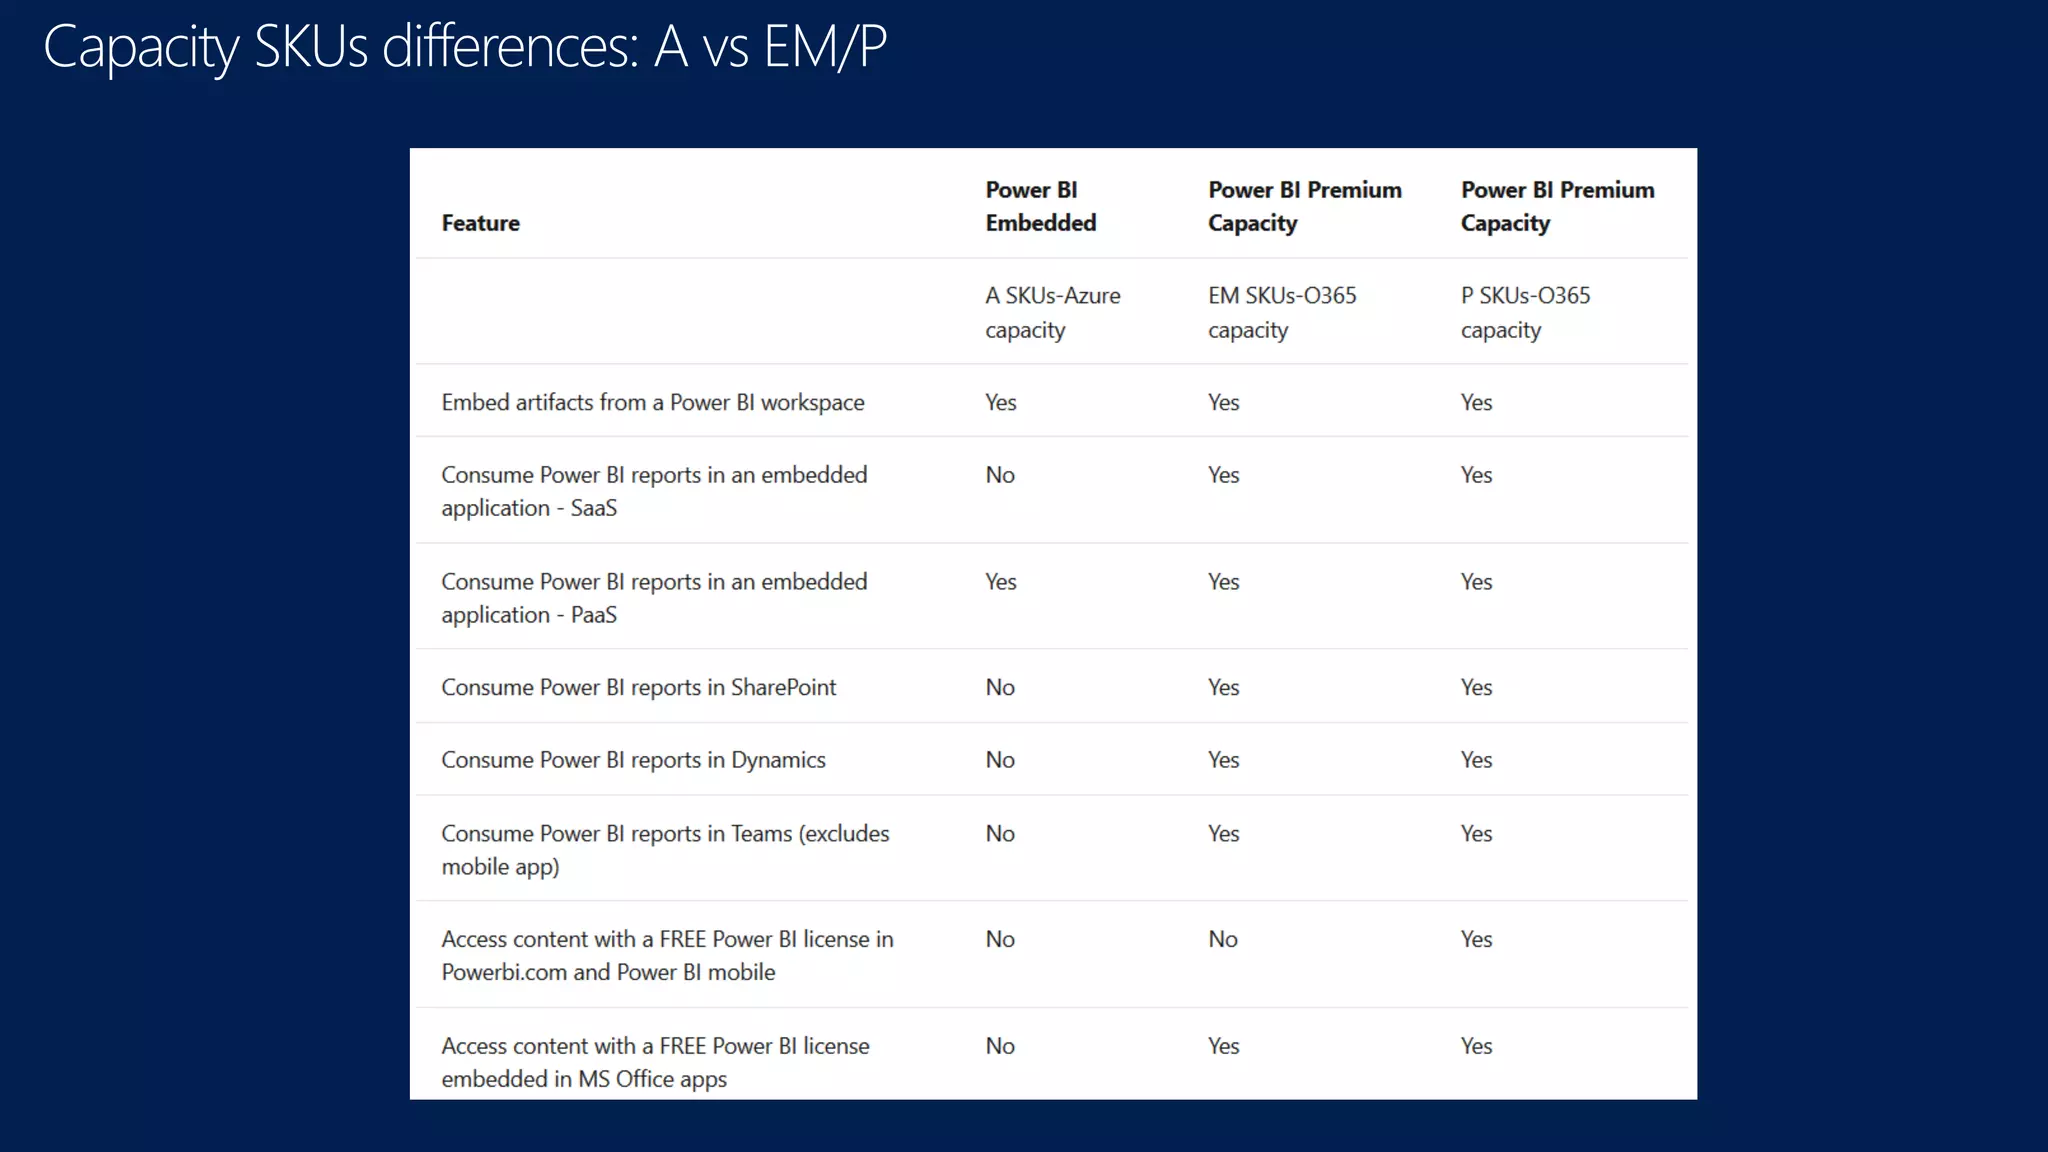
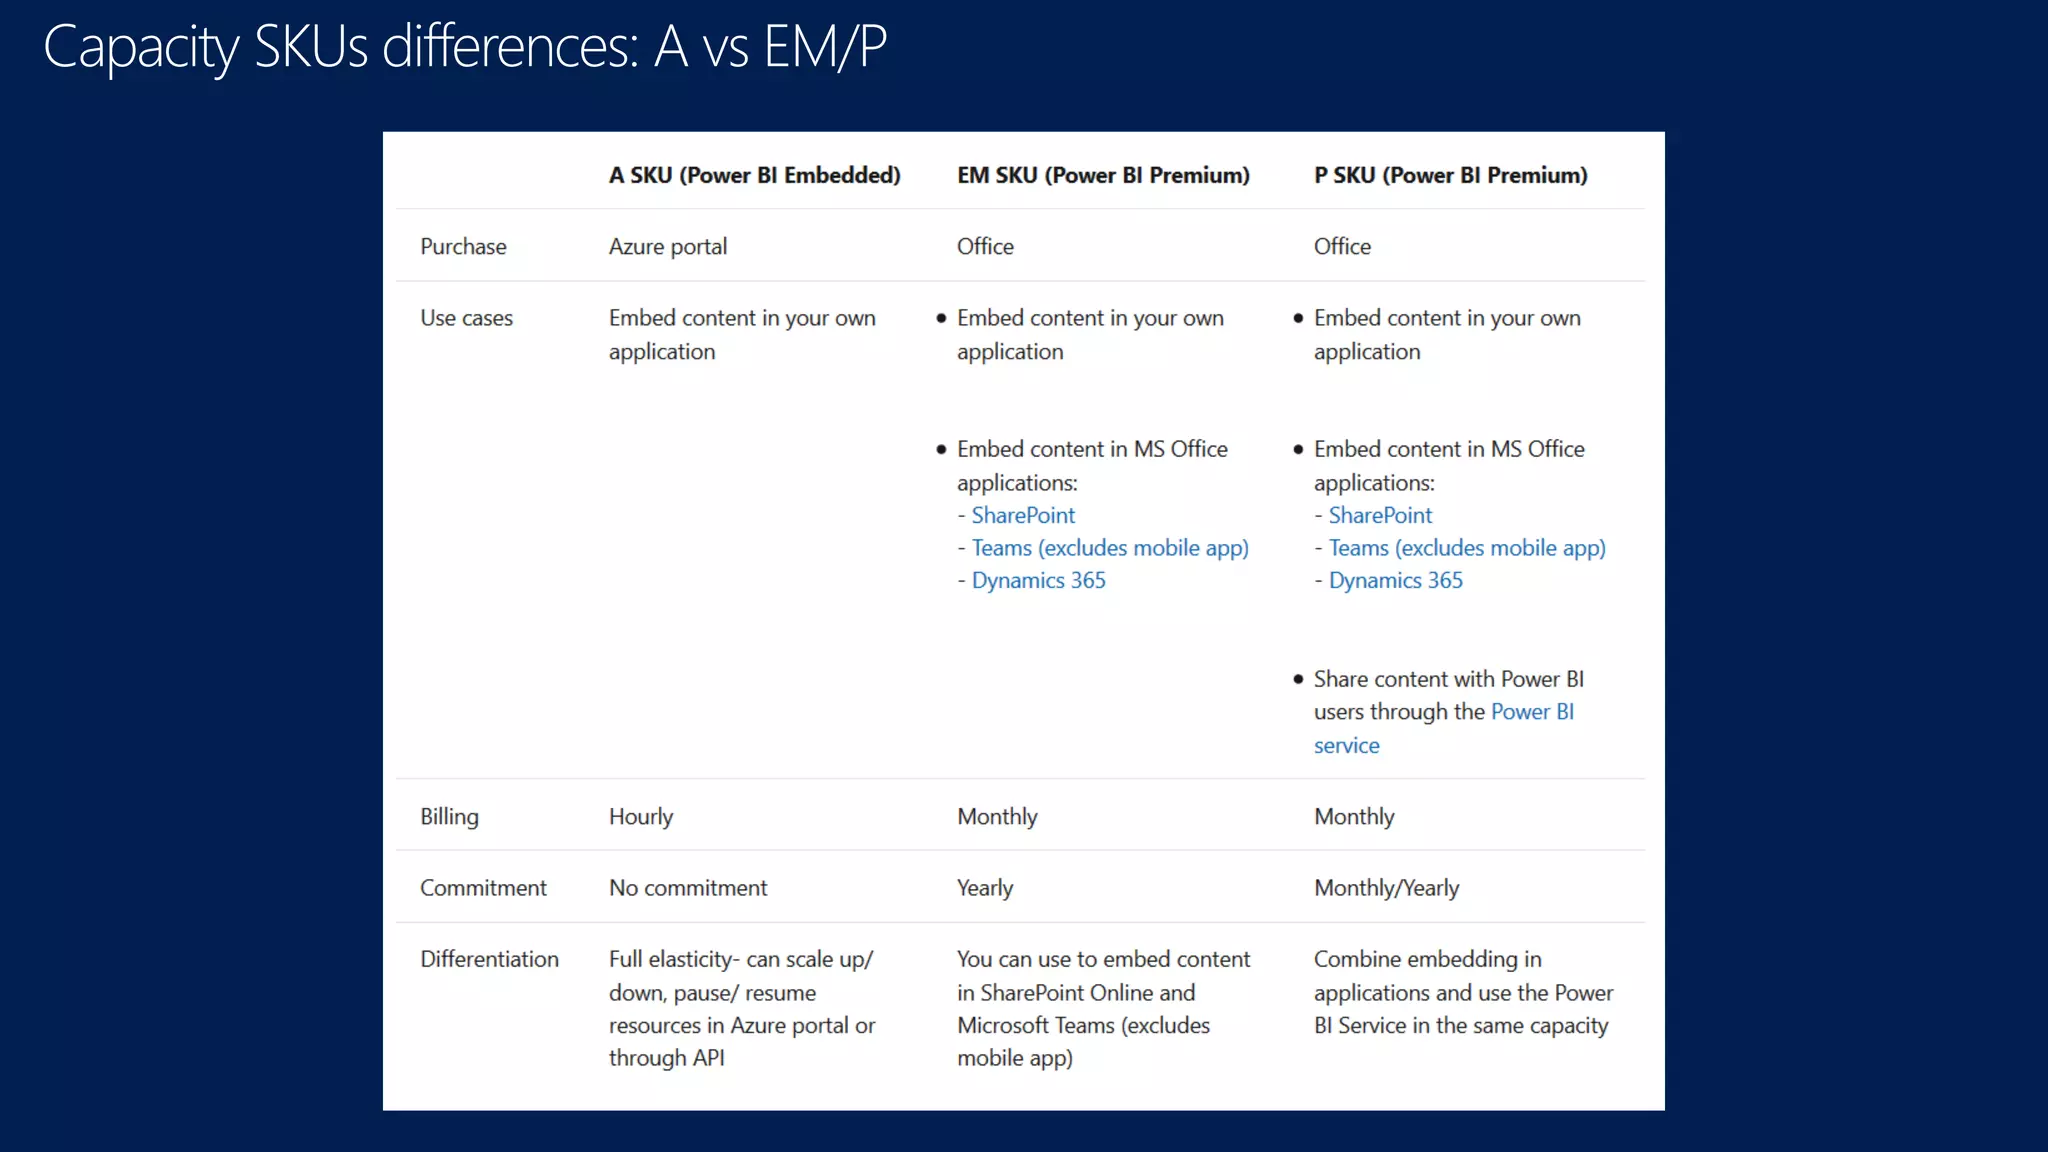

The document discusses various aspects of Microsoft Power BI, including its features, licensing options, and comparisons between self-service and organizational business intelligence. It provides details about the different Power BI products, user licensing tiers, performance capabilities, and storage limits. Additionally, it mentions data security measures and the infrastructure required for Power BI implementation.


![Mvpskill Saturday[EP48]Microsoft 365 Update [27 FEB 2021]](https://cdn.slidesharecdn.com/ss_thumbnails/mvpskillsaturdayep48-27sept2021-210227155111-thumbnail.jpg?width=640&height=640&fit=bounds)


![[BDD 2025 - Artificial Intelligence] Building AI Systems That Users (and Comp...](https://cdn.slidesharecdn.com/ss_thumbnails/ai-buildingaisystemsthatusersandcompanieslove-251124030845-038f7732-thumbnail.jpg?width=640&height=640&fit=bounds)


![Support, Monitoring, Continuous Improvement & Scaling Agentic Automation [3/3]](https://cdn.slidesharecdn.com/ss_thumbnails/agenticcommunityseries-day3-cfd-251120170304-ddef8112-thumbnail.jpg?width=640&height=640&fit=bounds)


![[DevFest Strasbourg 2025] - NodeJs Can do that !!](https://cdn.slidesharecdn.com/ss_thumbnails/devfeststrasbourg2025-nodejscandothat-251127142731-da65b6fd-thumbnail.jpg?width=640&height=640&fit=bounds)

![[BDD 2025 - Full-Stack Development] PHP in AI Age: The Laravel Way. (Rizqy Hi...](https://cdn.slidesharecdn.com/ss_thumbnails/fs-phpinaiagethelaravelway-251125012602-ef9d330e-thumbnail.jpg?width=640&height=640&fit=bounds)


