The document summarizes a presentation on sediment microbial fuel cells (MFCs). Key points:
- The goal is to produce 1W/m3 of power in a sediment MFC within a $20 budget using recycled materials.
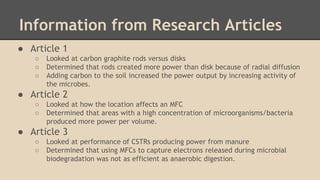
- A literature review covered MFC types and research on materials like graphite and biochar. A 50/50 graphite-biochar mix was selected.
- A designed MFC used screen-enclosed graphite-biochar pouches, copper wires, and a voltmeter within a PVC pipe structure. Testing showed a maximum power density of 0.205 mW/m3.


![Data for Polarization and Power Curve for 11-17
Resistance
(R) [ Ω ]
Voltage
(V) [V]
Current (I)
[A]
Power (P)
[W]
Power / Volume
(P/V) [W/m3]
Power/Area
(P/SA) [W/m2]
5070 0.01 1.97E-06 1.97E-08 1.54E-04 1.12E-06
4010 0.009 2.24E-06 2.02E-08 1.57E-04 1.15E-06
3075 0.008 2.60E-06 2.08E-08 1.62E-04 1.18E-06
2017 0.005 2.48E-06 1.24E-08 9.65E-05 7.05E-07
1038 0.003 2.89E-06 8.67E-09 6.75E-05 4.93E-07
493 0.001 2.03E-06 2.03E-09 1.58E-05 1.15E-07](https://image.slidesharecdn.com/kernichrawlsthompsonmfc-170928025904/85/Microbial-Fuel-Cell-Project-30-320.jpg)
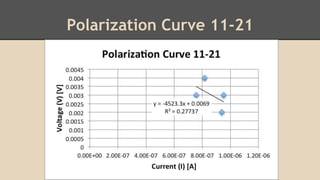
![Data for Polarization and Power Curve for 11-21
Resistance
(R) [ Ω ]
Voltage
(V) [V]
Current
(I) [A]
Power
(P) [W]
Power/volume
(P/V) [W/m3]
Power/Area
(P/SA) [W/m2]
4900 0.004 8.16E-07 3.27E-09 2.54E-05 1.86E-07
3960 0.003 7.58E-07 2.27E-09 1.77E-05 1.29E-07
3148 0.003 9.53E-07 2.86E-09 2.23E-05 1.63E-07
2130 0.002 9.39E-07 1.88E-09 1.46E-05 1.07E-07](https://image.slidesharecdn.com/kernichrawlsthompsonmfc-170928025904/85/Microbial-Fuel-Cell-Project-31-320.jpg)
![Data for Polarization and Power Curve for 11-24
Resistance
(R) [ Ω ]
Voltage (V)
[V]
Current (I)
[A]
Power (P)
[W]
Power/volume
(P/V) [W/m3]
Power/Area
(P/SA) [W/m2]
5,180 0.0091 1.76E-06 1.60E-08 1.24E-04 9.10E-07
3930 0.0082 2.09E-06 1.71E-08 1.33E-04 9.74E-07
2950 0.0074 2.51E-06 1.86E-08 1.44E-04 1.06E-06
1920 0.0056 2.92E-06 1.63E-08 1.27E-04 9.29E-07
1040 0.0035 3.37E-06 1.18E-08 9.17E-05 6.70E-07
558 0.0019 3.41E-06 6.47E-09 5.04E-05 3.68E-07
246 0.0009 3.66E-06 3.29E-09 2.56E-05 1.87E-07
108 0.0004 3.70E-06 1.48E-09 1.15E-05 8.43E-08
55 0.0001 1.82E-06 1.82E-10 1.42E-06 1.03E-08](https://image.slidesharecdn.com/kernichrawlsthompsonmfc-170928025904/85/Microbial-Fuel-Cell-Project-32-320.jpg)
![Highest Power Densities by Day
Day
Resistance
(R) [Ω]
Voltage
(V) [V]
Current
(I) [A]
Power
(P) [W]
Power Density
(P/V) [W/m3]
Water
Temperature
(T) [℃]
0 3075 0.008 2.60E-06 2.08E-08 1.62E-04 11.9
1 2338 0.003 1.28E-06 3.85E-09 3.00E-05 8.8
2 2324 0.003 1.29E-06 3.87E-09 3.01E-05 8.6
3 2338 0.003 1.28E-06 3.85E-09 3.00E-05 11.1
4 4900 0.004 8.16E-07 3.27E-09 2.54E-05 12.6
5 2430 0.008 3.29E-06 2.63E-08 2.05E-04 9.3
7 2950 0.0074 2.51E-06 1.86E-08 1.44E-04 11.4
8 4518.2 0.0065 1.44E-06 9.35E-09 7.28E-05 11.7](https://image.slidesharecdn.com/kernichrawlsthompsonmfc-170928025904/85/Microbial-Fuel-Cell-Project-33-320.jpg)


