This document summarizes an urban ecosystem analysis of Miami-Dade County and the City of Miami conducted in 2008. It analyzes land cover changes between 2004-2006 using high resolution satellite imagery and between 1996-2006 using moderate resolution Landsat imagery. The analysis found decreases in vegetative land cover over the past decade, reducing environmental benefits. Significant tree loss occurred due to hurricanes and citrus canker eradication programs. The study provides land cover data and tools to help local governments incorporate natural systems into planning and strengthen connections between urban and natural environments.
www.docgreen.it - 5 capitolo del manuale *Urban and Periurban Forests. Management, monitoring and eco system services*.
Il manuale è stato concepito come un prodotto multimediale continuamente aperto ad aggiornamenti e arricchimenti. Rappresenta il risultato del lavoro di un équipe multidisciplinare che ha affrontato, da più punti di vista, il tema delle foreste urbane e periurbane, offrendo riflessioni, spunti e indicazioni tecnico/scientifiche in merito alla loro pianificazione, monitoraggio e manutenzione.
Per questo il manuale costituisce un utile strumento per tecnici, professionisti, amministratori coinvolti nella gestione del patrimonio verde urbano e periurbano.
www.docgreen.it - 3 capitolo del manuale *Urban and Periurban Forests. Management, monitoring and eco system services*.
Il manuale è stato concepito come un prodotto multimediale continuamente aperto ad aggiornamenti e arricchimenti. Rappresenta il risultato del lavoro di un équipe multidisciplinare che ha affrontato, da più punti di vista, il tema delle foreste urbane e periurbane, offrendo riflessioni, spunti e indicazioni tecnico/scientifiche in merito alla loro pianificazione, monitoraggio e manutenzione.
Per questo il manuale costituisce un utile strumento per tecnici, professionisti, amministratori coinvolti nella gestione del patrimonio verde urbano e periurbano.
Urban Tree Canopy Inventory done for the City of Grand Rapids, MI, by the Grand Valley State University/Annis Water Resources Institute. http://www.gvsu.edu/wri/
Prepared for presentation at conference organized by Yashwantrao Chavan Pratishthan, Mumbai on 6 March 2010, which had as chief guests Shri Jairam Ramesh, Minister of State, Environment and Forests, Govt of India
This was submitted on October 5th 2009 to the Joint Agency Review Team reviewing the Mount Nemo Quarry. I also provided the experts minutes from OMB case PL071044 to illustrate how a certain firm signed off on the fact their own data was insufficient. I have been monitoring the practices of this agency over years in different locations and have found consistencies in testing methods that result in undermined hydrogeological risks.
Olorunnisola, A.O., Richards, A. and Omoniyi, T.E., 2021. A Review on the Renewable Energy from Agricultural and Forest Residues in Nigeria. United International Journal for Research & Technology (UIJRT), 3(1), pp.04-11.
Submission made during the public process regarding the Nelson Quarry Project. Risks to natural features, endangered species, economy and ecology as well as geological risks of the project. (Project was successfully cancelled)
Forms of Water Supply, Conservation and use in Banigbe District, Municipality...IJAEMSJORNAL
Rural populations in underdeveloped countries like Benin have difficult access to safe drinking water. This research aims to study the forms of water supply, conservation and use in Banigbé district. The methodological approach revolves around data collection through documentary research; data processing and results analysis. It appears that 88.75% of the 80 households selected for the survey in Banigbé, use at-risk sources (rivers; Private PEA; traditional wells). Only 11.25% have access to water from conventional sources such as the National Water Society of Benin (SONEB) and the Drilling of Human Motric Pumps (FPM). 88.75% of those selected for the survey also said that they do not treat drinking water at any source. It is therefore necessary to improve the quality of the water to which the populations of Banigbé have access to, and this through the disinfection of water from at risk sources and the proliferation of village hydraulic equipment in the district of Banigbé.
Paul Roebuck, one of our London based ecologists, takes you through some basics on green infrastructure in the UK and highlights some really interesting projects we have worked on and exciting future developments.
The slides cover legislation, mitigation, habitat creation, ecology impact assessments and green roofs and walls.
Mulugeta Bantigegn, Achenef Motbainor and Teferi Mekonnon,“Onsite Proper Solid Waste Handling Practices and Associated Factors Among Condominium Residents in Debre-Markos Town, East Gojjam Zone, North West Ethiopia: A Community Based Cross-Sectional Study” United International Journal for Research & Technology (UIJRT), Volume 01, Issue 06, pp. 01-11, 2020. https://uijrt.com/articles/v1i6/UIJRTV1I60001.pdf
Value, Benefits, and Costs of Urban Trees
`
For more information, Please see websites below:
`
Organic Edible Schoolyards & Gardening with Children
http://scribd.com/doc/239851214
`
Double Food Production from your School Garden with Organic Tech
http://scribd.com/doc/239851079
`
Free School Gardening Art Posters
http://scribd.com/doc/239851159`
`
Increase Food Production with Companion Planting in your School Garden
http://scribd.com/doc/239851159
`
Healthy Foods Dramatically Improves Student Academic Success
http://scribd.com/doc/239851348
`
City Chickens for your Organic School Garden
http://scribd.com/doc/239850440
`
Simple Square Foot Gardening for Schools - Teacher Guide
http://scribd.com/doc/239851110
Presentation on Green infrastructure for Urban AreasVijeta Nigam
Rapid urbanization and scarcity of land are the characters of present India’s urban face. Migration of population continuously adds pressure on the natural growth of the towns and cities. The value of “Green Infrastructure” is needed to be upgraded with the growing communities and their built environment. The concept of green infrastructure shifts opens space protection from a community amenity to a community necessity. It comprises of many built elements of varying scales at different levels like individual building, street or an entire neighbourhood. The network of open space, woodlands, wildlife habitat, parks and other natural areas altogether sustains clean air, water and natural resources also enhances our quality of life needs to be taken under consideration.
The present study encompasses the need, importance,
principles, concept and examples and recommendations of green growth including international case studies.
I"m a Web Developer,Wordpress Expert and Affiliate Marketer living in Bangladesh.I spend my days with my hands in many different areas of web development
Landscape Architecture Vision for Indian Residential ProjectAmir Mueller
Amir Mueller, Landscape Architecture in India, Resdiential Development in India, Landscape Architecture Vision, Landscape Planning, Reflecting Pools, Inspiration for Landscape Design, The Modern Garden, Genus Loci, Roads and Footpaths, Gardens and Public Spaces, Curvilinear Paths and Trails, wood decks and bridges, water gardens, Amphitheatre and Congregation, simple materials, planting to accenuate water's edge, www.amirmueller.com
Collaboration, Science, and Technology Merge to Improve Water QualityArbor Day Foundation
Collaboration, Science, and Technology Merge to Improve Water Quality
Dave Gamstetter, City of Cincinnati | Donna M. Murphy, US Forest Service Northeastern Area
In 2010 the Cincinnati Park Board (CPB) formed a partnership with the Metropolitan Sewer Department of Greater Cincinnati (MSDGC) to assist with the implementation of green solutions to meet the regulatory requirements of the consent decree using a triple bottom line approach. This presentation discusses how natural design solutions, BMPs, stormwater controls, and forests are being used to enhance green infrastructure and reduce stormwater flow on a watershed scale. The program is Project Groundwork.
Lessons learned from a Microsoft AI for Earth-WRI Collaboration
Learn more: https://www.wri.org/events/2020/06/webinar-ai-global-environmental-challenges
Green infrastructure: Reconnecting Agriculture and Communities
`
For more information, Please see websites below:
`
Organic Edible Schoolyards & Gardening with Children
http://scribd.com/doc/239851214
`
Double Food Production from your School Garden with Organic Tech
http://scribd.com/doc/239851079
`
Free School Gardening Art Posters
http://scribd.com/doc/239851159`
`
Increase Food Production with Companion Planting in your School Garden
http://scribd.com/doc/239851159
`
Healthy Foods Dramatically Improves Student Academic Success
http://scribd.com/doc/239851348
`
City Chickens for your Organic School Garden
http://scribd.com/doc/239850440
`
Simple Square Foot Gardening for Schools - Teacher Guide
http://scribd.com/doc/239851110
The Restoring Healthy Forests for Healthy Communities Act: Program Design and...
miami_dade_2008
1. Urban Ecosystem Analysis
Miami-Dade County UDB
and the City of Miami, Florida
May 2008
Report Contents
2 Project Overview
2 Background
4 Major Landcover Change Findings
5 2004-2006 Landcover Analysis
13 1996-2006 Landcover Change Analysis
15 Recommendations
16 About the Urban Ecosystem Analysis
Calculating the Value of Nature
2. Data from this project fits seamlessly into the County’s
Geographic Information System (GIS) and gives Miami-Dade
County and the City of Miami staff the ability to conduct their
own assessments for on-going planning decisions. From a
broader perspective, the urban ecosystem analysis offers coun-
ty leaders a way to strengthen the connections between urban
and natural systems.
Background
Miami-Dade County is part of the Everglades ecosystem which
stretches from the Kissimmee River south to Florida Bay. This
unique US Ecoregion is characterized by its flooded grasslands
and rich wildlife that resides within this natural ecosystem.
The county is home to the Everglades and Biscayne National
Parks as well as providing thriving agricultural and tourism
industries. The natural areas within the County are critical for
recharging the Biscayne aquifer, south Florida’s sole source of
drinking water.
The County is also subject to annual tropical storms and hurri-
canes, destroying property and the very green infrastructure
that protects its shorelines. Humans have further changed the
land with drainage projects, waterway channels, and agricul-
ture practices. Since the County is located in a unique geo-
graphical area, surrounded by major water bodies and a water
table that sits just a few feet below ground, land is particularly
susceptible to flooding from major rain events and storm surge.
Urban development has exacerbated flooding in some cases to
the detriment of people and property. Efforts by Miami-Dade
County to address the highly impacted flooded communities
within its jurisdiction have been ongoing since 1991 with the
creation of its Stormwater Utility to fund Capital Improvement
Projects designed to reduce stormwater runoff impacts.
A third major impact on the County’s urban forest has been
the trees removed as part of the eradication program for citrus
canker, a highly contagious bacterial disease that causes pre-
mature leaf and fruit drop. The state instituted an eradication
program in 1995 to remove infected trees, as well as healthy cit-
rus within the susceptible range. An estimated 466,000 trees
have been removed within Miami-Dade County (Florida Dept.
of Agriculture). Hurricane Wilma may have spread the disease
to an estimated 168,000-220,000 acres of commercial citrus
statewide and additional mortality of citrus trees in urban areas
may occur in the near future. The USDA deemed eradication
was no longer possible and the removal program was stopped
2
Project Overview
The local agencies were concerned that recent losses in tree
canopy cover due to hurricanes, citrus canker eradication, and
urban development had a negative impact on air and water
quality and stormwater runoff mitigation. The City of Miami
and Miami-Dade County engaged American Forests to con-
duct an Urban Ecosystem Analysis to quantify changes in land-
cover and the resulting impacts on ecosystem services green
infrastructure provides. With additional funding provided by
the State of Florida Division of Forestry, American Forests con-
ducted an Urban Ecosystem Analysis of 447 square miles with-
in the Miami-Dade County Urban Development Boundary
(UDB) line. The City of Miami (48 sq. miles) was included
within this larger study area.
The findings show that the loss of vegetative landcover over
the last decade decreased the air and water benefits the land-
cover provided. The loss of tree cover between 2004 and 2006,
during a very active hurricane period exacerbated the trend of
canopy loss. This study quantified the landcover changes due
to urban development and hurricanes and their ecological
impacts. The evidence presented along with the data and tools
included in this project will provide the City and County’s lead-
ers with the rationale and the capacity to better integrate natu-
ral systems into future policy decisions.
By investing in Miami-Dade County’s urban tree cover—this
natural capital also saves money managing air and water, helps
meet environmental regulations and fulfills the environmental
protection stipulated in the Miami-Dade County Compre-
hensive Development Master Plan (CDMP) and in the City of
Miami Tree Master Plan.
The Urban Ecosystem Analysis in this study analyzed the ecol-
ogy of landcover at two scales and spanned two time periods.
The 2004-2006 assessment used high resolution (1 meter pixel
resolution), digital data to measure changes in landcover when
Hurricanes Katrina and Wilma battered the County. The data
resolution was sufficient to visually distinguish between tree
canopy loss due to hurricane damage and development.
The second assessment measured landcover changes using
moderate resolution (30 meter pixel resolution) from Landsat
satellite imagery taken in 1996 and 2006. This analysis provid-
ed a ten year trend of tree loss and urban gain, most likely due
to development. While the resolution of Landsat data is too
coarse for analyzing district or neighborhood scale areas, this
temporal analysis can also be a good predictor of future devel-
opment trends if current development policies continue.
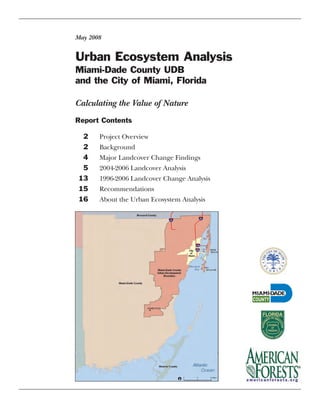
Regional Ecosystem Analysis: Miami Dade County and the City of Miami, Florida
Footnote: American Forests conducted an initial Urban Ecosystem Analysis (UEA) of unincorporated Dade County (townships that are at least 50% unincor-
porated) in 1996. The methodology used aerial imagery and site sampling to extrapolate landcover composition and ecological benefits for the entire study area.
This methodology has been updated using much more sophisticated multi-spectral satellite imagery and updated GIS technology. Because of the differences in
study area and methodology the original study does not compare to this current one.
3. 3
in 2006 (FL Dept of Agriculture and Conservation Services
press release 1/11/06) (see maps on pages 7 and 13).
Urban forests provide enormous environmental benefits—
among them improving air and water quality and slowing
stormwater runoff. Miami-Dade County is indicative of tree
canopy decline trends seen in many U.S. metropolitan areas
over the last few decades. American Forests has analyzed the
tree cover in more than a dozen metropolitan areas and docu-
mented changes. Over the last 15 years, naturally forested areas
of the country located east of the Mississippi River and in the
Pacific Northwest, have lost about 25% canopy cover while
urban surfaces increased about 20%. American Forests recom-
mended that all metropolitan areas analyzed increase tree
cover. Communities can offset the ecological impact of land
development by planting trees and utilize their natural capaci-
ty to clean air and water and slow stormwater runoff.
American Forests developed the Urban Ecosystem Analysis so
that communities could:
Measure tree canopy and quantify changes over time
Quantify their ecological benefits and calculate their dollar
value
Communicate the positive impacts urban ecosystems have
on reducing built infrastructure costs, while increasing envi-
ronmental quality
Use the GIS-based tools and data provided with this project
to incorporate trees and other vegetative landcover into con-
servation and land use planning
Adopt policies that maximize the use of natural systems into
urban development, thereby building resiliency into devel-
opment and natural disasters.
Trees: The Green Infrastructure
The physical framework of a community is called its infrastruc-
ture. Green infrastructure includes vegetation and their com-
plex interactions with soil, air and water systems. As defined in
this project, green infrastructure categories are tree canopy,
open space/grass, bare soil, and water. Green infrastructure is
porous, allowing water to soak into soil which naturally filters
pollutants before entering the watertable. Green infrastructure
is a natural system that provides many environmental benefits
to a community including slowing stormwater runoff, improv-
ing water quality, protecting soil from erosion, improving air
quality, and storing atmospheric carbon.
Gray infrastructure is impervious, forcing water to runoff
which must be managed and cleaned before entering rivers.
Examples of gray infrastructure typically found in urban areas
include buildings, roads, utilities, and parking lots. While both
gray and green infrastructure are important in a city, commu-
nities that foster green infrastructure and integrate natural sys-
tems wherever possible are not only more attractive, they pro-
duce fewer pollutants and are more cost effective to operate
(Building Greener Neighborhoods: Trees as Part of the Plan,
HomeBuilder Press; 1995).
Green infrastructure is important in an urban environment
because it offsets the negative effects of carbon in the atmos-
phere. Excess carbon is released when fossil fuels like coal and
gasoline are burned to release energy and that carbon, in the
form of carbon dioxide-CO2-a greenhouse gas, blankets the
earth and causes temperatures to rise. By reducing fossil fuel
consumption and the activities that release greenhouse gases;
tree planting becomes one way to help slow global warming.
Using Satellite Imagery and GIS to Measure Green and Gray
Infrastructure
While local governments commonly use geographic informa-
tion systems (GIS) to map and analyze their gray infrastruc-
ture, they typically have not integrated trees and other
elements of the green infrastructure. Reasons for this include
1) the lack of means to calculate the ecological and economic
value of trees and other environmental features, and 2) the
lack of a data set to readily use this information in existing GIS.
This project addresses both of these impediments. Calculating
the ecosystem services provided by tree canopy cover is avail-
able from data provided by researchers with the U.S. Forest
Service, the Natural Resources Conservation Service, the
Environmental Protection Agency and Purdue University.
Different scales of satellite imagery are useful for determining
urban landcover and ecosystem benefits. The hurricane analy-
sis used 1 meter high-resolution satellite imagery taken in two
years. The 2004 image, a mosaic of several images collected
from November 2004-February 2005,was provided by South
Florida Water Management District; the March 2006 CIR
imagery was provided by Miami-Dade County and was resam-
pled to 1 meter resolution to match the 2004 data. The imagery
at this resolution is used to create a digital representation of a
County’s green infrastructure. This green data layer integrates
well with other County GIS data layers and the 2006 data can
be used for daily land use planning and management.
The Landsat satellite provided a ten year historic temporal
change trend. The imagery collected in 1996 and 2006 was clas-
sified into digital data sets with five landcovers for comparison:
tree canopy, open space/grass, urban, bare soil, and water.
The data, software tools, and training provided with this proj-
ect allow the County and City staff to conduct their own analy-
ses and connect landcover with the environmental benefits
they provide.
American Forests Report
4. 4
Major Landcover Change Findings
Tree canopy declined between 2004 and 2006 in the County’s
Urban Development Boundary. The loss was due primarily to
development and exacerbated by hurricane-related damage.
The analysis compared landcover changes from 2004 and
2006, during an active hurricane period and found a 1,900
acre (3%) loss in tree canopy, and a 780 acre (1%) loss in open
space. In 2006 the UDB had 18% tree canopy cover, 25% open
space and 41% impervious surface.
The greatest percentage of tree canopy loss was in the
northern part of the county due to Hurricanes Katrina and
Wilma. County Districts 1 and 4 lost the greatest percentage
of tree canopy measuring 171 acres (6%) and 320 acres
(8%) respectively.
The data also analyzed what type of landcover the tree loss
converted to. A visual inspection of the data observed
whether the tree canopy change was due to hurricane dam-
age or development. For example, tree canopy that
changed to bare soil indicated land clearing for develop-
ment, and bare soil that converted to impervious indicated
new development. Tree canopy also converted to impervi-
ous land cover. Overall 2,639 acres that converted to one of
these categories indicated development. In contrast, less
than half the area (1,230 acres of tree canopy) converted to
open space, which indicated loss was due to hurricane dam-
age. Examples of these landcover changes are on page 8.
Loss of tree canopy and open space between 2004 and 2006
has ecological consequences, because this loss of green infra-
structure means the County’s natural environment is less able
to provide ecosystem services for air, water, and carbon.
Trees improve air quality by removing nitrogen dioxide
(NO2), sulfur dioxide (SO2), carbon monoxide (CO),
ozone (O3) and particulate matter 10 microns or less
(PM10) in size. The Miami-Dade County area inside the
Urban Development Boundary’s (UDB) vegetative landcov-
er lost its ability to remove approximately 218,000 pounds
of air pollutants annually, valued at $550,000 per year.
Trees have a direct impact on the carbon footprint. Trees
help clean the air by storing and sequestering carbon in
their wood. Total storage and the rate at which carbon is
stored (known as sequestration) can be measured. The loss
of tree canopy inside the UDB equated to a loss in 83,000
tons of carbon stored in trees’ wood and a loss of 643
pounds of carbon sequestered annually.
Trees slow stormwater runoff, reducing peak flows and
decreasing the amount of stormwater storage needed.
There was a loss in stormwater retention capacity due to the
loss in tree canopy. Miami-Dade County uses Best
Management Practices (BMPs) to control stormwater
runoff and maintain water quality. The value of BMPs is
determined on a site by site basis and costs vary by land use
and technique used. In residential areas of the UDB, 13.7
million cubic feet of stormwater has been controlled using
BMPs at a value of $96 million. In commercial and industri-
al areas, 4.8 million cubic feet of stormwater was controlled
at a value of $52 million.
Regional Ecosystem Analysis: Miami Dade County and the City of Miami, Florida
City of Miami
2004-2006
Between 2004 and 2006 the City of Miami lost 127 acres
(3%) of tree canopy and 36 acres (1%) of open space
during this time period. Impervious surface increased
by 163 acres (1%). The greatest percentage of loss
occurred in District 5 (3.6%) followed by Districts 1 and
2 each with 3% loss.
As a result, Miami’s tree canopy lost its ability to remove
14,500 pounds of air pollutants annually, valued at
$36,500. The loss also reduced the ability of trees to
store 5,500 tons of carbon and sequester 43 pounds of
carbon annually.
Loss of tree canopy decreased the City of Miami’s natu-
ral capacity for water retention. Applying the same BMP
values for the City of Miami, in residential areas,
931,000 cubic feet of stormwater was controlled at a
value of $6.5 million. In commercial and industrial
areas, 182,000 cubic feet was controlled, at a value of $2
million.
1996-2006
Between 1996 and 2006 Miami lost 15 acres of tree
canopy (4%) and 13 acres of open space (2%) and
gained 10 acres of urban land (6%) and 11 acres of bare
soil (7%).
Miami’s tree cover lost its ability to remove 1,600 lbs of
air pollutants annually at a value of $4,000 and there
was a loss of 620 tons of carbon storage and 5 lbs of car-
bon sequestered annually.
The city had a 247,000 cubic foot loss in stormwater stor-
age capacity.
Of eight quantified water pollutants, the pollutant load-
ing of each worsened by .1% to .3%.
Note: The two data sets are at different scales and time periods so that the
numbers will be different. The 2004-2006 data is more detailed and thus
better reflects land cover figures provided.
5. 5
2004-2006 Landcover Analysis
A few hours before landfall in south Florida on August 25th,
2005 Hurricane Katrina strengthened to become a category 1
hurricane. Landfall occurred between Hallandale Beach and
North Miami Beach, Florida, with wind speeds of approxi-
mately 80 mph. An analysis by NOAA’s Climate Prediction
Center reported that parts of the region received more than 15
inches of rainfall which caused localized flooding and damage
to property and tree canopy. Just two months later, Hurricane
Wilma slammed into Palm Beach County on October 25, 2005;
its damage extended into Miami Dade County.
Miami-Dade County and the City of Miami wanted to deter-
mine the extent of tree canopy loss attributable to recent hur-
ricane damage within the Urban Development Boundary and
quantify the environmental impacts the loss has had on air
and water. An analysis was conducted using satellite imagery
taken prior to and after Hurricane Katrina.
The South Florida Water Management District provided the
2004 color 1 meter infrared imagery that was taken between
November 2004 and February 2005 with an ADS 40 digital
camera. The 2006 imagery was provided by Miami-Dade
County with a CIR imagery collect in March. The imagery was
resampled to 1 meter to match the earlier imagery resolution.
Both sets of imagery were then classified into five landcovers:
tree canopy, impervious, open space, bare soil, and water.
Table 1 details the change in these five landcovers of the
County within the UDB over the two year period. There was a
3% decline in tree canopy representing a loss of 1900 acres
inside the UDB. The County also lost 780 acres of open space
and 436 acres of bare soil. The County increased its impervi-
ous land by 2,900 acres. Table 2 details landcover changes
within the City of Miami.
Loss of Air Quality Ecosystem Services
The loss of pervious landcover (trees, open space, and bare
soil) and increase in impervious surface (buildings, roads,
etc.) means that the natural landscape provided less ecosys-
tem services to the community. Table 3 details the loss in air
and carbon ecosystem services in both the County within the
UDB and in Miami. The data is further sub-divided into 13
county districts and 5 city districts.
For the County, the loss means that 218,000 pounds of air pol-
lutants valued at $550,000 annually were not removed. The dol-
lar value is calculated based on externality costs—these are costs
borne to society as a negative impact of the additional air pollu-
tion. Externality values are established by State’s Public Service
Commissions and costs associated with respiratory illness and
hospital stays are factored into the cost calculation. Also, there
was a loss in carbon storage of 83,000 tons and 643 fewer pounds
of carbon are sequestered annually—offsetting atmospheric
increase in carbon dioxide, a contributor to global warming.
American Forests Report
Temporal landcover changes between 1996 and 2006 indicate
significant tree canopy loss due to development
The analysis using Landsat satellite data revealed that with-
in the UDB there was a 17% and a 9% decline in tree
canopy and open space respectively, while there was a 6%
and 7% increase in urban areas and bare soil respectively.
During this time, the County lost 6,800 acres of tree canopy
and 5,700 acres of open space. There was a concurrent gain
of 10,000 acres of urban land. Since the most dramatic pat-
tern of change occurred along the western perimeter of the
UDB (see page 10), these changes were most likely due to
development.
The 1996-2006 decline trend of Miami-Dade County vegeta-
tive cover and increase in urban areas within the UDB has
ecological consequences for today but also ecological opportu-
nities for the future
Within the County’s UDB there was a loss of 131 million
cubic feet of stormwater retention capacity during this time
period due to tree canopy decline.
During the ten year time frame of this study, Miami-Dade
County tree cover within the UDB lost its ability to remove
approximately 767,000 pounds of air pollutants annually,
valued at $1.9 million per year.
The loss in tree canopy inside the UDB since 1996, equates
to a loss in 291,000 tons of carbon stored in trees’ wood and
a loss of 2,300 pounds of carbon sequestered annually.
Tree roots absorb water pollutants; eight of which can be
measured: Biological Oxygen Demand, Cadmium, Copper,
Lead, Nitrogen, Phosphorus, Suspended Solids, and Zinc.
This study calculated that each worsened by between 1%
and 5% because trees were removed from the land. These
percentages are calculated from the stormwater runoff
changes (see page 13).
Hurricane Katrina hit
Miami-Dade County on
August 25th, 2005.
Hurricane Wilma passed
through Palm Beach County
on October 25th, 2005; it’s
damage extended into Miami-
Dade County.
6. 6
Regional Ecosystem Analysis: Miami Dade County and the City of Miami, Florida
2006 Percent
2004 2006 Acres of Total Percent
Landcover Acres Acres Change Landcover Change
Trees 56,681 54,780 -1,901 18% -3%
Open space/Grass 79,056 78,279 -777 25% -1%
Bare Soil 6,304 5,868 -436 2% -7%
Impervious 122,406 125,300 2,894 41% 2%
Water 44,879 45,101 222 15% <1%
Total Acres 309,326 100%
Table 1: Miami Dade County UDB 2004-2006
Landcover Changes
2006 Percent
2004 2006 Acres of Total Percent
Landcover Acres Acres Change Landcover Change
Trees 5,047 4,920 127 21% -3%
Open space/Grass 3,824 3,788 -36 16% -1%
Bare Soil 174 173 1 <1% <1%
Impervious 14,097 14,260 163 61% 1%
Water 282 287 5 1% 2%
Total Acres 23,372 23,371
Note: The city totals are calculated from adding the UEA results of each District
Table 2: City of Miami 2004-2006
Landcover Changes
Loss of Air
Tree % tree Loss of Air Pollution Loss of Loss of
2004 Tree 2006 Tree canopy canopy Pollution Removal Carbon Carbon
Area Canopy Canopy change change Removal Value Stored Sequestered
Miami Dade UDB acres acres acres acres lbs. annually dollar value tons lbs. annually
District 1 20,773 2,652 2,481 -171 -6.4% -19,409 -$49,010 -7,377 -57
District 2 16,114 2,475 2,358 -117 -4.7% -13,217 -$33,375 -5,024 -39
District 3 16,354 2,166 2,088 -78 -3.6% -9,042 -$22,832 -3,437 -27
District 4 16,000 4,017 3,709 -308 -7.7% -36,181 -$91,362 -13,753 -107
District 5 8,210 1,345 1,303 -42 -3.1% -5,069 -$12,800 -1,927 -15
District 6 16,114 2,475 2,358 -117 -4.7% -13,217 -$33,375 -5,024 -39
District 7 26,757 11,088 10,935 -153 -1.4% -17,970 -$45,375 -6,830 -53
District 8 40,001 9,814 9,553 -261 -2.7% -30,129 -$76,079 -11,452 -89
District 9 33,368 4,960 4,819 -141 -2.8% -15,980 -$40,351 -6,074 -47
District 10 15,736 2,992 2,876 -116 -3.9% -13,161 -$33,233 -5,003 -39
District 11 20,602 3,499 3,364 -135 -3.9% -15,241 -$38,484 -5,793 -45
District 12 34,935 5,664 5,443 -221 -3.9% -25,110 -$63,404 -9,544 -74
District 13 15,411 2,093 2,058 -35 -1.7% -3,958 -$9,995 -1,504 -12
TOTAL 280,375 55,240 53,345 -1,895 -217,684 -$549,675 -82,742 -643
Note: Areas of each District that contain Biscayne Bay or the Atlantic Ocean were excluded from this analysis
City of Miami
District 1 4,240 635 616 -19 -3.0% -2,131 -$5,381 -810 -6
District 2 7,290 2,271 2,199 -72 -3.2% -8,056 -$20,342 -3,062 -24
District 3 2,717 495 489 -6 -1.2% -679 -$1,714 -258 -2
District 4 4,264 889 883 -6 -0.7% -686 -$1,733 -261 -2
District 5 4,864 718 693 -25 -3.5% -2,908 -7,343 -1,105 -9
TOTAL 23,375 5,008 4,880 -128 -14,460 -$36,513 -5,496 -43
Note: Areas of each District that contain Biscayne Bay or the Atlantic Ocean were excluded from this analysis
Table 3. UDB Loss of Air and Carbon Ecosystem Services
City of Miami
Between 2004 and 2006 the City of Miami lost 3% of its tree canopy representing 127 acres (Table 2). The City also lost 36
acres of open space and gained 163 acres of impervious surface. The loss means that 14,000 pounds of air pollutants valued
at $36,500 were not removed. There was a loss of 5,500 tons of carbon storage and 43 fewer pounds of carbon are
sequestered annually.
7. 7
American Forests Report
County and City Tree
Loss by District
Tree canopy loss within the Urban
Development Boundary was subdivided by
County and City Districts (see page 8).
Note that County Districts that extend
beyond the UDB are not included in this
study. The district colors in the graphic
represent the percent loss of tree canopy
between 2004 and 2006. County Districts 1
and 4 had the highest percentage of loss,
with 6% and 8% respectively. A visual
inspection of the data suggests that hurri-
cane damage was greatest in these districts
which were in the path of Hurricane
Katrina and closest to the coast, where
windspeed was likely the strongest.
Hurricanes typically lose windspeed as they
move in-land and tree loss due to hurri-
cane damage appears consistent with the
graphic depicting tree loss. The portion of
Districts 4, 8 and 12 within the UDB lost
the greatest acreage of tree canopy.
Of particular interest is to observe what the
tree canopy converted to. The pie charts
within each district represent what the tree
canopy loss was replaced with. While the
analysis of data can’t directly distinguish
the cause of tree loss—a visual inspection
of the change in land cover offers some
indicators. A visual comparison (see page
8) indicated that tree canopy replaced by
bare soil was typically land clearing as part
of pre-development. Likewise, water area
increased indicating development in
process. Tree canopy replaced by impervi-
ous was typically development. In contrast,
a visual inspection of the data showed that
tree canopy replaced by open space was
due to hurricane damage. Thus, by quanti-
fying what tree canopy was replaced with
provided a good indicator of its cause of
loss. During the two year time period more
than twice the acreage of tree canopy was
replaced by either bare soil or urban
(2,639 acres) compared to trees replaced
by open space (1,230 acres). While
Hurricane Katrina exacerbated tree loss
inside the UDB, development was the pri-
mary cause of tree canopy loss.
City of Miami
Since the city had been mostly developed prior to this time frame, overall tree
loss was less than in the UDB. A visual inspection of the imagery shows that
tree canopy was primarily lost to urban development. The proportion of
change to urban, open space, bare soil, and water are noted in each District’s
pie chart.
2004-2005 Citrus Tree loss due to Citrus Canker
This map represents 2004-2005 data provided by the Florida Department of Agriculture. It repre-
sents the incidence of citrus tree removal during the state eradication program. Tree loss due to cit-
rus canker was included 2004-2006 high resolution data analysis.
8. 8
Regional Ecosystem Analysis: Miami Dade County and the City of Miami, Florida
Tree Canopy Loss by Districts 2004-2006
Tree canopy loss within the Urban Development Boundary was subdivided
by County and City Commission Districts. The pie charts within each dis-
trict represent what the tree canopy loss was replaced with. A visual inspec-
tion of the change in land cover offers some indicators: tree canopy
replaced by bare soil was typically land clearing as part of pre-development;
water area increased formed during development; tree canopy replaced by
impervious was typically development; and tree canopy replaced by open
space was mostly likely due to hurricane damage. While Hurricane
Katrina exacerbated tree loss inside the UDB, development was the primary
cause of tree canopy loss.
City of Miami
9. 9
American Forests Report
2006 Landcover
This map represents Miami-Dade County landcover data taken
from high resolution satellite imagery and then classified into five
different landcover classes. These data are used with CITYgreen
software to calculate the ecological and economic benefits that tree
canopy provides in slowing stormwater runoff, improving air and
water quality and storing and sequestering atmospheric carbon.
10. 10
Landcover Changes
A visual inspection of the high resolution imagery for changes in land cover can reveal the cause of tree canopy loss from either
hurricane or development. The pie charts inset in each image indicate the relative changes in landcover within this view.
Regional Ecosystem Analysis: Miami Dade County and the City of Miami, Florida
In the 2004 image (left) a fruit grove in
County District 8 dominates landcover with
some bare soil indicating pre-development of
a road. In the 2006 image (right), much of
the tree canopy is replaced with homes and
roads.
In the 2004 image (left) an existing golf
course in County District 1 displays tree
canopy. In the 2006 image (right) only the
tree canopy is affected, indicating hurricane
damage.
11. 11
American Forests Report
Commercial and
Commercial and Industrial Stormwater
Commerical and 2004 Tree Canopy 2006 Tree Canopy Tree canopy change Industrial Stormwater BMP Value
Industrial Land in landuse category in landuse category in landuse category BMP Value @ $11 per cu. ft
Miami Dade UDB acres acres acres acres cu. ft. dollar value
District 1 2,554 137 117 -20 566,940 $6,236,340
District 2 2,349 102 97 -5 173,113 $1,904,244
District 3 1,408 89 87 -2 108,025 $1,188,276
District 4 1,061 104 88 -16 293,737 $3,231,105
District 5 1,001 94 92 -2 41,417 $455,587
District 6 1,756 157 154 -3 116,308 $1,279,384
District 7 1,358 152 148 -4 82,184 $904,027
District 8 1,578 109 105 -4 320,425 $3,524,673
District 9 2,052 102 99 -3 677,381 $7,451,189
District 10 748 65 64 -1 146,491 $1,611,400
District 11 866 72 58 -14 565,602 $6,221,621
District 12 8,188 594 538 -56 1,512,059 $16,632,648
District 13 1,991 134 134 0 149,936 $1,649,291
TOTAL 26,910 1,911 1,781 -130 4,753,618 $52,289,785
City of Miami
District 1 614 35 34 -1 19,277 $212,045
District 2 725 77 72 -5 91,588 $1,007,466
District 3 315 25 25 0 5,841 $64,256
District 4 347 24 23 -1 13,420 $147,619
District 5 584 34 33 -1 52,109 $573,197
TOTAL 2,585 195 187 -8 182,235 $2,004,583
Table 4. UDB Loss of Commerical and Industrial Stormwater Ecosystem Services
In the 2004 image (left) an existing resi-
dential neighborhood in County District 4
shows trees, which in the 2006 image
(right) is greatly affected by tree loss indicat-
ing hurricane damage.
12. Regional Ecosystem Analysis: Miami Dade County and the City of Miami, Florida
12
Stormwater Ecosystem Services
Trees slow stormwater runoff by intercepting water on leaves,
branches, and absorbing it through root systems. The loss of
tree canopy increases the amount of stormwater that must be
managed. Florida is unique in that it has a very shallow water
table and is surrounded by water—the Atlantic Ocean and the
Everglades, thus all the water drains into waterbodies or
through percolation into the watertable. There is also mount-
ing concern for rising sea levels due to global warming, which
would further strain stormwater management efforts and cost.
The Miami-Dade County Comprehensive Development
Master Plan’s Conservation Element “provides for the conser-
vation, environmentally sound use, and protection of all
aquatic and upland ecosystems and natural resources, and
protects the functions of the aquifer recharge areas and natu-
ral drainage features in Miami-Dade County”.
In urban areas, stormwater engineers have employed water
quality best management practices (BMPs) into the design of
drainage and water pollution prevention facilities. Design
techniques to manage storm water runoff include French
drains, wet detention, dry detention, swales, drainage wells,
and pollution control structures. Systems are designed to infil-
trate either “first-in” stormwater runoff, a 5-year/24 hour
storm, or a 10-year/24 hour storm.
In this study a 5-year/24 hour storm rainfall figures were used
along with County-provided BMP dollar values for residential
($7 per cubic ft. average) and commercial/industrial areas
($11 per cubic ft. average). Tables 4 and 5 detail the BMP val-
ues for handling stormwater runoff inside the UDB and in
Miami. Equating tree canopy loss to stormwater management,
the County manages 4.7 million cubic feet of stormwater in
commercial, and industrial areas, valued at $52 million and
13.7 million cubic feet of stormwater valued at $96 million in
residential areas. These values are further sub-divided by coun-
ty and city districts. Protecting and enhancing forest canopy
along with employing BMP techniques offer a two-pronged
approach to stormwater management.
City of Miami
The city manages 182,000 cubic feet of stormwater in com-
mercial, and industrial areas valued at $2 million and
931,000 cubic feet of stormwater valued at $6.5 million in
residential areas.
Residential Stormwater
2004 Tree Canopy 2006 Tree Canopy Tree canopy change Residential Stormwater BMP Value
Miami Dade UDB Residential Land in landuse category in landuse category in landuse category BMP Value @ $7 per cu. ft
Residential Land acres acres acres acres cu. ft dollar value
District 1 7,574 1,298 1,238 -60 514,988 $3,604,917
District 2 68,890 1,607 1,550 -57 611,020 $4,277,141
District 3 5,335 1,317 1,289 -28 690,976 $4,836,829
District 4 6,119 1,603 1,497 -106 1,274,002 $8,918,015
District 5 3,476 782 766 -16 237,165 $1,660,158
District 6 6,431 1,965 1,943 -22 334,127 $2,338,887
District 7 12,889 5,991 5,927 -64 972,067 $6,804,468
District 8 17,087 4,404 4,345 -59 2,707,496 $18,952,474
District 9 9,588 1,122 1,042 -80 4,029,856 $28,208,992
District 10 7,667 1,841 1,785 -56 772,471 $5,407,296
District 11 7,534 1,463 1,428 -35 576,092 $4,032,647
District 12 5,138 789 749 -40 671,513 $4,700,589
District 13 6,315 1,120 1,104 -16 304,666 $2,132,659
TOTAL 164,043 25,302 24,663 -639 13,696,439 $95,875,072
City of Miami
District 1 1,627 361 354 -7 106,674 $746,719
District 2 2,570 1,072 1,044 -28 529,148 $3,704,039
District 3 1,347 306 302 -4 58,549 $409,842
District 4 2,496 657 655 -2 67,916 $475,413
District 5 1,827 409 401 -8 168,490 $1,179,430
TOTAL 9,867 2,805 2,756 -49 930,777 $6,515,443
Table 5. UDB Loss of Residential Stormwater Ecosystem Services
13. American Forests Report
13
1996-2006 Landcover Change
Analysis using Landsat Data
American Forests classified Landsat TM 30 meter pixel satel-
lite images from 1996 and 2006 to show the change in land-
cover inside the Urban Development Boundary line over a 10
year period (see page 14). There was a 17% loss in tree canopy
and a 9% loss in open space. At the same time there was a 6%
increase in urban areas and 7% in bare areas. Tree loss
occurred primarily in the western perimeter of the County
within the UDB, in Districts 9, 11, and 12 as indicated in red in
the graphic. The pattern of tree loss is most likely the result of
development and the citrus canker eradication program.
Due to the landcover changes, the County lost $1.9 million in
annual air pollution removal value, and 291,000 tons of car-
bon storage and 2,300 lbs of sequestration annually.
The temporal analysis provides valuable public policy infor-
mation showing general trends in landcover changes. If land
development policies and population increase trends remain
unchanged, the trend could be extrapolated into the future.
City of Miami
In Miami there was a 4% and 2% decline in tree canopy
and open space respectively. Tree loss was apparent in two
locations: in District 2, along the coast line and at the
northern tip of Virginia Key, and along the western edge
of District 1. There was very little change in urban areas;
not surprising since the city was built out prior to 1996.
Miami lost $4,000 in annual air pollution removal and 600
tons of carbon storage and 5lbs. of annual carbon seques-
tration. Stormwater values using BMP values could not be
calculated at this scale.
1996-2005 Citrus Tree loss due to Citrus Canker
This map represents 1996-2005 data provided by the Florida Department
of Agriculture. It represents the incidence of citrus tree removal during the
state eradication program. The Landsat data is too coarse to pick up indi-
vidual incidences of tree loss. However, tree loss due to citrus canker was
included in the finer, high resolution data, see page 7.
14. American Forests classified Landsat TM 30 meter pixel satellite images from 1996 and 2006 to show the change in landcover inside the Urban
Development Boundary line. Tree loss occurred primarily in the western perimeter of the County within the UDB as indicated in red in the graphic. The
pattern of tree loss is most likely the result of development. The loss of tree canopy in Miami appeared to concentrate in three locations, in City District 2
along the coast and in District 1, along the western border where exotic vegetation removal occurred. There was very little change in the City of Miami’s
urban areas; not surprising since the city was built out prior to 1996.
14
15. 15
American Forests Report
Recommendations
In summary, this project has quantified the loss of the City of
Miami and Miami-Dade County’s green infrastructure within
the Urban Development Boundary line. The loss, measured
over a ten year and a recent two year period, primarily appears
due to development and is exacerbated by hurricanes and cit-
rus canker eradication. As the County and City plan for the
future, American Forests recommends that the data and
CITYgreen software provided with this project be used to run
landcover scenarios, establish Countywide tree canopy goals,
quantify the progress made with current and new tree initia-
tives, and educate the public about the value of protecting and
enhancing green infrastructure.
Use the green data layer and CITYgreen to document the
ecosystem services in fulfilling Countywide strategies to pro-
tect environmental quality.
Share the green data layer provided with this project
with County departments and local municipalities
Use the modeling capabilities of CITYgreen software
for planning. Test the impacts of changing tree
canopy, impervious surfaces, and other land covers
under different development scenarios.
For example, in County District 1, we calculated the stormwa-
ter benefits of increasing tree canopy in hurricane-damaged
areas. District 1 residential land was modeled so that tree
canopy increased from 16% to 25%, replacing open space.
Using BMP values of $7/cu. ft the additional tree canopy pro-
vided 17 million cu. ft of natural stormwater retention, valued
at $119 million savings. In commercial and industrial areas of
District 1, we increased tree canopy from 4.6% to 10%. Using
$11/cu. ft., additional tree canopy provided 437,000 cu. ft of
natural stormwater retention valued at $4.8 million savings.
Establish Tree Cover Goals
Establish an overall tree canopy goal for Miami-Dade
County and City of Miami. Establish goals for specific land
use categories. These goals are based on achieving environ-
mental requirements for air and water. Incorporate these
goals into planning policies and test achieving them with
the UEA process. Maintain those targets as the County
develops over time.
Use American Forests’ canopy goals as a guide, but the
County and City should develop its own goals and timeframe
to meet the needs of their unique community.
• 40% tree canopy countywide
• 50% tree canopy in suburban residential
• 25% tree canopy in urban residential
• 10-15% tree canopy in the urban core; greater in areas
adjacent to waterbodies.
Local communities should adopt countywide goals to be
consistent across political boundaries. A lack of consistency
would make local compliance of achieving tree canopy
goals very difficult.
Use the green data layer and CITYgreen to document the
ecosystem services provided by existing tree programs and
new strategies to protect environmental quality.
Share the green data layer provided with this project with
County departments and local municipalities
Use the modeling capabilities of CITYgreen software for
planning. Test the impacts of changing tree canopy, imper-
vious surfaces, and other land covers under different devel-
opment scenarios.
Increase public awareness of the direct relationship between
environmental quality and tree canopy.
Use analysis findings in popular media to demonstrate and
educate the public about the importance of conserving and
enhancing the urban forest.
Incorporate CITYgreen schools program into public
schools to increase awareness of environmental issues, by
teaching practical applications of GIS, math, science and
geography. Curriculum is available through American
Forests.
About the Urban Ecosystem Analysis
American Forests Urban Ecosystem Analysis is based on the
assessment of “ecological structures”—unique combinations
of land use and land cover patterns. Each combination per-
forms ecological functions differently and is therefore
assigned a different value. For example, a site with heavy tree
canopy provides more stormwater reduction benefits than one
with lighter tree canopy and more impervious surface.
Data Used
For the 1996-2006 temporal change analysis, landcover was
derived from the Landsat 30 meter pixel resolution imagery.
The 1996 Landcover was derived from NOAA’s Coastal Change
Analysis Program, which is a refinement of the 1992 National
Land Cover Database from 30 meter LANDSAT imagery and pro-
duced by the Multi-Resolution Land Characteristics Consortium.
See http://www.csc.noaa.gov/crs/lca/ for more information.
The landcover was divided into five categories (water, trees,
urban, open space, and bare soil). The 2006 Landcover was
derived from 30 meter LANDSAT imagery acquired for Miami-
Dade County. It was classified using the Anderson Level 1 classifi-
cation scheme using a pixel-based classification methodology and
See5 statistical modeling and CART tools.
16. CITYgreen water quality model. This model estimates the
change in the concentration of the pollutants in runoff dur-
ing a typical storm event given the change in the land cover
from existing trees to a no tree condition. This model esti-
mates the event mean concentrations of nitrogen, phospho-
rus, suspended solids, zinc, lead, copper, cadmium,
chromium, chemical oxygen demand (COD), and biological
oxygen demand (BOD). Pollutant values are shown as a per-
centage of change.
UFORE Model for Air Pollution: CITYgreen®
uses formulas from a
model developed by David Nowak, PhD, of the USDA Forest
Service. The model estimates how many pounds of ozone, sulfur
dioxide, nitrogen dioxide, and carbon monoxide are deposited
in tree canopies as well as the amount of carbon sequestered.
The urban forest effects (UFORE) model is based on data col-
lected in 55 U.S. cities. Dollar values for air pollutants are based
on averaging the externality costs set by the State Public Service
Commission in each state. Externality costs, are the indirect costs
to society, such as rising health care expenditures as a result of air
pollutants’ detrimental effects on human health.
Acknowledgements for this Study
We gratefully acknowledge the funding support provided by
Miami-Dade County, the City of Miami, and Urban and
Community Forestry grant funds received through the State of
Florida Division of Forestry. We appreciate the information
provided by the Florida Department of Agriculture and the
South Florida Water Management District in conducting this
study.
For More Information
American Forests, founded in 1875, is the oldest national non-
profit citizen conservation organization. Its three centers—
Global ReLeaf, Urban Ecosystem Center, and Forest Policy
Center—mobilize people to improve the environment by
planting and caring for trees.
American Forests’ CITYgreen®
software provides individuals,
organizations, and agencies with a powerful tool to evaluate devel-
opment and restoration strategies and impacts on urban ecosys-
tems. American Forests offers regional training, teacher
workshops and technical support for CITYgreen®
and is a certified
ESRI developer and reseller of ArcView and ArcGIS products.
The South Florida Water Management District provided the
2004 color 1 meter infrared imagery taken between November
2004 and February 2005 with an ADS 40 digital camera. The
2006 imagery was provided by Miami-Dade County with a CIR
imagery collect in March. The imagery was resampled to 1
meter to match the earlier imagery resolution.
The late date imagery, taken in March 2006 is CIR imagery
resampled to 1 meter to match the early date imagery. This
imagery was provided by Miami-Dade County. It was classified
using the Anderson Level 1 classification scheme using a pixel-
based classification methodology and See5 statistical modeling
and CART tools. The landcover was divided into five categories
(water, trees, impervious, open space, and bare soil).
Analysis Formulas
Urban Ecosystem Analyses were conducted using CITYgreen
software. CITYgreen for ArcGIS used the raster data land
cover classification from the high-resolution imagery for the
analysis. To comply with the ecology of their landcover char-
acteristics, wetlands were classified as water when calculating
stormwater runoff and were classified as a particular landcov-
er (trees, openspace, water, or bare soil) when calculating air
quality and carbon benefits.
The following formulas are incorporated into CITYgreen
software.
TR-55 for Stormwater Runoff: The stormwater runoff calcula-
tions incorporate volume of runoff formulas from the Urban
Hydrology of Small Watersheds model, (TR-55) developed by
the US Natural Resources Conservation Service (NRCS), for-
merly known as the US Soil Conservation Service. Don
Woodward, P.E., a hydrologic engineer with NRCS, cus-
tomized the formulas to determine the benefits of trees and
other urban vegetation with respect to stormwater manage-
ment. For greater accuracy, a stormwater analysis was con-
ducted for each Planning District and then values were added
together to provide stormwater runoff for the entire city.
L-THIA for Water Quality: Using values from the U.S.
Environmental Protection Agency (EPA) and Purdue
University’s Long-Term Hydrological Impact Assessment (L-
THIA) spreadsheet water quality model, The Natural
Resources Conservation Service (NRCS) developed the
American Forests, P.O. Box 2000, Washington D.C. 20013
Phone: 202/737-1944; Fax: 202/737-2457; Web: www.americanforests.org