- The document analyzes land cover changes in San Antonio, Texas between 2001-2006 using satellite imagery. It finds losses in tree canopy and open spaces/grasslands, and gains in urban areas.
- Specifically, the city of San Antonio lost 1,800 acres of tree canopy (3.4%) and 7,600 acres of open space (6.8%), while gaining 7,400 acres (5.8%) of urban area.
- The most dramatic changes occurred in the Edwards Aquifer Recharge Zone, which lost 3,200 acres of tree canopy (6%) and 4,400 acres of open space (10.7%) while gaining almost 6,000 acres (20.2%) of
Research paper PLANNING STRATEGIES FOR STORMWATER MANAGEMENT FOR URBAN AREAS:...Prerna Jasuja
With the growing population and increasing water
demand for various purposes in urban areas, the cities fall
prey to the water crisis and management issues which
include three components, namely freshwater supply,
wastewater treatment, and stormwater management. Urban
stormwater is surface runoff generated during any rain or
snowmelt. Stormwater management has shifted from being
a technical problem handled by engineers at water utilities to
close integration with urban planning in the USA, Singapore,
and China. This paper highlights such practices in these
three countries, taking one of their implemented examples. It
intends to discuss and analyze the integration within urban
plans of blue and green infrastructure and the artificial
drainage system in urban areas to maintain stormwater
quantity, quality, water security, and means to keep minimal
damage to nature post-urban development. Indian cities
have yet to address the incorporation of Stormwater
management with their spatial planning. The strategies
applied by the three countries can be used as a learning
a lesson in the Indian context.
Irrigation futures wasp, a planning and policy tool for sustainable urban i...Christina Parmionova
WASP: A planning and policy tool for sustainable urban irrigation
This article by Bhakti Devi featured in the Irrigation Australia Journal, Winter 2009, Volume 24, No. 2.
With urban areas across Australia feeling the effects of drought in the last few years, the response of many water utilities has been to implement water restrictions for urban green spaces, including domestic gardens, sporting ovals and grounds and other public open spaces. While restrictions do conserve water resources, this is at the cost of the quantity and quality of the urban green space and the associated social, economic and environmental benefits. Without a tool or framework for analysing existing urban irrigation demand and determining the water saving potential of various categories of urban green spaces, it is likely that water restrictions continue to be the preferred policy option for saving water.
City of Albuquerque, New Mexico - Municipal Forest Resource Analysis
`
For more information, Please see websites below:
`
Organic Edible Schoolyards & Gardening with Children
http://scribd.com/doc/239851214
`
Double Food Production from your School Garden with Organic Tech
http://scribd.com/doc/239851079
`
Free School Gardening Art Posters
http://scribd.com/doc/239851159`
`
Increase Food Production with Companion Planting in your School Garden
http://scribd.com/doc/239851159
`
Healthy Foods Dramatically Improves Student Academic Success
http://scribd.com/doc/239851348
`
City Chickens for your Organic School Garden
http://scribd.com/doc/239850440
`
Simple Square Foot Gardening for Schools - Teacher Guide
http://scribd.com/doc/239851110
In this presentation, the Stockholm Environment Institute presents are green infrastructure solutions to aid the resilience and sustainability of development of the Chindwin River Basin in Myanmar.
Forms of Water Supply, Conservation and use in Banigbe District, Municipality...IJAEMSJORNAL
Rural populations in underdeveloped countries like Benin have difficult access to safe drinking water. This research aims to study the forms of water supply, conservation and use in Banigbé district. The methodological approach revolves around data collection through documentary research; data processing and results analysis. It appears that 88.75% of the 80 households selected for the survey in Banigbé, use at-risk sources (rivers; Private PEA; traditional wells). Only 11.25% have access to water from conventional sources such as the National Water Society of Benin (SONEB) and the Drilling of Human Motric Pumps (FPM). 88.75% of those selected for the survey also said that they do not treat drinking water at any source. It is therefore necessary to improve the quality of the water to which the populations of Banigbé have access to, and this through the disinfection of water from at risk sources and the proliferation of village hydraulic equipment in the district of Banigbé.
Interesting project observed. Louisette Lanteigne assumes no liability for any inaccurate, delayed or incomplete information, nor for any actions taken in reliance thereon. All information should be verified independently before being used and relied on.
Presentation tries to look at the role and importance of water as a scarce and valuable commodity which needs to be preserved and conserved in the context of built environment
I"m a Web Developer,Wordpress Expert and Affiliate Marketer living in Bangladesh.I spend my days with my hands in many different areas of web development
Landscape Architecture Vision for Indian Residential ProjectAmir Mueller
Amir Mueller, Landscape Architecture in India, Resdiential Development in India, Landscape Architecture Vision, Landscape Planning, Reflecting Pools, Inspiration for Landscape Design, The Modern Garden, Genus Loci, Roads and Footpaths, Gardens and Public Spaces, Curvilinear Paths and Trails, wood decks and bridges, water gardens, Amphitheatre and Congregation, simple materials, planting to accenuate water's edge, www.amirmueller.com
Collaboration, Science, and Technology Merge to Improve Water QualityArbor Day Foundation
Collaboration, Science, and Technology Merge to Improve Water Quality
Dave Gamstetter, City of Cincinnati | Donna M. Murphy, US Forest Service Northeastern Area
In 2010 the Cincinnati Park Board (CPB) formed a partnership with the Metropolitan Sewer Department of Greater Cincinnati (MSDGC) to assist with the implementation of green solutions to meet the regulatory requirements of the consent decree using a triple bottom line approach. This presentation discusses how natural design solutions, BMPs, stormwater controls, and forests are being used to enhance green infrastructure and reduce stormwater flow on a watershed scale. The program is Project Groundwork.
Estimation of Biodiversity, Carbon Sequestration, and Canopy Cover of Street ...Emily Masse
Research study exploring relationship between carbon sequesteration, biodiversity, and canopy cover of the street trees in Abbotsford, British Columbia.
Value, Benefits, and Costs of Urban Trees
`
For more information, Please see websites below:
`
Organic Edible Schoolyards & Gardening with Children
http://scribd.com/doc/239851214
`
Double Food Production from your School Garden with Organic Tech
http://scribd.com/doc/239851079
`
Free School Gardening Art Posters
http://scribd.com/doc/239851159`
`
Increase Food Production with Companion Planting in your School Garden
http://scribd.com/doc/239851159
`
Healthy Foods Dramatically Improves Student Academic Success
http://scribd.com/doc/239851348
`
City Chickens for your Organic School Garden
http://scribd.com/doc/239850440
`
Simple Square Foot Gardening for Schools - Teacher Guide
http://scribd.com/doc/239851110
Above ground biomass and carbon stock estimation of Arroceros Forest Park "Th...Innspub Net
In an area where urbanization is rapidly growing, carbon is slowly sequestered which clogs the ozone layer. With forest biomass, carbon is easily sequestered and stored by trees. This research focuses on the potential carbon storage of the Arroceros Forest Park, one of the last lungs of the metropolis located in the heart of the National Capital Region, Manila, Philippines. Trees with ≥10 cm diameter at breast height (DBH) were inventoried, from two (2) hectare area of site. These trees were used in the estimation of the biomass and carbon stock. The Power-Fit Equation from Banaticla (insert year), = 0.342 (DBH (exp (0.73))) was used in the study. Results showed that Swietenia macrophylla dominated the park. Species with highest contribution of biomass and carbon is the Swietenia macrophylla with value of 149.55t/ha. The carbon formed from this was 45%, and estimated carbon stock present is 30.59Ct/ha. Total aboveground biomass and carbon stock in the forest park is estimated at 640.21t/ha, and 130.95Ct/ha, respectively. Provided the carbon stock estimate, this could give more importance to Arroceros Forest Park in carbon sequestration. Site must be protected and enhanced to promote the important role of green spaces in Metro Manila.
Austin Water is engaged in aggressive water conservation and climate programs aimed at reducing water use and addressing the water-energy nexus, while continuing to provide reliable and sustainable water and wastewater service to customers. The programs include: mandatory watering restrictions; installation of renewable energy at plants and facilities; and implementing employee ideas to save energy in operations – all while dealing with the worst drought since the historic drought of the 1950s.
Finding Water Through Rain introduces several
conservation alternatives in rainwater and stormwater
management. These concepts include greenway
acquisition, wetlands, cisterns, pervious concrete,
earthworks, native plants and green roofs. By
implementing these practices Atlanta could use rainwater
more efficiently.
Green infrastructure in jakarta basic understanding and implementation effort...Oswar Mungkasa
The implementation of green infrastructure (GI) in Indonesia accelerated by public awareness of the importance of conservation of natural resources and ecosystems. One of the Indonesian government’s efforts to apply the principles of GI in urban areas in a structured and massive manner is through the Green City Development Program (P2KH) Ministry of Public Works and Public Housing (PUPR). The approach taken is Green Planning and Design, Green Open Space, Green Energy, Green Water, Green Waste, Green Building, Green Transportation, Green Community. The city that is the case study for discussion is Jakarta. Jakarta Smart City, Green Buildings, Urban Agriculture, and Child Friendly Integrated Public Space (RPTRA) are programs that successfully implemented. The implementation GI program easily accepted if based on the community.
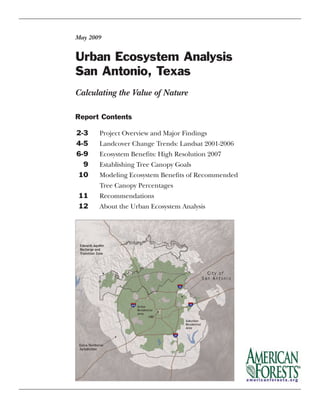
1. Urban Ecosystem Analysis
San Antonio, Texas
May 2009
Report Contents
2-3 Project Overview and Major Findings
4-5 Landcover Change Trends: Landsat 2001-2006
6-9 Ecosystem Benefits: High Resolution 2007
9 Establishing Tree Canopy Goals
10 Modeling Ecosystem Benefits of Recommended
Tree Canopy Percentages
11 Recommendations
12 About the Urban Ecosystem Analysis
Calculating the Value of Nature
2. Data from this project gives City staff the ability to conduct
their own assessments for on-going planning decisions. From
a broader perspective, the urban ecosystem analysis offers the
entire community a role in developing and maintaining its
tree canopy and improving environmental quality.
Major Findings
American Forests published an initial Urban Ecosystem Analysis
(UEA) in November 2002 of the San Antonio region looking at
the change in canopy coverage. Between 1985 and 2001 the City
of San Antonio (COSA) had lost 39% of its heavy tree canopy
cover (defined as areas with greater than 50% tree canopy).
This new analysis measured changes in five distinct landcover
types: tree canopy, urban, open space/grasslands, bare soil,
and water. In addition to measuring trend changes in the City,
this analysis also examined landcover trend changes for the
ETJ and the EARZ. The analysis quantified the impacts these
changes have had on stormwater management, air and water
quality, and carbon sequestration and storage.
2001-2006 Landcover Change Trend Data Using 30 meter
Landsat Satellite Imagery
Since the initial UEA was conducted, the findings show that
between 2001 and 2006 the City lost 1,800 acres (3.4%) of
tree canopy and 7,600 acres (6.8%) of open space/grass-
lands while gaining 7,400 acres (5.8%) of additional urban
area (Table 1).
The most dramatic tree canopy loss trend occurred in the
Edwards Aquifer Recharge and Transition Zone with 3,200
acres (6.0%) of tree canopy and 4,400 acres (10.7%) of
open space/grasslands removed while almost 6,000 acres
(20.2%) of urban area were added.
The overall ETJ showed more modest changes with a 2,600
acre (1.2%) and a 16,000 acre (3.9%) decline in tree canopy
and open space/grasslands respectively and a 15,000 acre
(9.5%) increase in urban area.
2
Project Overview
Recognizing the many benefits that urban tree canopy brings
to urban environmental quality and a growing concern of the
loss of these benefits as the area continues to develop, the City
of San Antonio engaged American Forests to update their pre-
vious Urban Ecosystem Analyses (UEA). The initial study pub-
lished in November 2002 used 2001 Landsat satellite data and
a subsequent study published in September 2003 used 2002
high resolution data. This analysis takes another snapshot in
time to examine recent landcover changes and quantify the
ecosystem benefits of the area’s green infrastructure. The study
examined three important geographic locations: the Extra-
Territorial Jurisdiction (ETJ), City of San Antonio (COSA),
and the Edwards Aquifer Recharge and Transition Zone
(EARZ)—the City’s sole source of drinking water and subject
to a lot of development in recent years. As the area continues
to develop, the ratio of impervious to pervious surface greatly
influences the amount of stormwater runoff and water quality
San Antonio must manage. This study also recommends suit-
able tree canopy goals, citywide and by landuse, needed to pro-
tect this vital resource and to meet San Antonio’s
environmental goals in accordance with current Master Plan
policies, the Tree Preservation Ordinance and air and water
compliance status.
The Urban Ecosystem Analysis in this study analyzed the ecol-
ogy of landcover at two scales spanning two time periods. The
first assessment utilized moderate-resolution (30 meter pixel
resolution) data from Landsat satellite imagery taken in 2001
and 2006. While the resolution of Landsat data is too coarse
for analyzing landuse scale areas, this chronological analysis
shows historic trends. The second assessment used 2007 high-
resolution (six ft. pixel resolution) digital imagery to calculate
current landcover by landuse, city council district, and geo-
graphic location.
American Forests used CITYgreen software to calculate how
these landcover changes impact the ecosystem services for mit-
igating stormwater runoff and air and water pollutants, and
providing carbon storage and carbon sequestration. The
stormwater formulas used in CITYgreen were calibrated to
recent San Antonio stormwater events as measured by Pape-
Dawson Engineers. For the first time, the City has an accurate
measure of how landcover affects stormwater runoff for the
entire ETJ and all the landcover contained within it.
This study also conducted predictive modeling scenarios to
quantify the environmental benefits of enhancing San Antonio’s
tree canopy to American Forests’ recommended canopy per-
centage levels. The evidence and data presented in this project
will provide City leaders with the information to better integrate
natural systems into future development decisions.
Urban Ecosystem Analysis: San Antonio, Texas
3. 3
2001-2006 Loss of Ecosystem Services
The loss of tree canopy and increase in urban areas has eco-
logical consequences; loss of green infrastructure means
that the region’s natural environment is less able to provide
ecosystem services for air, water, and carbon.
COSA’s vegetative landcover lost its ability to remove
approximately 206,000 pounds of air pollutants annually,
valued at $491,000 per year. The loss of tree canopy equat-
ed to a loss of 79,000 tons of carbon stored in trees’ wood
and a loss of 600 tons of carbon sequestered annually.
Without tree canopy to reduce stormwater runoff volume,
the City must manage an additional 58 million cubic feet of
stormwater, valued at $37 million (using a local engineered
cost of $0.64 per cubic foot.)
Tree roots absorb water pollutants for which ten measures
are available: Biological Oxygen Demand, Cadmium,
Chromium, Chemical Oxygen Demand, Copper, Lead,
Nitrogen, Phosphorus, Suspended Solids, and Zinc. Of
these, each worsened, ranging from 0.91% for Zinc to
4.21% for Chemical Oxygen Demand because trees were
removed from the land.
The ETJ, COSA, and EARZ ecosystem benefits are detailed
in Table 2.
Quantifying San Antonio’s 2007 landcover and its ecosystem
benefits provides ecological opportunities for the future
The City of San Antonio has a 38% overall tree canopy.
While this is higher than in many cities, it is less than
American Forests’ recommended 40% for this City. The 2%
difference translates into an estimated additional 454,600
trees. When this increase in tree canopy is modeled, the
ecosystem benefits include an additional 721,000 pounds of
air pollutants removed annually, valued at $1.7 million, a
decrease in 3.4 million cubic feet of stormwater runoff, val-
ued at $2.2 million, an increase in carbon storage of 276,000
tons and an increase in carbon sequestration of 2,200 tons
per year.
American Forests Report
When viewed from a landuse perspective, San Antonio’s
existing canopy falls short of American Forests’ recommen-
dations in each category: Urban residential (-3%),
Suburban residential (-6%), Central Business District (-3%),
and Commercial (-7%).
Trees slow stormwater runoff, decreasing the amount of
stormwater storage needed. In 2007 San Antonio’s tree
canopy provided 974 million cubic feet in stormwater deten-
tion services, valued at $624 million.
Trees improve air quality by removing nitrogen dioxide
(NO2), sulfur dioxide (SO2), carbon monoxide (CO),
ozone (O3) and particulate matter 10 microns or less
(PM10) in size. In 2007 San Antonio’s tree canopy removed
13 million lbs. of these pollutants annually at a value of $30
million per year.
Trees have a direct impact on the carbon footprint. Trees
help clean the air by storing and sequestering carbon. Total
storage and the rate at which carbon is stored (known as
sequestration) can be measured. Based on the 38% tree
canopy cover measured in this study, San Antonio’s trees
stored 5 million tons of carbon in trees’ wood and
sequestered 38,000 tons of carbon in 2007.
In 2007 San Antonio had 113,000 acres of tree canopy
(38%). The City had 84,000 acres of open space with grass
and scattered trees (28%), 88,000 acres of impervious sur-
face (30%), 9,500 acres of bare soil (3%), and 3,400 acres of
water (1%).
Tree canopy decline is often imperceptible since develop-
ment is approved and trees are removed on a project-by-
project basis. The City has the opportunity to protect and
enhance their tree canopy by adopting recommended tree
canopy goals that will vary by landuse. This ensures a coor-
dinated effort in protecting tree canopy and recognizes the
need to protect areas like the Edwards Aquifer Recharge
and Transition Zone. A coordinated effort will maximize
the urban forests’ ability to provide ecosystem services
which will serve the entire community.
4. Landcover ETJ City of San Antonio Edwards Aquifer
Acres Acres Acres
2001 2006 % change 2001 2006 % change 2001 2006 % change
Trees 222,320 219,688 -1.2% 54,420 52,587 -3.4% 53,443 50,236 -6.0%
Open Space/grasslands 409,707 393,588 -3.9% 111,867 104,225 -6.8% 41,193 36,767 -10.7%
Urban 152,760 167,280 9.5% 128,198 135,637 5.8% 29,565 35,527 20.2%
Bare 3,398 7,658 125.4% 1,733 3,861 122.8% 1,538 3,198 107.9%
Water 7,507 7,278 -3.0% 2,545 2,459 -3.4% 121 121 0.0%
4
Urban Ecosystem Analysis: San Antonio, Texas
Table 1. San Antonio Landsat Data Changes Over Time
San Antonio is indicative of tree canopy decline trends seen in
many U.S. metropolitan areas over the last few decades.
American Forests recommends that all metropolitan areas
analyze the benefits of increased tree cover. Communities can
offset the ecological impact of land development by planting
trees and utilizing their natural capacity to clean air and water
and slow stormwater runoff.
Landcover Change Trends: Landsat 2001-2006
For this Urban Ecosystem Analysis, American Forests used the
U.S. Geological Survey’s National Landcover Data (NLCD)
and a new classification methodology unavailable for the pre-
vious UEA analyses. The U.S. Geological Survey’s data, now
the gold standard for landcover change analysis, was classified
from Landsat 30 meter pixel data from 2001 and 2006 data to
document landcover change trends (Figure 1).
During 2001-2006, the Edwards Aquifer Recharge and
Transition Zone (EARZ) showed the most dramatic loss of 6%
in tree canopy, followed by a 3.4% loss in COSA and a 1.2% loss
for the ETJ. Due to these landcover changes, the City lost the
ability to store 58 million cubic feet of stormwater, valued at $37
million. A local engineered value of $0.64 per cubic foot was
used to calculate the value of mitigating this additional stormwa-
ter (Pape-Dawson Engineers). San Antonio’s tree canopy also
lost $491,000 in annual air pollution removal value, 79,000 tons
of carbon storage and 614 tons of carbon sequestration annual-
ly. The chronological analysis provides valuable public policy
information showing general trends in landcover changes.
Loss of Air Loss in
2001 2006 Tree Tree Loss of Air Pollution Loss in Stormwater Loss of Loss of
Tree Tree Canopy Canopy Pollution Removal Stormwater Value Carbon Carbon
2001-2006 Canopy Canopy Change Change Removal Value Value @ $.64/cu ft. Stored Sequestered
acres acres acres % lbs./yr dollar value cu. ft. dollar value tons tons
ETJ 222,320 219,688 -2,632 -1.2% -295,714 -$704,327 -93,036,121 -$59,543,117 -113,295 -882
COSA 54,420 52,587 -1,833 -3.4% -205,968 -$490,572 -57,957,865 -$37,093,034 -78,911 -614
EARZ 53,443 50,236 -3,207 -6.0% -360,132 -$857,757 -40,652,214 -$26,017,417 -137,975 -1,074
*Data was taken from 2001 and 2006 National Landcover Datasets so that historical data prepared in the same way could be compared.
Table 2. San Antonio Change in Ecosystem Services as Measured with Landsat Data*
6. 6
Urban Ecosystem Analysis: San Antonio, Texas
Ecosystem Benefits by Landuse: High Resolution 2007 Data
To better understand how landcover and landuse impact
ecosystem benefits generated by tree canopy, much finer, high-
resolution, (2-ft, resampled to 6-ft) multi-spectral satellite
imagery taken in October 2007 was classified into five landcov-
er categories: trees (includes scrub); open space/grass/scat-
tered trees; impervious surfaces; bare soil; and water (Figure
2). Landcover was also examined for four specific geographic
areas: ETJ, COSA, EARZ, and City South; and four landuse
classes: Urban Residential, Suburban Residential, Central
Business District, and Commercial (Table 3).
The spectral analysis used to stratify landcover into different
land cover classes can not distinguish canopy from scrub
species such as mesquite and persimmon. Thus the percent-
ages for tree canopy may be inflated. The ETJ south of the
City is estimated to be heavily scrub and fewer trees, where-
as the ETJ north of the city is estimated to be mostly trees
and little scrub. As such, American Forests’ canopy goal rec-
ommendations will reflect tree and scrub canopy together.
Ecosystem Values of Green Infrastructure
A city’s pervious landcover serves as its green infrastructure
that provides many environmental benefits to a community
including slowing stormwater runoff, improving water quali-
ty, protecting soil from erosion, improving air quality, and
storing atmospheric carbon. Green infrastructure includes
vegetation and their complex interactions with soil, air and
water systems. As defined in this project, green infrastruc-
ture includes the landcover categories of tree canopy, open
space/grasslands, bare soil, and water.
An Urban Ecosystem Analysis was conducted on landcover
for each of the four landuse categories (Table 4), four geo-
graphic areas and ten City Council Districts (Table 5). San
Antonio’s urban forest contributes to its multiple ecosystem
benefits. With 113,011 acres of tree canopy citywide, San
Antonio’s urban forest manages 974 million cubic feet of
stormwater, valued at $624 million, removes 12.7 million lbs.
of air pollutants annually, valued at $30.2 million per year,
stores 4.9 million tons of carbon and sequesters 38,000 tons
of carbon annually.
ETJ Edwards Aquifer Citywide City South
2007 % Land- 2007 % Land- 2007 % Land- 2007 % Land-
Landcover Acres cover Acres cover Acres cover Acres cover
Trees* 315,572 41.4% 66,903 55.0% 113,011 37.8% 17,399 35.9%
Open space/
Grasslands 302,333 39.7% 24,516 20.1% 84,290 28.2% 26,730 55.2%
Impervious 109,954 14.4% 23,692 19.5% 88,366 29.6% 2,283 4.7%
Urban:
Bare soil 23,609 3.1% 6,206 5.1% 9,544 3.2% 616 1.3%
Water 9,886 1.3% 373 0.3% 3,366 1.1% 1,388 2.9%
Total Acres 761,354 100% 121,690 100% 298,577 100% 48,415 100%
Canopy % 41% 55% 38% 36%
Table 3. 2007 Landcover by Geographic Area
Air
Air Pollution Stormwater
2007 Tree 2007 Tree Pollution Removal Carbon Carbon Stormwater Value
Area Canopy Canopy Removal Value Stored Sequestered Value @ $.64 per cu. ft
acres acres percent lbs./ yr dollar value tons tons cu. ft. dollar value
Urban Res 107,484 34,576 32 3,883,518 $9,249,691 1,487,866 11,583 327,368,176 $209,515,632
Suburban Res 259,311 85,434 33 9,595,751 $22,854,981 3,676,355 28,621 702,596,006 $449,661,444
CBD 1,066 131 12 14,763 $35,162 5,656 44 1,824,932 $1,167,956
Commercial 67,796 8,915 13 1,001,331 $2,384,951 383,633 2,987 83,795,961 $53,629,415
Note that the sum of the land uses stormwater values doesn’t total to the citywide value. This is because each land use has a specified soil type, whereas citywide, soil type must be generalized for the entire area.
Stormwater calculations listed here are based on a 2-year, 24 hour storm event. Calculations from a 5-year, 24 hour storm event are included in the Map Book as part of this project.
Table 4. San Antonio Ecosystem Services with 2007 High Resolution Imagery by Land Use
Landcover by Landuse
* Spectral analysis used to stratify landcover into different land cover classes can not distinguish canopy from scrub species such as mesquite and persimmon. As such the percentages for tree canopy may be inflat-
ed. The ETJ south of the City is estimated to be heavily scrub and fewer trees, whereas the ETJ north of the city is estimated to be mostly trees and little scrub.
CBD Urban Res. Suburban Res. Commercial
2007 % Land- 2007 % Land- 2007 % Land- 2007 % Land-
Landcover Acres cover Acres cover Acres cover Acres cover
Trees* 131 12.3% 34,576 32.0% 85,434 32.9% 8,915 13.1%
Open space/
Grasslands 84 7.8% 32,008 29.8% 115,466 44.5% 25,158 37.1%
Impervious 834 78.2% 38,687 36.0% 45,481 17.5% 29,017 42.8%
Urban:
Bare soil 13 1.2% 1,772 1.6% 5,468 2.1% 4,516 6.7%
Water 5 0.5% 441 0.4% 7,461 2.9% 191 0.3%
Total Acres 1,066 100% 107,484 100% 259,310 100% 67,797 100%
Canopy % 12% 32% 33% 13%
7. 7
American Forests Report
Stormwater Ecosystem Services
Trees reduce the volume of stormwater runoff by capturing
some rain on their leaves and branches, which then evapo-
rates back into the atmosphere. Other water infiltrates into
the soil rather than running off the land, which must be
managed. San Antonio’s urban forest manages 974 million
cubic feet of stormwater, valued at $624 million using a $0.64
per cubic foot value based on local engineering, construc-
tion, and land costs (Pape-Dawson Engineers).
A unique aspect of this Urban Ecosystem Analysis is that
CITYgreen formulas used to calculate stormwater runoff
reduction were calibrated with local stream gage data. For
the first time, stormwater runoff is directly tied to the land-
cover, rather than just from select stream gage points. Pape-
Dawson Engineers, a local engineering firm who has an
extensive database of hydrology for the region, teamed with
American Forests’ hydrologist to calibrate the curve num-
bers used in CITYgreen. The methodology is provided as an
addendum to this project.
Water Quality Ecosystem Services
Tree roots absorb water pollutants for which ten measures
are available: Biological Oxygen Demand, Cadmium,
Chromium, Chemical Oxygen Demand, Copper, Lead,
Nitrogen, Phosphorus, Suspended Solids, and Zinc.
Citywide, water pollution, as measured in percent change in
pollutant loading, would worsen, from 15% for Zinc to 73%
for Chemical Oxygen Demand if trees were removed from
the land (a detailed graph of water pollutant loading for
each analysis conducted in this project resides in the map
book that accompanies this report).
Air
Air Pollution Stormwater
2007 Tree 2007 Tree Pollution Removal Carbon Carbon Stormwater Value
Area Canopy Canopy Removal Value Stored Sequestered Value @ $.64 per cu. ft
acres acres percent lbs./ yr dollar value tons tons cu. ft. dollar value
ETJ 761,354 315,572 41% 35,444,304 $84,420,579 13,579,534 105,720 2,577,353,854 $1,649,506,467
City of San Antonio 298,577 113,011 38% 12,693,069 $30,232,114 4,863,009 37,860 974,182,092 $623,476,539
Edwards Aquifer 121,690 66,903 55% 7,514,384 $17,897,620 2,878,935 22,413 519,940,487 $332,761,912
City South Area 48,415 17,399 36% 1,954,252 $4,654,601 748,719 5,829 151,813,217 $97,160,459
Council District 1 13,876 4,075 29% 457,673 $1,090,078 175,345 1,365 42,824,280 $27,407,539
Council District 2 35,170 9,125 26% 1,024,880 $2,441,039 392,655 3,057 85,694,399 $54,844,415
Council District 3 44,855 16,337 36% 1,834,940 $4,370,426 703,008 5,473 151,561,292 $96,999,227
Council District 4 30,952 9,189 30% 1,032,089 $2,458,209 395,417 3,078 78,442,652 $50,203,297
Council District 5 12,003 3,435 29% 385,771 $918,823 147,798 1,151 31,294,766 $20,028,650
Council District 6 36,669 17,812 49% 2,000,567 $4,764,913 766,464 5,967 142,348,185 $91,102,838
Council District 7 19,055 6,885 36% 773,262 $1,841,740 296,254 2,306 60,487,227 $38,711,826
Council District 8 38,027 18,379 48% 2,064,266 $4,916,631 790,868 6,157 147,276,760 $94,257,126
Council District 9 35,397 14,357 41% 1,612,587 $3,840,829 617,819 4,810 120,531,459 $77,140,134
Council District 10 32,574 13,418 41% 1,507,034 $3,589,426 577,380 4,495 114,871,551 $73,517,793
*The sum of the council districts’ stormwater values doesn’t total to the citywide value. This is because each council district and land use has a specified curve number related to water infiltration, whereas citywide,
the curve number is a composite of the whole area so is more generalized.
**Stormwater analysis uses a 2yr, 24 hour storm event. The value of managing stormwater is based on current local construction costs of .64 per cubic foot (Pape-Dawson Engineers)
Table 5. 2007 Ecosystem Services Using High Resolution Data by Geographic Area
9. 9
American Forests Report
Air Quality Ecosystem Services
The ecological value of air quality ecosystem services is based
on the UFORE model developed by the U.S. Forest Service.
The dollar value is calculated based on externality costs to
society (such as public health-related respiratory costs) due to
the additional air pollution. Externality values are established
by State Service Commissions. San Antonio’s urban forest
removes 12.7 million lbs. of air pollutants annually, valued at
$30 million per year.
Trees have a direct impact on the carbon footprint. Trees help
clean the air by storing and sequestering atmospheric carbon
in their wood. Total storage and the rate at which carbon is
stored (known as sequestration) can be measured. San
Antonio’s tree canopy stores 5 million tons of carbon and
annually sequesters 38,000 tons of carbon.
Establishing Tree Canopy Goals
American Forests advocates that every city set a tree canopy
goal for their community. Establishing this big picture per-
spective is an important step in ensuring that their valuable
green infrastructure is maintained at minimum thresholds,
even as the community continues to develop. These goals can
be measured periodically by updating the Urban Ecosystem
Analysis to see if the City reversed its loss trend.
As shown in this Urban Ecosystem Analysis, tree canopy con-
tinues to decline in the ETJ, COSA, and most dramatically in
the Edwards Aquifer Recharge and Transition Zone.
American Forests recommends that the City adopt tree goals
per landuse as a strategy to help balance the competing pres-
sures to develop and protect its drinking water. Tree canopy
goals per landuse help the City meet its stated environmental
and quality of life goals, including federal and local clean air
and water regulations.
To help establish appropriate tree canopy goals specific to this
area, American Forests conducted a review of the City’s current
policies (Master Plan and Unified Building Code relevant to tree
canopy and environmental mandates) and a literature search
citing examples of other communities that use tree canopy goals
to meet their environmental objectives. Both reports are pro-
vided to the City as addendums to this project and can also be
found online at American Forests’ website: http://www.ameri-
canforests.org/resources/urbanforests/analysis.php.
In the City’s Master Plan, (http://www.sanantonio.gov/plan-
ning/master_plan.pdf) policies indicate that great care is
taken to protect the Edwards Aquifer Recharge and Transition
Zone, including Goal 1: Policy 1b: “Develop and implement a
management plan for landuse activities which includes the
best management practices, based on scientific study that will
protect the recharge and drainage zones of the Edwards
Aquifer from pollution.”
In Section 35-523 of the Unified Building Code regarding
Tree Preservation, “it is stated public policy of the city to
maintain, to the greatest extent possible, existing trees within
the city and the ETJ, and to add to the tree population with-
in the city and the ETJ…with the following objectives:
To encourage the preservation of trees to provide health
benefits by the cleansing and cooling of the air and con-
tributing to psychological wellness.
To encourage the preservation of trees to provide environ-
mental elements by adding value to property, and reduction
of energy costs through passive solar design utilizing trees.
To encourage the preservation of trees to provide environ-
mental elements necessary to reduce the amount of pollu-
tants entering streams and to provide elements crucial to
establishment of the local ecosystem.
To provide tree preservation requirements and incentives
to exceed those requirements that encourage the maxi-
mum preservation of trees.”
In addition to the City policies regarding environmental qual-
ity, San Antonio is currently in attainment of the Federal air
quality standard. However, with the adoption of the stricter
standards, San Antonio expects to be designated non-attain-
ment in March 2010. The mayor has signed the Mayors’
Climate Protection Agreement and City staff is compiling San
Antonio’s greenhouse gas (GHG) baseline for 2005.
Ultimately, with the data and tools provided along with this
analysis, American Forests’ intent is to help communities cal-
culate the value of their trees so that city leaders can make
decisions with more complete information about the environ-
mental and economic benefits of integrating “green” into
their urban infrastructure.
Within the last fifteen years, many cities have become aware of
the direct relationship between tree canopy and the ecosystem
services they provide. This is evident from reviewing older lit-
erature such as the U.S. Tree and Landscape Ordinances pub-
lished in 1989. Author Buck Abbey cites that a city’s common
precursor to setting citywide tree canopy goals was requiring a
set number of trees be planted based upon square footage of
site development. Abbey noted in a recent interview that since
the book’s publication, 13 communities now recognize tree
canopy in their policy documents.
American Forests’ literature review cites examples of four pro-
gressive U.S. communities that have adopted tree canopy goals:
Roanoke, VA; Baltimore, MD; Sacramento Region and Rocklin,
CA. Roanoke’s city council adopted a 40% overall tree canopy
10. 10
Urban Ecosystem Analysis: San Antonio, Texas
goal after an American Forests’ Urban Ecosystem Analysis
revealed that the city had only a 32% canopy. Even though other
communities have not yet adopted this comprehensive
approach, many other communities recognize tree canopy’s
multiple benefits and have written them into Comprehensive
plans (Chapel Hill, NC; low impact development (LID) in
Huntersville, NC; Watershed Management Plan (Charlotte-
Mecklenburg County), air quality compliance tree protection
ordinances (Kansas City), conservation development plans
(Flower Mound, Texas), compliance with NPDES permits, and
Phase II of the Clean Water Act (Baltimore County).
American Forests’ recommendations of tree canopy goals
for San Antonio are based on the area’s existing tree canopy
as quantified in this study, as well as local climate, soils, and
rainfall patterns, and the City’s mandate to protect its envi-
ronmental quality and comply with federal regulations for
air and water quality. American Forests’ recommends a 40%
citywide tree canopy goal as well as goals for each landuse.
In addition, American Forests recommends a no-net loss in
tree canopy for the EARZ because this area is so vital to the
City’s drinking water.
As of 2007, San Antonio’s 38% overall tree canopy cover is 2%
short of American Forests’ 40% citywide recommendation for
San Antonio (Table 6). Translating a goal into a rough esti-
mate of trees needed, the City would have to plant an addi-
tional 454,600 trees based on a 27 ft. diameter tree canopy.
With the modeling capabilities in CITYgreen software,
American Forests projected the ecosystem benefits that this
new tree canopy would add to the city (Table 7).
Modeling Ecosystem Benefits of Recommended Tree Canopy Percentages
By increasing tree canopy cover to recommended goals, the
City will increase their environmental services that tree canopy
provides. The additional tree canopy percentage in each lan-
duse category was modeled to demonstrate these added eco-
logical and economic benefits (Table 7). If San Antonio
increased its canopy cover by 2% overall, the ecosystem servic-
es would add an additional $1.7 million in annual air pollu-
tant removal value, an additional 276,278 tons of carbon
stored and an annual 2,151 tons of carbon sequestered, as well
as 3.4 million cubic feet of additional managed stormwater,
valued at $2.2 million.
Additional Additional
Additional Air Pollution Additional Additional Decreased Stormwater
Air Pollution Removal Carbon Carbon Stormwater Value
Land Use Removal Value Stored Sequestered Volume @ $.64 per cu. ft
lbs./ yr dollar value tons tons cu. ft. dollar value
COSA 721,121 $1,717,553 276,278 2,151 3,358,739 $2,149,593
Urban res. 341,783 $814,052 130,945 1,019 2,691,324 $1,722,448
Suburban res. 1,763,063 $4,199,230 675,470 5,259 4,498,808 $2,879,237
CBD 3,202 $7,626 1,227 10 4,183 $2,677
Commercial 521,614 $1,242,371 199,842 1,556 2,880,229 $1,843,347
*Calculating the numbers of trees this represents is based on modeling the canopy size of an “average urban tree” in San Antonio considering both large and small trees and an average 27ft. diameter canopy
spread. See calculations template for details.
Table 7. Additional Benefits of Modeled San Antonio Ecosystem Services
Citywide ETJ CBD Urban Res. Suburban Res. Commercial
Existing Canopy % 38% 55% 12% 32% 33% 13%
AF Recommended Canopy % 40% 55% 15% 35% 39% 20%
Difference in Canopy % -2% 0% -3% -3% -6% -7%
Since trees also include scrub species such as mesquite and persimmon, tree canopy goals reflect this.
Table 6. San Antonio Recommended Tree Canopy Percentages
11. Photo:GaryMoll,AmericanForests
American Forests Report
Recommendations
This project has quantified San Antonio’s green infrastruc-
ture—its landcover and corresponding ecosystem services.
This digital data is packaged into a GIS interactive data layer
compatible with existing GIS data so that City staff can use it in
future planning decisions. American Forests recommends that
the data and CITYgreen®
software be used to run landcover
scenarios, refine tree canopy goals over time, and quantify the
progress made with current and new tree initiatives.
Establish Citywide Tree Cover Goals
Establish unified tree canopy goals for the entire City and stratify
these goals for land use categories. Base these goals on City man-
dates for achieving environmental goals for air and water.
Incorporate these goals into planning and development policies.
Adopt unified tree canopy goals for the entire City and strat-
ify these goals for landuse categories. Base these goals on
City’s mandates for achieving environmental goals for air
and water. Incorporate these goals into planning and devel-
opment policies.
Use the green data layer and CITYgreen to test new strategies to pro-
tect environmental quality
Use CITYgreen scenario and replacement modeling capa-
bilities to see if the strategy for enhancing urban forest
canopy is achieving stated environmental goals.
Use CITYgreen modeling to test strategies for attaining fed-
eral air quality compliance once stricter standards are
adopted in 2010.
Use the green data layer and CITYgreen to document the ecosystem
services provided by existing tree programs
Share the green data layer provided with this project with
other city departments concerned with related ecosystem
services.
Test the impacts of changing tree canopy, impervious sur-
faces, and other landcovers under different development
scenarios.
Launch a public education campaign to increase public awareness of
the direct relationship between environmental quality and tree canopy.
Encourage private citizens to plant trees on private property
Use analysis findings in popular media to educate the pub-
lic about the importance of their role in increasing the
urban forest and the positive impact planting on private
property will make.
Incorporate CITYgreen schools program into public
schools to increase awareness of environmental issues, by
teaching practical applications of GIS, math, science and
geography. Curriculum is available through American
Forests.
11
The urban forest along the River Walk.
12. American Forests, P.O. Box 2000, Washington D.C. 20013
Phone: 202/737-1944; Fax: 202/737-2457; Web: www.americanforests.org
About the Urban Ecosystem Analysis
American Forests Urban Ecosystem Analysis is based on the
assessment of “ecological structures”—unique combinations
of landuse and landcover patterns. Each combination per-
forms ecological functions differently and is therefore
assigned a different value. For example, a site with greater
tree canopy provides more stormwater reduction benefits than
one with less tree canopy and more impervious surface.
Data Used
American Forests calibrated landcover change based on the
USGS 2001 National Landcover Dataset (NLCD) to update
the prior Urban Ecosystem Analysis rather than updating the
2002 data from the original UEA. Imagery and classification
techniques have changed substantially since the initial analy-
sis. The U.S. Geological Survey’s landcover data set is now the
standard for Landsat-derived landcover change analysis.
Imagery of San Antonio was classified from 2001 and 2006 and
landcover change trends were quantified and documented.
American Forests classified the imagery into five land classes:
trees, urban, open space, bare soil, and water.
For the high resolution imagery, Sanborn acquired 2-foot
pixel resolution, 4-band, multi-spectral aerial photography in
October 2007. Sanborn then conducted a knowledge-based
classification to divide the landcover into five categories: trees,
open space/grass/scattered trees, impervious surfaces (such
as gravel parking lots), bare soil, and water. The high resolu-
tion data was resampled to 6 ft., a size suitable for running
ArcGIS to conduct analyses.
Analysis Formulas
Urban Ecosystem Analyses were conducted using American
Forests’ CITYgreen software®
. CITYgreen for ArcGIS used the
high resolution landcover classification for the analysis. The fol-
lowing formulas are incorporated into the CITYgreen software.
TR-55 for Stormwater Runoff: The CITYgreen stormwater analy-
sis estimates the amount of stormwater that runs off a land
area during a major storm. The stormwater runoff calcula-
tions incorporate volume of runoff formulas from the Urban
Hydrology of Small Watersheds model (TR-55) developed by
the U.S. Natural Resources Conservation Service (NRCS), for-
merly known as the U.S. Soil Conservation Service. Don
Woodward, P.E., a hydrologic engineer with NRCS, cus-
tomized the formulas to determine the benefits of trees and
other urban vegetation with respect to stormwater manage-
ment. Woodward in collaboration with Troy Dorman, Ph.D,
P.E., Pape-Dawson Engineers, calibrated the curve numbers
used in CITYgreen with local stream gage data within the ETJ.
The methodology is described in an addendum to this report.
L-THIA for Water Quality: Using values from the U.S.
Environmental Protection Agency (EPA) and Purdue
University’s Long-Term Hydrological Impact Assessment (L-
THIA) spreadsheet water quality model, the Natural
Resources Conservation Service (NRCS) developed the
CITYgreen water quality model. This model estimates the
change in the concentration of the pollutants in runoff dur-
ing a typical storm event given the change in the landcover
from existing trees to a no tree condition. This model esti-
mates the event mean concentrations of nitrogen, phospho-
rus, suspended solids, zinc, lead, copper, cadmium,
chromium, chemical oxygen demand (COD), and biological
oxygen demand (BOD). Pollutant values are shown as a per-
centage of change.
UFORE Model for Air Pollution: CITYgreen®
uses formulas from
a model developed by David Nowak, PhD, of the USDA Forest
Service. The model estimates how many pounds of ozone, sul-
fur dioxide, nitrogen dioxide, and carbon monoxide and par-
ticulate matter less than 10 microns are absorbed and filtered
by tree canopies. The urban forest effects (UFORE) model is
based on data collected in 55 U.S. cities. Dollar values for air
pollutants are based on averaging the externality costs set by
the State Public Service Commission in each state. Externality
costs are the indirect costs to society, such as rising health care
expenditures as a result of air pollutants’ detrimental effects
on human health. The UFORE model also estimates the car-
bon storage capacity and the annual amount of carbon
sequestered by the tree canopy in a given area.
Acknowledgements for this Study
We gratefully acknowledge the support of the City of San
Antonio, and consultants Sanborn Mapping specialists, Don
Woodward, P.E., hydrologist, and Troy Dorman, Ph.D., P.E., sen-
ior hydrologist, Pape-Dawson Engineers in conducting this study.
For More Information
AMERICAN FORESTS, founded in 1875, is the oldest nation-
al nonprofit citizen conservation organization. Its three cen-
ters—Global ReLeaf, Urban Ecosystem Center, and Forest
Policy Center—mobilize people to improve the environment
by planting and caring for trees.
AMERICAN FORESTS’ CITYgreen software provides individ-
uals, organizations, and agencies with a powerful tool to eval-
uate development and restoration strategies and impacts on
urban ecosystems. AMERICAN FORESTS offers regional
training, teacher workshops and technical support for
CITYgreen and is a certified ESRI developer and reseller of
ArcGIS products.