Downloaded 76 times
![Building a benefit map 2
Identify the main supporting benefits
Benefits should always be written in the form:
[improvement + object] e.g. “increased revenue”
More new
applicants
Better
applicant
conversion
More quality
time with
applicants
PM-BRM 5
More
focused
advice
Increased
enrolments](https://image.slidesharecdn.com/brm-141121080901-conversion-gate02/85/Benefit-Realisation-Management-5-320.jpg)


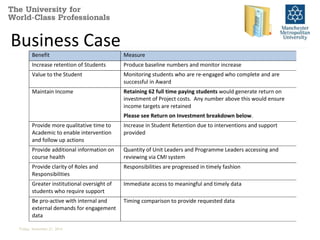

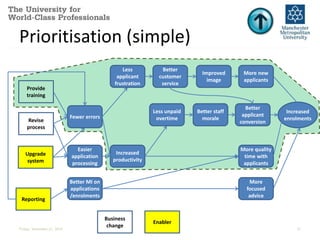
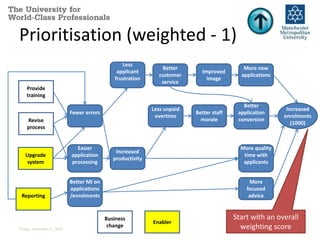


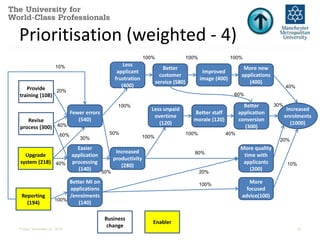


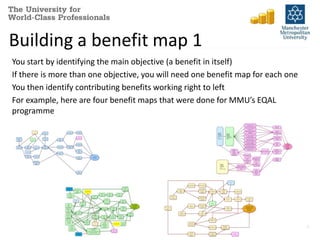
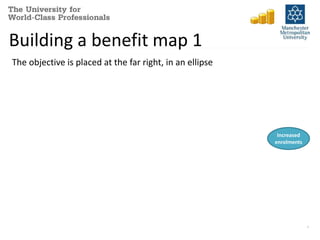
The document discusses benefit realisation management (BRM) and how it can be used in projects. It describes how to build benefit maps by identifying objectives, supporting benefits, and activities that deliver benefits. Benefit maps can then be used for stakeholder analysis, risk identification, building business cases, prioritization, and developing product catalogues. Prioritization techniques include a simpler approach of assessing which activities enable the most benefits, and a more complex weighted scoring approach. The document provides examples of each technique.