Downloaded 3,038 times

![d see a
We] di
[
users
in daily
rease
dec
among
ifically
spec
eens.
unger t
yo
David Ebersman
CFO of Facebook
October 30, 2013
Source: Facebook earnings call, October 30, 2013](https://image.slidesharecdn.com/socialmessengerwarfacebookwhatsapp-131125062952-phpapp02/85/Messenger-Wars-How-Facebook-lost-its-lead-13-320.jpg)
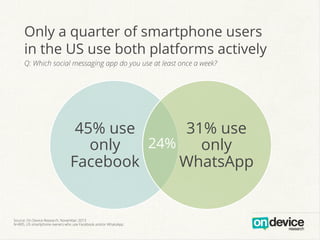
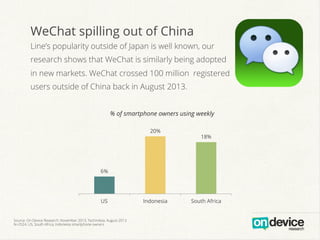
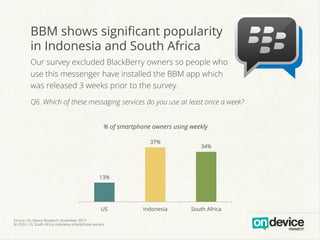

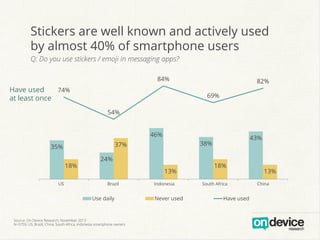


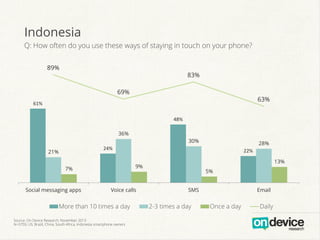

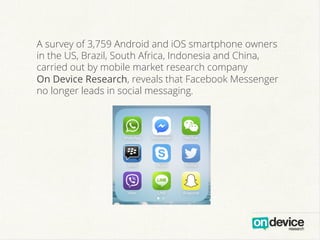
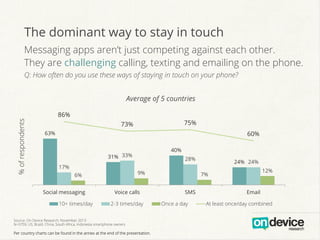
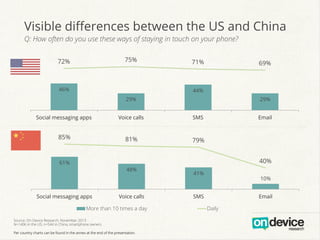
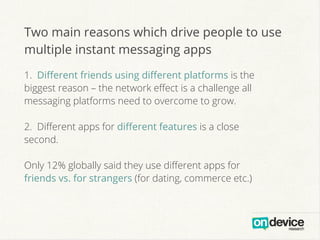
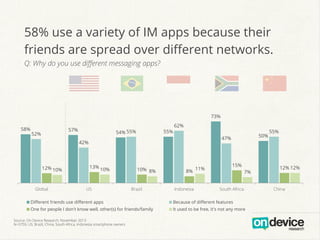
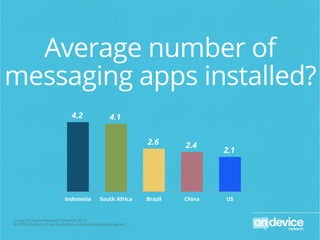
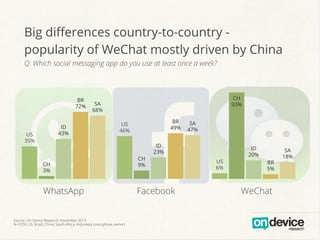
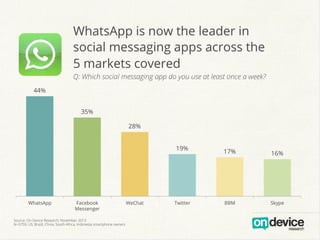
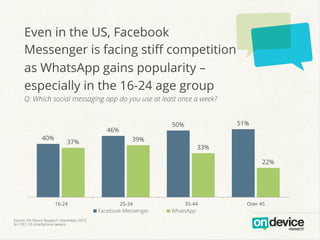
A survey reveals that Facebook Messenger has lost its lead in social messaging to WhatsApp, particularly across five countries including the US and China. WhatsApp is now the most popular messaging app and is preferred by users aged 16-24, while different messaging apps are used due to friends being on various platforms and for specific features. The study also highlights the rising competition from apps like WeChat and Snapchat, indicating a significant shift in user preferences in mobile communications.


![[2014 Q1 Umeng Insight Report] The Third Tier - Revealing China's Largest Use...](https://cdn.slidesharecdn.com/ss_thumbnails/2014q1umenginsightreporten-140606005121-phpapp02-thumbnail.jpg?width=640&height=640&fit=bounds)