Downloaded 123 times


![Miscarriage
p_miscar_
Start Cycle
Pregnancy
#
Ongoing Pregnancy
Clinical Pregnancy
p_clin_preg_
continue
#
Start Cycle
stop
t_discon_nomed[ _stage]
Stop IVF
-ve bHCG
#
Fertilization &
Embryo Transfer
#
No Oocytes
p_cancel_
Start Cycle
Ovum Pickup
No OHSS
#
Miscarriage
p_miscar
Start Cycle
Pregnancy
#
Ongoing Pregnancy
Clinical Pregnancy
p_clin_preg_
continue
#
Start Cycle
stop
t_discon_nomed[ _stage]
Stop IVF
-ve bHCG
#
Fertilization &
Embryo Transfer
#
No Oocytes
p_cancel_
Start Cycle
Ovum Pickup
OHSS
p_OHSS
Start Cycle
1
Ongoing Pregnancy
0
Stop IVF
0
Agonist
Miscarriage
p_miscar_
Start Cycle
Pregnancy
#
Ongoing Pregnancy
Clinical Pregnancy
p_clin_preg
continue
#
Start Cycle
stop
t_discon_nomed[ _stage]
Stop IVF
-ve bHCG
#
Fertilization &
Embryo Transfer
#
No Oocytes
p_cancel_
Start Cycle
Ovum Pickup
No OHSS
#
Miscarriage
p_miscar
Start Cycle
Pregnancy
#
Ongoing Pregnancy
Clinical Pregnancy
p_clin_preg
continue
#
Start Cycle
stop
t_discon_nomed[ _stage]
Stop IVF
-ve bHCG
#
Fertilization &
Embryo Transfer
#
No Oocytes
p_cancelG
Start Cycle
Ovum Pickup
OHSS
p_OHSS
Start Cycle
1
Ongoing Pregnancy
0
Stop IVF
0
antagonist
Start cycle](https://image.slidesharecdn.com/mefscosteffectiveness-141220223752-conversion-gate01/85/GnRH-costeffectiveness-22-320.jpg)
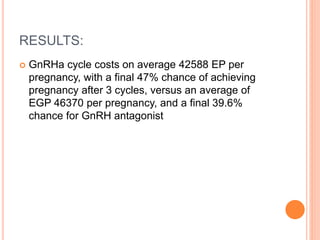
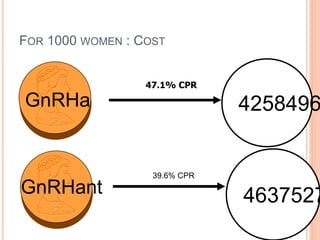
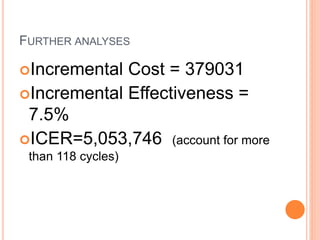


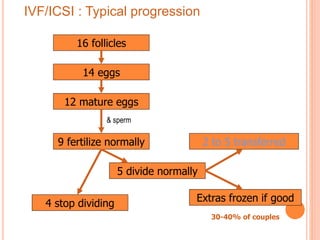
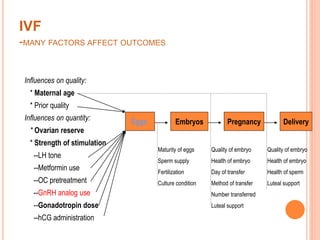
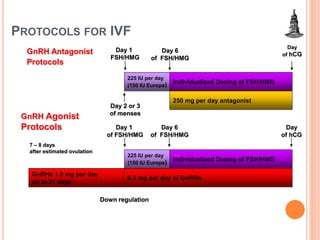
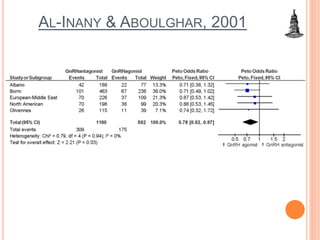
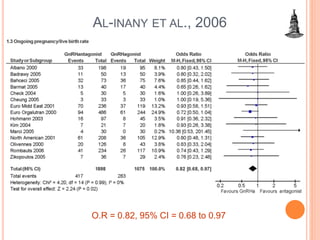
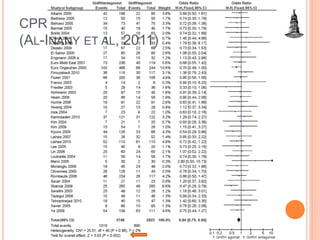
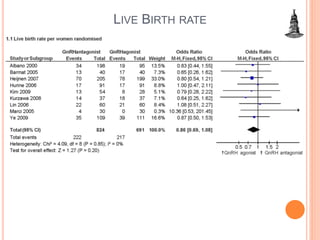
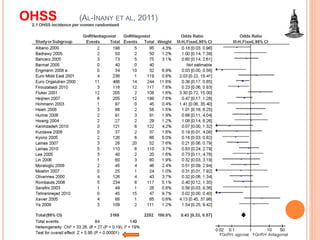
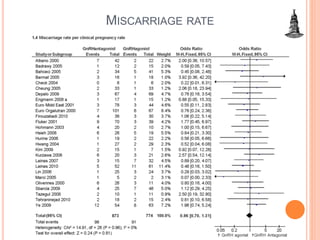
The document presents a cost-effectiveness analysis comparing GnRH agonists to antagonists in IVF/ICSI cycles, emphasizing several factors influencing treatment outcomes, such as maternal age and ovarian reserve. The study found that GnRH agonists yielded a higher live birth rate but had a higher incidence of OHSS and miscarriage compared to antagonists. Ultimately, the analysis suggests that GnRH agonists may be more cost-effective despite associated risks.


