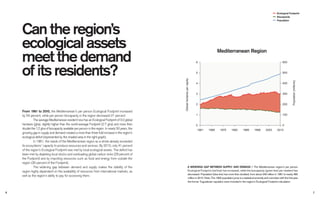
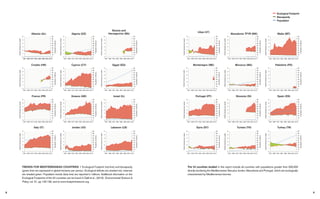
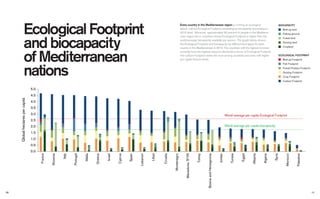
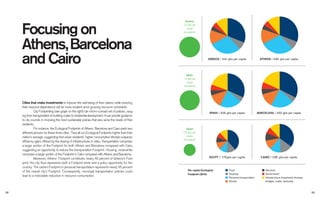
How can
Mediterranean
societies
thrive in an era
of decreasing
resources?
Global Footprint Network
Mediterranean Ecological Footprint Initiative
Innovation
and tradition:
realizing
a sustainable
vision
The unique geography and rich history of the Mediterranean region set it apart from
the rest of the world. Unsustainable consumption and development trends, however,
threaten the unique ecological assets that are the Mediterranean region’s most valuable
sources of strength.
The Mediterranean Strategy for Sustainable Development aims to guarantee
the health of these threatened assets by integrating environmental concerns into key
development decisions. The strategy’s objectives also include ensuring a high quality of
life for Mediterranean people without further degrading the environment and within the
carrying capacity of regional ecosystems.
According to Global Footprint Network’s analysis, outlined in the following pages,
the Mediterranean region now uses approximately two and a half times more natural
resources and ecological services than what its ecosystems can provide. But our analysis
also reveals opportunities for the region.
Global Footprint Network’s Mediterranean Program seeks to provide a frame-
work and tools to guide the management of natural resources, economic development
and sustainable consumption patterns to realize the vision of the Mediterranean Strategy
for Sustainable Development.
1
Is the
Mediterranean
region on track?
Ensuring a high quality of life for all people within the region’s carrying capacity is
the core vision of the Mediterranean Strategy for Sustainable Development.
Consistent with this vision, a framework that combines the United Nations
Human Development Index (HDI) with the Ecological Footprint provides a macro-level,
comparative assessment of nations’ progress towards this vision. This framework (at
right) shows that no country in the Mediterranean region meets the two minimum
criteria for globally replicable sustainable development (depicted in the shaded blue
area): a per person Ecological Footprint lower than world biocapacity of 1.8 gha and
an HDI of at least 0.71.
From the 1980s to 2000, almost all high-income western countries experi-
enced a large increase in their Ecological Footprints and HDI values. But from 2000
to 2010, their per person Ecological Footprints have declined, along with the rate of
HDI growth, as shown at right. (See Greece for instance.)
Conversely, all middle-income countries from the south and east rim of the
region have experienced constant increases in their HDI from 1980s to 2010, coupled
by continuous increases in their per person Ecological Footprints, including in the
2000-2010 period. (For example, see Albania and Tunisia.) As a result, human devel-
opment in the entire Mediterranean region climbed from medium (HDI=0.70) to high
levels (HDI=0.76), but resource demand came to noticeably exceed the region’s sup-
ply of ecological assets.
Securing economic prosperity and well-being for the region’s population thus
requires taking full account of resource constraints and physical limits in decision-
making processes.
Very High Human
Development
High Human
Development
Albania
Croatia
Egypt
Greece
Italy
Lebanon
Morocco
Portugal
Tunisia
Turkey
France
Bosnia and Herzegovina
0
1
2
3
4
5
6
0.5 0.7 0.9
EcologicalFootprintpercapita(gha)
U.N. Human Development Index (HDI)
2010
2000
MINIMUM SUSTAINABLE
DEVELOPMENT QUADRANT
Ecological Footprint values are 2010 values from the 2014 National Footprint Accounts,
Global Footprint Network. HDI 2010 values are from the 2013 Human Development Report, UNDP
Mediterranean Countries Ecological Footprint — HDI, 2000 –2010
World biocapacity per capita 2010
Mediterranean biocapacity per capita 2010
Mediterranean Countries, Ecological Footprint and HDI, 2000–2010
32
HUMAN DEVELOPMENT INDEX AND ECOLOGICAL FOOTPRINT / Human Development
Index and Ecological Footprint positions in 2000 (black dots) and 2010 (red dots) as well as
trajectories over this time period, for selected Mediterranean countries. An Ecological Footprint
lower than world average biocapacity and a high HDI score (blue quadrant) are the necessary
minimum conditions for globally replicable sustainable human development.
Measuring
ecological assets
CARBON
CO2 emissions associated
with use of fossil fuels,
electricity and energy
intensive commodities,
converted into biologically
productive areas (such
as forest land) necessary
for their sequestration.
GRAZING LAND
The area of grasslands
used to raise livestock for
meat, diary, hide and wool
products. It includes all
grasslands used to provide
feed for animals, including
cultivated pastures, wild
grasslands and prairies.
FOREST PRODUCTS
The area of forests required
to support the annual
harvest of fuel wood, pulp
and timber products.
FISHING GROUNDS
The area of marine and
inland waters required to
support annual catches of
aquatic species (fish and
seafood).
CROPLAND
The area required to grow
all crop products required
for human consumption
(food and fiber) and for
livestock feeds, fish meals,
oil crops and rubber.
BUILT-UP LAND
The area of land covered
by human infrastructure
such as roads, housing,
industrial structures and
reservoirs for hydroelectric
power generation.
Ecological Footprint
Productive area needed for regenerating resources
and absorbing waste like CO2
Biocapacity
Productive area available for regenerating resources
and absorbing waste like CO2
HUMAN CONSUMPTION IS COMPARED TO NATURE’S PRODUCTION /
The Ecological Footprint measures people’s use of cropland, forests, grazing
land and fishing grounds for providing resources and absorbing waste (carbon
dioxide from fossil fuel burning). Biocapacity measures how much biologically
productive area is available to regenerate these resources and services.
Just as a bank statement tracks expenditures against income, Ecological Foot-
print Accounting measures a population’s demand for and ecosystems’ supply of
ecological assets.
On the supply side, a city, state or nation’s biocapacity represents the productivity
of its ecological assets (including forest lands, grazing lands, cropland, fishing grounds and
built-up land).
On the demand side, the Ecological Footprint measures the ecological assets
that a given population requires to produce the natural resources and services it consumes
(including plant-based food and fiber products, livestock and fish products, timber and other
forest products, space for urban infrastructure, and forest to absorb its carbon dioxide emis-
sions from fossil fuels).
Both measures are expressed in global hectares—globally comparable, stan-
dardized hectares with world average productivity.
Each city, state or nation’s Ecological Footprint can be compared to its bio-
capacity. If a population’s Ecological Footprint exceeds the region’s biocapacity, that
region runs an ecological deficit. A region in ecological deficit meets demand by
importing, liquidating its own ecological assets (such as overfishing), and/or emitting
carbon dioxide into the atmosphere.
54
Globalhectarespercapita
0
100
200
300
400
500
600
0
1
2
3
4
5
6
1961 1968 1975 1982 1989 1996 2003 2010
Population(millions)
A WIDENING GAP BETWEEN SUPPLY AND DEMAND / The Mediterranean region’s per person
Ecological Footprint (red line) has increased, while the biocapacity (green line) per resident has
decreased. Population (blue line) has more than doubled, from about 240 million in 1961 to nearly 490
million in 2010. Note: The 1992 population jump is a statistical anomaly and coincides with the first year
the former Yugoslavian republics were included in the region’s Ecological Footprint calculation.
Mediterranean Region
From 1961 to 2010, the Mediterranean’s per person Ecological Footprint increased
by 54 percent, while per person biocapacity in the region decreased 21 percent.
The average Mediterranean resident now has an Ecological Footprint of 3.0 global
hectares (gha), slightly higher than the world-average Footprint (2.7 gha) and more than
double the 1.2 gha of biocapacity available per person in the region. In nearly 50 years, the
growing gap in supply and demand created a more than three-fold increase in the region’s
ecological deficit (represented by the shaded area in the right graph).
In 1961, the needs of the Mediterranean region as a whole already exceeded
its ecosystems’ capacity to produce resources and services. By 2010, only 41 percent
of the region’s Ecological Footprint was met by local ecological assets. The deficit has
been met by depleting local stocks and overloading global carbon sinks (29 percent of
the Footprint) and by importing resources such as food and energy from outside the
region (30 percent of the Footprint).
The widening gap between demand and supply makes the stability of the
region highly dependent on the availability of resources from international markets, as
well as the region’s ability to pay for accessing them.
Can the region’s
ecological assets
meet the demand
of its residents?
Ecological Footprint
Biocapacity
Population
76
The 24 countries studied in this report include all countries with populations greater than 500,000
directly bordering the Mediterranean Sea plus Jordan, Macedonia and Portugal, which are ecologically
characterized by Mediterranean biomes.
Ecological Footprint
Biocapacity
Population
Syria (SY)
0
10
20
30
40
50
60
70
80
90
0
1
2
3
4
5
6
1961 1968 1975 1982 1989 1996 2003 2010
Population(millions)
Globalhectarespercapita
0
10
20
30
40
50
60
70
80
90
0
1
2
3
4
5
6
1961 1968 1975 1982 1989 1996 2003 2010
Population(millions)
Globalhectarespercapita
0
10
20
30
40
50
60
70
80
90
0
1
2
3
4
5
6
1961 1968 1975 1982 1989 1996 2003 2010
Population(millions)
Globalhectarespercapita
0
10
20
30
40
50
60
70
80
90
0
1
2
3
4
5
6
1961 1968 1975 1982 1989 1996 2003 2010
Population(millions)
Globalhectarespercapita
0
10
20
30
40
50
60
70
80
90
0
1
2
3
4
5
6
1961 1968 1975 1982 1989 1996 2003 2010
Population(millions)
Globalhectarespercapita
0
10
20
30
40
50
60
70
80
90
0
1
2
3
4
5
6
1961 1968 1975 1982 1989 1996 2003 2010
Population(millions)
Globalhectarespercapita
0
10
20
30
40
50
60
70
80
90
0
1
2
3
4
5
6
1961 1968 1975 1982 1989 1996 2003 2010
Population(millions)
Globalhectarespercapita
0
10
20
30
40
50
60
70
80
90
0
1
2
3
4
5
6
1961 1968 1975 1982 1989 1996 2003 2010
Population(millions)
Globalhectarespercapita
0
10
20
30
40
50
60
70
80
90
0
1
2
3
4
5
6
1961 1968 1975 1982 1989 1996 2003 2010
Population(millions)
Globalhectarespercapita
0
10
20
30
40
50
60
70
80
90
0
1
2
3
4
5
6
1961 1968 1975 1982 1989 1996 2003 2010
Population(millions)
Globalhectarespercapita
0
10
20
30
40
50
60
70
80
90
0
1
2
3
4
5
6
1961 1968 1975 1982 1989 1996 2003 2010
Population(millions)
Globalhectarespercapita
0
10
20
30
40
50
60
70
80
90
0
1
2
3
4
5
6
1961 1968 1975 1982 1989 1996 2003 2010
Population(millions)
Globalhectarespercapita
Libya (LY)
Macedonia TFYR (MK) Malta (MT)
Montenegro (ME) Morocco (MA)
Portugal (PT) Slovenia (SI) Spain (ES)
Tunisia (TN) Turkey (TR)
Palestine (PS)
TRENDS FOR MEDITERRANEAN COUNTRIES / Ecological Footprint (red line) and biocapacity
(green line) are expressed in global hectares per person. Ecological deficits are shaded red, reserves
are shaded green. Population trends (blue line) are reported in millions. Additional information on the
Ecological Footprints of the 24 countries can be found in Galli et al., (2015). Environmental Science &
Policy, vol. 51, pp 125-136, and at www.footprintnetwork.org.
0
10
20
30
40
50
60
70
80
90
0
1
2
3
4
5
6
1961 1968 1975 1982 1989 1996 2003 2010
Population(millions)
Globalhectarespercapita
0
10
20
30
40
50
60
70
80
90
0
1
2
3
4
5
6
1961 1968 1975 1982 1989 1996 2003 2010
Population(millions)
Globalhectarespercapita
0
10
20
30
40
50
60
70
80
90
0
1
2
3
4
5
6
1961 1968 1975 1982 1989 1996 2003 2010
Population(millions)
Globalhectarespercapita
0
10
20
30
40
50
60
70
80
90
0
1
2
3
4
5
6
1961 1968 1975 1982 1989 1996 2003 2010
Population(millions)
Globalhectarespercapita
0
10
20
30
40
50
60
70
80
90
0
1
2
3
4
5
6
1961 1968 1975 1982 1989 1996 2003 2010
Population(millions)
Globalhectarespercapita
0
10
20
30
40
50
60
70
80
90
0
1
2
3
4
5
6
1961 1968 1975 1982 1989 1996 2003 2010
Population(millions)
Globalhectarespercapita
0
10
20
30
40
50
60
70
80
90
0
1
2
3
4
5
6
1961 1968 1975 1982 1989 1996 2003 2010
Population(millions)
Globalhectarespercapita
0
10
20
30
40
50
60
70
80
90
0
1
2
3
4
5
6
1961 1968 1975 1982 1989 1996 2003 2010
Population(millions)
Globalhectarespercapita
0
10
20
30
40
50
60
70
80
90
0
1
2
3
4
5
6
1961 1968 1975 1982 1989 1996 2003 2010
Population(millions)
Globalhectarespercapita
0
10
20
30
40
50
60
70
80
90
0
1
2
3
4
5
6
1961 1968 1975 1982 1989 1996 2003 2010
Population(millions)
Globalhectarespercapita
0
10
20
30
40
50
60
70
80
90
0
1
2
3
4
5
6
1961 1968 1975 1982 1989 1996 2003 2010
Population(millions)
Globalhectarespercapita
0
10
20
30
40
50
60
70
80
90
0
1
2
3
4
5
6
1961 1968 1975 1982 1989 1996 2003 2010
Population(millions)
Globalhectarespercapita
Albania (AL) Algeria (DZ)
Bosnia and
Herzegovina (BA)
Croatia (HR) Cyprus (CY) Egypt (EG)
France (FR) Greece (GR) Israel (IL)
Italy (IT) Jordan (JO) Lebanon (LB)
0
10
20
30
40
50
60
70
80
90
0
1
2
3
4
5
6
1961 1968 1975 1982 1989 1996 2003 2010
Population(millions)
Globalhectarespercapita
0
10
20
30
40
50
60
70
80
90
0
1
2
3
4
5
6
1961 1968 1975 1982 1989 1996 2003 2010
Population(millions)
Globalhectarespercapita
0
10
20
30
40
50
60
70
80
90
0
1
2
3
4
5
6
1961 1968 1975 1982 1989 1996 2003 2010
Population(millions)
Globalhectarespercapita
0
10
20
30
40
50
60
70
80
90
0
1
2
3
4
5
6
1961 1968 1975 1982 1989 1996 2003 2010
Population(millions)
Globalhectarespercapita
0
10
20
30
40
50
60
70
80
90
0
1
2
3
4
5
6
1961 1968 1975 1982 1989 1996 2003 2010
Population(millions)
Globalhectarespercapita
0
10
20
30
40
50
60
70
80
90
0
1
2
3
4
5
6
1961 1968 1975 1982 1989 1996 2003 2010
Population(millions)
Globalhectarespercapita
0
10
20
30
40
50
60
70
80
90
0
1
2
3
4
5
6
1961 1968 1975 1982 1989 1996 2003 2010
Population(millions)
Globalhectarespercapita
0
10
20
30
40
50
60
70
80
90
0
1
2
3
4
5
6
1961 1968 1975 1982 1989 1996 2003 2010
Population(millions)
Globalhectarespercapita
0
10
20
30
40
50
60
70
80
90
0
1
2
3
4
5
6
1961 1968 1975 1982 1989 1996 2003 2010
Population(millions)
Globalhectarespercapita
0
10
20
30
40
50
60
70
80
90
0
1
2
3
4
5
6
1961 1968 1975 1982 1989 1996 2003 2010
Population(millions)
Globalhectarespercapita
0
10
20
30
40
50
60
70
80
90
0
1
2
3
4
5
6
1961 1968 1975 1982 1989 1996 2003 2010
Population(millions)
Globalhectarespercapita
98
Ecological Footprint
and biocapacity
of Mediterranean
nations
Every country in the Mediterranean region is running an ecological
deficit, with its Ecological Footprint exceeding its biocapacity (according to
2010 data). Moreover, approximately 90 percent of people in the Mediterra-
nean region live in countries whose Ecological Footprint is higher than the
world-average biocapacity available per person. The graph below shows
the Ecological Footprint and biocapacity by different land types for each
country in the Mediterranean in 2010. The countries with the highest incomes
currently have the highest resource demands in terms of Ecological Footprint.
The carbon Footprint varies the most among countries and rises with higher
per capita income levels.
Croatia
Montenegro
MacedoniaTFYR
Turkey
BosniaandHerzegovina
Jordan
Tunisia
Egypt
Albania
Algeria
Syria
Morocco
Palestine
World average per capita Ecological Footprint
World average per capita biocapacity
France
Slovenia
Italy
Portugal
Malta
Greece
Israel
Cyprus
Spain
Lebanon
Libya
5.0
4.5
4.0
3.5
3.0
2.5
2.0
1.5
1.0
0.5
0.0
Globalhectarespercapita BIOCAPACITY
Built-up land
Fishing ground
Forest land
Grazing land
Cropland
ECOLOGICAL FOOTPRINT
Built-up Footprint
Fish Footprint
Forest Product Footprint
Grazing Footprint
Crop Footprint
Carbon Footprint
1110
What do resource
limits mean for
long-term economic
perfperfper ormance?formance?f
No country in the Mediterranean region is capable of providing all the natural
resources and services that its population demands by solely relying on its own
biocapacity (see pages 8-9). To some extent they all depend on net biocapacity
imports. This dependence varies considerably between countries in the region,
from under 5 percent in Bosnia and Herzegovina to over 60 percent in Malta.
The composition of external biocapacity dependence varies by country.
Indeed, countries can depend on the bioproductive ecosystems of other countries
to provide renewable natural resources such as food, fiber and timber products.
In the case of Bosnia and Herzegovina, Morocco, and Syria, the imports of such
products account for all or nearly all of their external biocapacity dependence.
Countries also can and do produce more waste than their ecosystems are capable
of absorbing. In Croatia, Slovenia and France, the implicit reliance on outside
ecosystems to absorb the carbon dioxide that is emitted into the atmosphere as
a result of consumption activities accounts for the largest share of their external
biocapacity dependence.
To understand the economic implications of ecological deficits, we can
start by looking at both the scale of the deficit and its composition.
External Biocapacity Dependence through Trade
The share of a country’s Ecological Footprint met through net biocapacity imports.
Malta
Lebanon
Cyprus
Palestine
Portugal
Jordan
Italy
Montenegro
Israel
Albania
Tunisia
Egypt
Greece
Algeria
Slovenia
Macedonia TFYR
Spain
Syria
Croatia
Turkey
Libya
Morocco
France
Bosnia and Herzegovina
38%
31%
4%
21%
55%
35%
16%
32%
40%
47%
48%
58%
27%
61%
40%
20%
53%
48%
30%
24%
22%
38%
21%
Food, fiber and timber
embodied in trade
Carbon embodied
in trade
21%
1312
With humanity now consuming the equivalent of 1.5 planets, the continually increasing
demand for natural resources and services is running up against natural boundaries. In
addition to the many environmental implications of this ecological overshoot, countries
may face growing economic risks as well.
All countries in the Mediterranean region are dependent to some extent on
imports to meet the consumption needs of their populations (see pages 12-13). As
prices for commodities increase over the long term and become more volatile in the short
term, the overall trade balance of a country faces additional risk.
While the impact of price changes is difficult to predict, a simple scenario helps
to visualize the differentiation among countries in the region. Increasing prices of natural
resources by 10 percent (a likely possibility given the abrupt ups and downs of commod-
ity prices in the past decade) while keeping consumption constant leads to very different
outcomes for countries in the Mediterranean region. It appears that most countries in the
region are likely to experience difficulties in the face of commodity price changes (see
right graph) in the form of worsening trade balances. Conversely, oil exporting countries
are likely to experience improving trade balances.
Additional information can be found in Galli et al., (2015). Environmental
Science & Policy, vol. 51, pp 125-136.
What if prices
increase just 10%?
Exposure to Price Volatility
Effect on the trade balance of a 10% increase in commodity prices, as percent of GDP.
-2 0 2 4 6 8
Albania
Algeria
Bosnia and Herzegovina
Croatia
Cyprus
Egypt
France
Greece
Israel
Italy
Jordan
Lebanon
Libya
Malta
Montenegro
Morocco
Portugal
Slovenia
Spain
Syria
Tunisia
Macedonia
Turkey
China
United States
Note: China and United States data is provided for comparison purposes.
1514
Achieving a sustainable Mediterranean region necessitates implementing new
actions and policies related to both production and consumption activities.
Shifting towards Sustainable Consumption and Production (SCP) patterns, in
turn, entails increasing resource efficiency along the entire life cycle of products and
services, and promoting sustainable lifestyles and consumption patterns. Ultimately,
this requires measuring and managing how sustainably products are consumed.
The Mediterranean region is at the forefront of the SCP approach. The Eco-
logical Footprint can further support this approach by providing decision-makers with
additional data to prioritize policies and measure progress.
Ecological Footprint analysis broken down by consumption components
highlights both the biggest challenges facing a region and the areas in which policy
changes can have the largest impact.
In almost all countries, the three largest components of the Ecological
Footprint are food, transportation and housing (as demonstrated in the right graph).
Targeting these areas through sustainable policies thus offers the opportunity to
have the greatest impact on the Ecological Footprint of the region. For instance,
Portugal has the highest food Footprint of any Mediterranean country, while France,
Italy and Greece have the highest transportation Footprints, suggesting different
priorities for Footprint reduction in each country.
Problem and
solution: two sides
of the coin
Ecological Footprint by Key Consumption Activities (2010)
Analysis provided for15 countries only, due to data limitations.
5.0
4.5
4.0
3.5
3.0
2.5
2.0
1.5
1.0
0.5
0
Globalhectarespercapita
France
Slovenia
Italy
Portugal
Malta
Greece
Israel
Cyprus
Spain
Croatia
Turkey
Tunisia
Egypt
Albania
Morocco
Med15
Infrastructure Investment (houses, bridges, roads, factories) Government
Miscellaneous goods and services Restaurants and hotels Education
Recreation and culture Communication Transportation Health
Furnishings, household equipment and routine household maintenance
Housing, water, electricity, gas and other fuels Clothing and footwear
Alcoholic beverages, tobacco and narcotics Food and non-alcoholic beverages
1716
Food Footprint:
How fit is
your diet?
Food is a substantial share of Mediterranean countries’ overall resource require-
ments, but it ranges widely as a proportion of the overall Ecological Footprint,
from as low as 20 percent (Slovenia) to as high as 70 percent (Morocco) (see
pages 16–17).
Food, of course, is a basic human requirement. Consequently, resource
needs for food consumption can be shifted by only small amounts. In addition,
food consumption heavily relates to dietary habits and production efficiency. Pro-
tein-intensive food such as meat and dairy requires more bioproductive land to
produce the same amount of calories as plant-based food products. Protein-
based foods thus have higher Footprints than plant-based foods.
Portugal and Malta have the most protein-intensive diets in the Mediter-
ranean (see graph on the right), which are based largely on fish and account for
about 0.67 gha and 0.39 gha of the Ecological Footprint respectively. In Morocco
and Tunisia, on the other hand, the biggest share of the food Footprint comes from
cereal consumption, at 0.36 gha and 0.44 gha respectively, and a small share
from the fishing industry.
Reducing human dependency on ecological assets for food consumption
therefore depends on agriculture productivity improvements, food waste reduc-
tion, and the promotion of healthier and less resource-intensive diets.
Slovenia
Egypt
Israel
Albania
Morocco
Tunisia
Cyprus
Med-15 Average
Turkey
France
Italy
Croatia
Spain
Greece
Malta
Portugal
0 0.2 0.4 0.6 0.8 1.0 1.2 1.4 1.6
Global hectares per capita
Meat
Dairy
Fish
Vegetables, fruit, nuts
Cereals
Other food
Ecological Footprint of Food Consumption (2010)
1918
An estimated 80 percent of the world’s population will live
in urban areas by 2050. In many Mediterranean countries,
one or two major urban centers already are major contribu-
tors to the national Ecological Footprint (EF) and also run
significantly higher per capita Footprints than the average
for their nations. Cities thus offer another major opportunity
for the Mediterranean region to manage its resources more
sustainably, by focusing on drivers and leverage points (see
pages 22-23). The size of each circle on this page reflects
the total Ecological Footprint of each city. The size of each
nation represents each nation’s total biocapacity (BC).
Although Egypt is larger than Turkey, for instance, its size
here is smaller because Egypt, with its large desert areas,
has roughly one-third of the biocapacity of Turkey.
10 million global hectares
City Footprints
Egypt
EF per capita: 1.79 gha
EF Total: 145 million gha
Cairo
EF per capita: 2.85 gha
Share of country pop.: 15.8%
City EF relative country BC: 84%
Greece
EF per capita: 4.41 gha
EF Total: 50 million gha
Athens
EF per capita: 4.84 gha
Share of country pop.: 35.4%
City EF relative to country BC: 122%
Thessaloniki
EF per capita: 4.25 gha
Share of country pop.: 10.2%
City EF relative to country BC: 31%
Turkey
EF per capita: 2.56 gha
EF Total: 186 million gha
Antalya
EF per capita: 2.70 gha
Share of country pop.: 1.2%
City EF relative to country BC: 2.2%
Izmir
EF per capita: 2.94 gha
Share of country pop.: 3.9%
City EF relative to country BC: 7.4%
Tunisia
EF per capita: 1.83 gha
EF Total: 19 million gha
Tunis
EF per capita: 3.12 gha
Share of country pop.: 18.3%
City EF relative to country BC: 76%
Italy
EF per capita: 4.52 gha
EF Total: 274 million gha
Naples
EF per capita: 3.34 gha
Share of country pop.: 7.3%
City EF relative to country BC: 23%
Rome
EF per capita: 4.70 gha
Share of country pop.: 6.9%
City EF relative to country BC: 31%
Palermo
EF per capita: 3.83 gha
Share of country pop.: 1.6%
City EF relative to country BC: 5.9%
Genoa
EF per capita: 4.89 gha
Share of country pop.: 1.5%
City EF relative to country BC: 7.0%
Spain
EF per capita: 4.05 gha
EF Total: 186 million gha
Valencia
EF per capita: 4.04 gha
Share of country pop.: 4.0%
City EF relative to country BC: 11%
2120
Barcelona
EF per capita: 4.52 gha
Share of country pop.: 10.2%
City EF relative to country BC: 32%
Focusing on
Athens,BarcelonaBarcelonaB
and Cairo
Cities that make investments to improve the well-being of their citizens while reducing
their resource dependence will be more resilient amid growing resource constraints.
City Footprinting (see graph on the right) can inform a broad set of policies, rang-
ingfromtransportationtobuildingcodestoresidentialdevelopment.Itcanprovideguidance
to city councils in choosing the most sustainable policies that also serve the needs of their
residents.
For instance, the Ecological Footprints of Athens, Barcelona and Cairo paint very
different pictures for these three cities. They all run Ecological Footprints higher than their
nation’s average, suggesting that urban residents’ higher consumption lifestyle outpaces
efficiency gains offered by the sharing of infrastructures in cities. Transportation comprises
a larger portion of the Footprint for both Athens and Barcelona compared with Cairo,
suggesting an opportunity to reduce the transportation Footprint. Housing, meanwhile,
comprises a larger portion of the Footprint in Cairo compared with Athens and Barcelona.
Moreover, Athens’ Footprint constitutes nearly 40 percent of Greece’s Foot-
print; this city thus represents both a Footprint driver and a policy opportunity for the
country. The carbon Footprint in personal transportation represents nearly 25 percent
of the overall city’s Footprint. Consequently, municipal transportation policies could
lead to a noticeable reduction in resource consumption.
GREECE / 4.41 gha per capita ATHENS / 4.84 gha per capita
Greece
1.5 gha per
capita
biocapacity
EGYPT / 1.79gha per capita CAIRO / 2.85 gha per capita
Egypt
0.5 gha per
capita
biocapacity
Spain
1.4 gha per
capita
biocapacity
SPAIN / 4.05 gha per capita BARCELONA / 4.52 gha per capita
Services
Government
Infrastructure Investment (houses,
bridges, roads, factories)
Food
Housing
Personal transportation
Goods
Per capita Ecological
Footprint (2010)
2322
With an ecological
bank statement,
policy decisions
become more
informed.
Leaders today require strategies that address the dual challenges of shrinking
resource supply and growing demands on the planet. Global Footprint Network and
its partners have the tools and programs necessary to help countries thrive in a
resource-constrained world. Our frameworks help economic decision-makers react
to resource limits and demonstrate it is possible and within their power to reverse
these resource trends.
Ecological Footprint accounting can help cities, states and nations more
accurately measure their ecological reserve or deficit, identify key challenges and
opportunities, and forecast and monitor the impact of different policies. Using
Ecological Footprint accounting and our Net Present Value Plus (NPV+) tool can
help government agencies at all levels manage their capital investments in a fiscally
responsible and environmentally sustainable way.
Early warning:
The Ecological Footprint can help
identify which issues need to be
addressed most urgently to generate
political will and guide policy action.
Headline and issue framing:
The Ecological Footprint can improve
understanding of the problems,
enable comparisons across regions
and raise stakeholder awareness.
Policy development:
With the identification of Footprint
“hot-spots,” policy makers can
prioritize policies and actions,
often in the context of a broader
sustainability policy.
Monitoring:
Footprint time trends and
projections can be used to
monitor the short- and long-term
effectiveness of policies.
Are we using more resources
than we have?
Future scenarios:
NPV+ uses multiple scenarios
to create a more realistic view for
capital decisions and more fully
assess risks and opportunities.
Investment analysis:
NPV+ helps governments and
public agencies more accurately
measure the long-term value of
their investments in infrastructure
and natural capital.
Policy orientation:
By understanding where the best
long-term value is, policies can be
reoriented toward better outcomes.
Building resilience:
Sound investments build wealth,
avoid stranded assets and
leave a better legacy for future
generations.
Will our investment reduce our
exposure to limited resources?
2524
Net Present Value
Plus (NPV+)
Ecological
Footprint
Europe Office
International Environment House 2
7-9 chemin de Balexert
1219 Chatelaine (Geneva)
Switzerland
T: +41 (0)22 797 41 08
Funding:
Support:
Analysis:
The MAVA Foundation was established in 1994 and is a
family-led, Swiss-based philanthropic foundation whose
mission is to engage in strong partnerships to conserve
biodiversity for future generations.
Global Footprint Network is an international think tank that
coordinates research, develops methodological standards and
provides decision-makers with a menu of tools to help the hu-
man economy operate within Earth’s ecological limits.
U.S. Office
312 Clay Street
Suite 300
Oakland, CA 94607-3510
USA
Tel. +1-510-839-8879
www.footprintnetwork.org/med
Venice Office
Regional Bureau for Science
and Culture in Europe
United Nations
Educational, Scientific and
Cultural Organization
26

Mediterranean Ecological Footprint Report 2015

  • 1.
    How can Mediterranean societies thrive inan era of decreasing resources? Global Footprint Network Mediterranean Ecological Footprint Initiative
  • 2.
    Innovation and tradition: realizing a sustainable vision Theunique geography and rich history of the Mediterranean region set it apart from the rest of the world. Unsustainable consumption and development trends, however, threaten the unique ecological assets that are the Mediterranean region’s most valuable sources of strength. The Mediterranean Strategy for Sustainable Development aims to guarantee the health of these threatened assets by integrating environmental concerns into key development decisions. The strategy’s objectives also include ensuring a high quality of life for Mediterranean people without further degrading the environment and within the carrying capacity of regional ecosystems. According to Global Footprint Network’s analysis, outlined in the following pages, the Mediterranean region now uses approximately two and a half times more natural resources and ecological services than what its ecosystems can provide. But our analysis also reveals opportunities for the region. Global Footprint Network’s Mediterranean Program seeks to provide a frame- work and tools to guide the management of natural resources, economic development and sustainable consumption patterns to realize the vision of the Mediterranean Strategy for Sustainable Development. 1
  • 3.
    Is the Mediterranean region ontrack? Ensuring a high quality of life for all people within the region’s carrying capacity is the core vision of the Mediterranean Strategy for Sustainable Development. Consistent with this vision, a framework that combines the United Nations Human Development Index (HDI) with the Ecological Footprint provides a macro-level, comparative assessment of nations’ progress towards this vision. This framework (at right) shows that no country in the Mediterranean region meets the two minimum criteria for globally replicable sustainable development (depicted in the shaded blue area): a per person Ecological Footprint lower than world biocapacity of 1.8 gha and an HDI of at least 0.71. From the 1980s to 2000, almost all high-income western countries experi- enced a large increase in their Ecological Footprints and HDI values. But from 2000 to 2010, their per person Ecological Footprints have declined, along with the rate of HDI growth, as shown at right. (See Greece for instance.) Conversely, all middle-income countries from the south and east rim of the region have experienced constant increases in their HDI from 1980s to 2010, coupled by continuous increases in their per person Ecological Footprints, including in the 2000-2010 period. (For example, see Albania and Tunisia.) As a result, human devel- opment in the entire Mediterranean region climbed from medium (HDI=0.70) to high levels (HDI=0.76), but resource demand came to noticeably exceed the region’s sup- ply of ecological assets. Securing economic prosperity and well-being for the region’s population thus requires taking full account of resource constraints and physical limits in decision- making processes. Very High Human Development High Human Development Albania Croatia Egypt Greece Italy Lebanon Morocco Portugal Tunisia Turkey France Bosnia and Herzegovina 0 1 2 3 4 5 6 0.5 0.7 0.9 EcologicalFootprintpercapita(gha) U.N. Human Development Index (HDI) 2010 2000 MINIMUM SUSTAINABLE DEVELOPMENT QUADRANT Ecological Footprint values are 2010 values from the 2014 National Footprint Accounts, Global Footprint Network. HDI 2010 values are from the 2013 Human Development Report, UNDP Mediterranean Countries Ecological Footprint — HDI, 2000 –2010 World biocapacity per capita 2010 Mediterranean biocapacity per capita 2010 Mediterranean Countries, Ecological Footprint and HDI, 2000–2010 32 HUMAN DEVELOPMENT INDEX AND ECOLOGICAL FOOTPRINT / Human Development Index and Ecological Footprint positions in 2000 (black dots) and 2010 (red dots) as well as trajectories over this time period, for selected Mediterranean countries. An Ecological Footprint lower than world average biocapacity and a high HDI score (blue quadrant) are the necessary minimum conditions for globally replicable sustainable human development.
  • 4.
    Measuring ecological assets CARBON CO2 emissionsassociated with use of fossil fuels, electricity and energy intensive commodities, converted into biologically productive areas (such as forest land) necessary for their sequestration. GRAZING LAND The area of grasslands used to raise livestock for meat, diary, hide and wool products. It includes all grasslands used to provide feed for animals, including cultivated pastures, wild grasslands and prairies. FOREST PRODUCTS The area of forests required to support the annual harvest of fuel wood, pulp and timber products. FISHING GROUNDS The area of marine and inland waters required to support annual catches of aquatic species (fish and seafood). CROPLAND The area required to grow all crop products required for human consumption (food and fiber) and for livestock feeds, fish meals, oil crops and rubber. BUILT-UP LAND The area of land covered by human infrastructure such as roads, housing, industrial structures and reservoirs for hydroelectric power generation. Ecological Footprint Productive area needed for regenerating resources and absorbing waste like CO2 Biocapacity Productive area available for regenerating resources and absorbing waste like CO2 HUMAN CONSUMPTION IS COMPARED TO NATURE’S PRODUCTION / The Ecological Footprint measures people’s use of cropland, forests, grazing land and fishing grounds for providing resources and absorbing waste (carbon dioxide from fossil fuel burning). Biocapacity measures how much biologically productive area is available to regenerate these resources and services. Just as a bank statement tracks expenditures against income, Ecological Foot- print Accounting measures a population’s demand for and ecosystems’ supply of ecological assets. On the supply side, a city, state or nation’s biocapacity represents the productivity of its ecological assets (including forest lands, grazing lands, cropland, fishing grounds and built-up land). On the demand side, the Ecological Footprint measures the ecological assets that a given population requires to produce the natural resources and services it consumes (including plant-based food and fiber products, livestock and fish products, timber and other forest products, space for urban infrastructure, and forest to absorb its carbon dioxide emis- sions from fossil fuels). Both measures are expressed in global hectares—globally comparable, stan- dardized hectares with world average productivity. Each city, state or nation’s Ecological Footprint can be compared to its bio- capacity. If a population’s Ecological Footprint exceeds the region’s biocapacity, that region runs an ecological deficit. A region in ecological deficit meets demand by importing, liquidating its own ecological assets (such as overfishing), and/or emitting carbon dioxide into the atmosphere. 54
  • 5.
    Globalhectarespercapita 0 100 200 300 400 500 600 0 1 2 3 4 5 6 1961 1968 19751982 1989 1996 2003 2010 Population(millions) A WIDENING GAP BETWEEN SUPPLY AND DEMAND / The Mediterranean region’s per person Ecological Footprint (red line) has increased, while the biocapacity (green line) per resident has decreased. Population (blue line) has more than doubled, from about 240 million in 1961 to nearly 490 million in 2010. Note: The 1992 population jump is a statistical anomaly and coincides with the first year the former Yugoslavian republics were included in the region’s Ecological Footprint calculation. Mediterranean Region From 1961 to 2010, the Mediterranean’s per person Ecological Footprint increased by 54 percent, while per person biocapacity in the region decreased 21 percent. The average Mediterranean resident now has an Ecological Footprint of 3.0 global hectares (gha), slightly higher than the world-average Footprint (2.7 gha) and more than double the 1.2 gha of biocapacity available per person in the region. In nearly 50 years, the growing gap in supply and demand created a more than three-fold increase in the region’s ecological deficit (represented by the shaded area in the right graph). In 1961, the needs of the Mediterranean region as a whole already exceeded its ecosystems’ capacity to produce resources and services. By 2010, only 41 percent of the region’s Ecological Footprint was met by local ecological assets. The deficit has been met by depleting local stocks and overloading global carbon sinks (29 percent of the Footprint) and by importing resources such as food and energy from outside the region (30 percent of the Footprint). The widening gap between demand and supply makes the stability of the region highly dependent on the availability of resources from international markets, as well as the region’s ability to pay for accessing them. Can the region’s ecological assets meet the demand of its residents? Ecological Footprint Biocapacity Population 76
  • 6.
    The 24 countriesstudied in this report include all countries with populations greater than 500,000 directly bordering the Mediterranean Sea plus Jordan, Macedonia and Portugal, which are ecologically characterized by Mediterranean biomes. Ecological Footprint Biocapacity Population Syria (SY) 0 10 20 30 40 50 60 70 80 90 0 1 2 3 4 5 6 1961 1968 1975 1982 1989 1996 2003 2010 Population(millions) Globalhectarespercapita 0 10 20 30 40 50 60 70 80 90 0 1 2 3 4 5 6 1961 1968 1975 1982 1989 1996 2003 2010 Population(millions) Globalhectarespercapita 0 10 20 30 40 50 60 70 80 90 0 1 2 3 4 5 6 1961 1968 1975 1982 1989 1996 2003 2010 Population(millions) Globalhectarespercapita 0 10 20 30 40 50 60 70 80 90 0 1 2 3 4 5 6 1961 1968 1975 1982 1989 1996 2003 2010 Population(millions) Globalhectarespercapita 0 10 20 30 40 50 60 70 80 90 0 1 2 3 4 5 6 1961 1968 1975 1982 1989 1996 2003 2010 Population(millions) Globalhectarespercapita 0 10 20 30 40 50 60 70 80 90 0 1 2 3 4 5 6 1961 1968 1975 1982 1989 1996 2003 2010 Population(millions) Globalhectarespercapita 0 10 20 30 40 50 60 70 80 90 0 1 2 3 4 5 6 1961 1968 1975 1982 1989 1996 2003 2010 Population(millions) Globalhectarespercapita 0 10 20 30 40 50 60 70 80 90 0 1 2 3 4 5 6 1961 1968 1975 1982 1989 1996 2003 2010 Population(millions) Globalhectarespercapita 0 10 20 30 40 50 60 70 80 90 0 1 2 3 4 5 6 1961 1968 1975 1982 1989 1996 2003 2010 Population(millions) Globalhectarespercapita 0 10 20 30 40 50 60 70 80 90 0 1 2 3 4 5 6 1961 1968 1975 1982 1989 1996 2003 2010 Population(millions) Globalhectarespercapita 0 10 20 30 40 50 60 70 80 90 0 1 2 3 4 5 6 1961 1968 1975 1982 1989 1996 2003 2010 Population(millions) Globalhectarespercapita 0 10 20 30 40 50 60 70 80 90 0 1 2 3 4 5 6 1961 1968 1975 1982 1989 1996 2003 2010 Population(millions) Globalhectarespercapita Libya (LY) Macedonia TFYR (MK) Malta (MT) Montenegro (ME) Morocco (MA) Portugal (PT) Slovenia (SI) Spain (ES) Tunisia (TN) Turkey (TR) Palestine (PS) TRENDS FOR MEDITERRANEAN COUNTRIES / Ecological Footprint (red line) and biocapacity (green line) are expressed in global hectares per person. Ecological deficits are shaded red, reserves are shaded green. Population trends (blue line) are reported in millions. Additional information on the Ecological Footprints of the 24 countries can be found in Galli et al., (2015). Environmental Science & Policy, vol. 51, pp 125-136, and at www.footprintnetwork.org. 0 10 20 30 40 50 60 70 80 90 0 1 2 3 4 5 6 1961 1968 1975 1982 1989 1996 2003 2010 Population(millions) Globalhectarespercapita 0 10 20 30 40 50 60 70 80 90 0 1 2 3 4 5 6 1961 1968 1975 1982 1989 1996 2003 2010 Population(millions) Globalhectarespercapita 0 10 20 30 40 50 60 70 80 90 0 1 2 3 4 5 6 1961 1968 1975 1982 1989 1996 2003 2010 Population(millions) Globalhectarespercapita 0 10 20 30 40 50 60 70 80 90 0 1 2 3 4 5 6 1961 1968 1975 1982 1989 1996 2003 2010 Population(millions) Globalhectarespercapita 0 10 20 30 40 50 60 70 80 90 0 1 2 3 4 5 6 1961 1968 1975 1982 1989 1996 2003 2010 Population(millions) Globalhectarespercapita 0 10 20 30 40 50 60 70 80 90 0 1 2 3 4 5 6 1961 1968 1975 1982 1989 1996 2003 2010 Population(millions) Globalhectarespercapita 0 10 20 30 40 50 60 70 80 90 0 1 2 3 4 5 6 1961 1968 1975 1982 1989 1996 2003 2010 Population(millions) Globalhectarespercapita 0 10 20 30 40 50 60 70 80 90 0 1 2 3 4 5 6 1961 1968 1975 1982 1989 1996 2003 2010 Population(millions) Globalhectarespercapita 0 10 20 30 40 50 60 70 80 90 0 1 2 3 4 5 6 1961 1968 1975 1982 1989 1996 2003 2010 Population(millions) Globalhectarespercapita 0 10 20 30 40 50 60 70 80 90 0 1 2 3 4 5 6 1961 1968 1975 1982 1989 1996 2003 2010 Population(millions) Globalhectarespercapita 0 10 20 30 40 50 60 70 80 90 0 1 2 3 4 5 6 1961 1968 1975 1982 1989 1996 2003 2010 Population(millions) Globalhectarespercapita 0 10 20 30 40 50 60 70 80 90 0 1 2 3 4 5 6 1961 1968 1975 1982 1989 1996 2003 2010 Population(millions) Globalhectarespercapita Albania (AL) Algeria (DZ) Bosnia and Herzegovina (BA) Croatia (HR) Cyprus (CY) Egypt (EG) France (FR) Greece (GR) Israel (IL) Italy (IT) Jordan (JO) Lebanon (LB) 0 10 20 30 40 50 60 70 80 90 0 1 2 3 4 5 6 1961 1968 1975 1982 1989 1996 2003 2010 Population(millions) Globalhectarespercapita 0 10 20 30 40 50 60 70 80 90 0 1 2 3 4 5 6 1961 1968 1975 1982 1989 1996 2003 2010 Population(millions) Globalhectarespercapita 0 10 20 30 40 50 60 70 80 90 0 1 2 3 4 5 6 1961 1968 1975 1982 1989 1996 2003 2010 Population(millions) Globalhectarespercapita 0 10 20 30 40 50 60 70 80 90 0 1 2 3 4 5 6 1961 1968 1975 1982 1989 1996 2003 2010 Population(millions) Globalhectarespercapita 0 10 20 30 40 50 60 70 80 90 0 1 2 3 4 5 6 1961 1968 1975 1982 1989 1996 2003 2010 Population(millions) Globalhectarespercapita 0 10 20 30 40 50 60 70 80 90 0 1 2 3 4 5 6 1961 1968 1975 1982 1989 1996 2003 2010 Population(millions) Globalhectarespercapita 0 10 20 30 40 50 60 70 80 90 0 1 2 3 4 5 6 1961 1968 1975 1982 1989 1996 2003 2010 Population(millions) Globalhectarespercapita 0 10 20 30 40 50 60 70 80 90 0 1 2 3 4 5 6 1961 1968 1975 1982 1989 1996 2003 2010 Population(millions) Globalhectarespercapita 0 10 20 30 40 50 60 70 80 90 0 1 2 3 4 5 6 1961 1968 1975 1982 1989 1996 2003 2010 Population(millions) Globalhectarespercapita 0 10 20 30 40 50 60 70 80 90 0 1 2 3 4 5 6 1961 1968 1975 1982 1989 1996 2003 2010 Population(millions) Globalhectarespercapita 0 10 20 30 40 50 60 70 80 90 0 1 2 3 4 5 6 1961 1968 1975 1982 1989 1996 2003 2010 Population(millions) Globalhectarespercapita 98
  • 7.
    Ecological Footprint and biocapacity ofMediterranean nations Every country in the Mediterranean region is running an ecological deficit, with its Ecological Footprint exceeding its biocapacity (according to 2010 data). Moreover, approximately 90 percent of people in the Mediterra- nean region live in countries whose Ecological Footprint is higher than the world-average biocapacity available per person. The graph below shows the Ecological Footprint and biocapacity by different land types for each country in the Mediterranean in 2010. The countries with the highest incomes currently have the highest resource demands in terms of Ecological Footprint. The carbon Footprint varies the most among countries and rises with higher per capita income levels. Croatia Montenegro MacedoniaTFYR Turkey BosniaandHerzegovina Jordan Tunisia Egypt Albania Algeria Syria Morocco Palestine World average per capita Ecological Footprint World average per capita biocapacity France Slovenia Italy Portugal Malta Greece Israel Cyprus Spain Lebanon Libya 5.0 4.5 4.0 3.5 3.0 2.5 2.0 1.5 1.0 0.5 0.0 Globalhectarespercapita BIOCAPACITY Built-up land Fishing ground Forest land Grazing land Cropland ECOLOGICAL FOOTPRINT Built-up Footprint Fish Footprint Forest Product Footprint Grazing Footprint Crop Footprint Carbon Footprint 1110
  • 8.
    What do resource limitsmean for long-term economic perfperfper ormance?formance?f No country in the Mediterranean region is capable of providing all the natural resources and services that its population demands by solely relying on its own biocapacity (see pages 8-9). To some extent they all depend on net biocapacity imports. This dependence varies considerably between countries in the region, from under 5 percent in Bosnia and Herzegovina to over 60 percent in Malta. The composition of external biocapacity dependence varies by country. Indeed, countries can depend on the bioproductive ecosystems of other countries to provide renewable natural resources such as food, fiber and timber products. In the case of Bosnia and Herzegovina, Morocco, and Syria, the imports of such products account for all or nearly all of their external biocapacity dependence. Countries also can and do produce more waste than their ecosystems are capable of absorbing. In Croatia, Slovenia and France, the implicit reliance on outside ecosystems to absorb the carbon dioxide that is emitted into the atmosphere as a result of consumption activities accounts for the largest share of their external biocapacity dependence. To understand the economic implications of ecological deficits, we can start by looking at both the scale of the deficit and its composition. External Biocapacity Dependence through Trade The share of a country’s Ecological Footprint met through net biocapacity imports. Malta Lebanon Cyprus Palestine Portugal Jordan Italy Montenegro Israel Albania Tunisia Egypt Greece Algeria Slovenia Macedonia TFYR Spain Syria Croatia Turkey Libya Morocco France Bosnia and Herzegovina 38% 31% 4% 21% 55% 35% 16% 32% 40% 47% 48% 58% 27% 61% 40% 20% 53% 48% 30% 24% 22% 38% 21% Food, fiber and timber embodied in trade Carbon embodied in trade 21% 1312
  • 9.
    With humanity nowconsuming the equivalent of 1.5 planets, the continually increasing demand for natural resources and services is running up against natural boundaries. In addition to the many environmental implications of this ecological overshoot, countries may face growing economic risks as well. All countries in the Mediterranean region are dependent to some extent on imports to meet the consumption needs of their populations (see pages 12-13). As prices for commodities increase over the long term and become more volatile in the short term, the overall trade balance of a country faces additional risk. While the impact of price changes is difficult to predict, a simple scenario helps to visualize the differentiation among countries in the region. Increasing prices of natural resources by 10 percent (a likely possibility given the abrupt ups and downs of commod- ity prices in the past decade) while keeping consumption constant leads to very different outcomes for countries in the Mediterranean region. It appears that most countries in the region are likely to experience difficulties in the face of commodity price changes (see right graph) in the form of worsening trade balances. Conversely, oil exporting countries are likely to experience improving trade balances. Additional information can be found in Galli et al., (2015). Environmental Science & Policy, vol. 51, pp 125-136. What if prices increase just 10%? Exposure to Price Volatility Effect on the trade balance of a 10% increase in commodity prices, as percent of GDP. -2 0 2 4 6 8 Albania Algeria Bosnia and Herzegovina Croatia Cyprus Egypt France Greece Israel Italy Jordan Lebanon Libya Malta Montenegro Morocco Portugal Slovenia Spain Syria Tunisia Macedonia Turkey China United States Note: China and United States data is provided for comparison purposes. 1514
  • 10.
    Achieving a sustainableMediterranean region necessitates implementing new actions and policies related to both production and consumption activities. Shifting towards Sustainable Consumption and Production (SCP) patterns, in turn, entails increasing resource efficiency along the entire life cycle of products and services, and promoting sustainable lifestyles and consumption patterns. Ultimately, this requires measuring and managing how sustainably products are consumed. The Mediterranean region is at the forefront of the SCP approach. The Eco- logical Footprint can further support this approach by providing decision-makers with additional data to prioritize policies and measure progress. Ecological Footprint analysis broken down by consumption components highlights both the biggest challenges facing a region and the areas in which policy changes can have the largest impact. In almost all countries, the three largest components of the Ecological Footprint are food, transportation and housing (as demonstrated in the right graph). Targeting these areas through sustainable policies thus offers the opportunity to have the greatest impact on the Ecological Footprint of the region. For instance, Portugal has the highest food Footprint of any Mediterranean country, while France, Italy and Greece have the highest transportation Footprints, suggesting different priorities for Footprint reduction in each country. Problem and solution: two sides of the coin Ecological Footprint by Key Consumption Activities (2010) Analysis provided for15 countries only, due to data limitations. 5.0 4.5 4.0 3.5 3.0 2.5 2.0 1.5 1.0 0.5 0 Globalhectarespercapita France Slovenia Italy Portugal Malta Greece Israel Cyprus Spain Croatia Turkey Tunisia Egypt Albania Morocco Med15 Infrastructure Investment (houses, bridges, roads, factories) Government Miscellaneous goods and services Restaurants and hotels Education Recreation and culture Communication Transportation Health Furnishings, household equipment and routine household maintenance Housing, water, electricity, gas and other fuels Clothing and footwear Alcoholic beverages, tobacco and narcotics Food and non-alcoholic beverages 1716
  • 11.
    Food Footprint: How fitis your diet? Food is a substantial share of Mediterranean countries’ overall resource require- ments, but it ranges widely as a proportion of the overall Ecological Footprint, from as low as 20 percent (Slovenia) to as high as 70 percent (Morocco) (see pages 16–17). Food, of course, is a basic human requirement. Consequently, resource needs for food consumption can be shifted by only small amounts. In addition, food consumption heavily relates to dietary habits and production efficiency. Pro- tein-intensive food such as meat and dairy requires more bioproductive land to produce the same amount of calories as plant-based food products. Protein- based foods thus have higher Footprints than plant-based foods. Portugal and Malta have the most protein-intensive diets in the Mediter- ranean (see graph on the right), which are based largely on fish and account for about 0.67 gha and 0.39 gha of the Ecological Footprint respectively. In Morocco and Tunisia, on the other hand, the biggest share of the food Footprint comes from cereal consumption, at 0.36 gha and 0.44 gha respectively, and a small share from the fishing industry. Reducing human dependency on ecological assets for food consumption therefore depends on agriculture productivity improvements, food waste reduc- tion, and the promotion of healthier and less resource-intensive diets. Slovenia Egypt Israel Albania Morocco Tunisia Cyprus Med-15 Average Turkey France Italy Croatia Spain Greece Malta Portugal 0 0.2 0.4 0.6 0.8 1.0 1.2 1.4 1.6 Global hectares per capita Meat Dairy Fish Vegetables, fruit, nuts Cereals Other food Ecological Footprint of Food Consumption (2010) 1918
  • 12.
    An estimated 80percent of the world’s population will live in urban areas by 2050. In many Mediterranean countries, one or two major urban centers already are major contribu- tors to the national Ecological Footprint (EF) and also run significantly higher per capita Footprints than the average for their nations. Cities thus offer another major opportunity for the Mediterranean region to manage its resources more sustainably, by focusing on drivers and leverage points (see pages 22-23). The size of each circle on this page reflects the total Ecological Footprint of each city. The size of each nation represents each nation’s total biocapacity (BC). Although Egypt is larger than Turkey, for instance, its size here is smaller because Egypt, with its large desert areas, has roughly one-third of the biocapacity of Turkey. 10 million global hectares City Footprints Egypt EF per capita: 1.79 gha EF Total: 145 million gha Cairo EF per capita: 2.85 gha Share of country pop.: 15.8% City EF relative country BC: 84% Greece EF per capita: 4.41 gha EF Total: 50 million gha Athens EF per capita: 4.84 gha Share of country pop.: 35.4% City EF relative to country BC: 122% Thessaloniki EF per capita: 4.25 gha Share of country pop.: 10.2% City EF relative to country BC: 31% Turkey EF per capita: 2.56 gha EF Total: 186 million gha Antalya EF per capita: 2.70 gha Share of country pop.: 1.2% City EF relative to country BC: 2.2% Izmir EF per capita: 2.94 gha Share of country pop.: 3.9% City EF relative to country BC: 7.4% Tunisia EF per capita: 1.83 gha EF Total: 19 million gha Tunis EF per capita: 3.12 gha Share of country pop.: 18.3% City EF relative to country BC: 76% Italy EF per capita: 4.52 gha EF Total: 274 million gha Naples EF per capita: 3.34 gha Share of country pop.: 7.3% City EF relative to country BC: 23% Rome EF per capita: 4.70 gha Share of country pop.: 6.9% City EF relative to country BC: 31% Palermo EF per capita: 3.83 gha Share of country pop.: 1.6% City EF relative to country BC: 5.9% Genoa EF per capita: 4.89 gha Share of country pop.: 1.5% City EF relative to country BC: 7.0% Spain EF per capita: 4.05 gha EF Total: 186 million gha Valencia EF per capita: 4.04 gha Share of country pop.: 4.0% City EF relative to country BC: 11% 2120 Barcelona EF per capita: 4.52 gha Share of country pop.: 10.2% City EF relative to country BC: 32%
  • 13.
    Focusing on Athens,BarcelonaBarcelonaB and Cairo Citiesthat make investments to improve the well-being of their citizens while reducing their resource dependence will be more resilient amid growing resource constraints. City Footprinting (see graph on the right) can inform a broad set of policies, rang- ingfromtransportationtobuildingcodestoresidentialdevelopment.Itcanprovideguidance to city councils in choosing the most sustainable policies that also serve the needs of their residents. For instance, the Ecological Footprints of Athens, Barcelona and Cairo paint very different pictures for these three cities. They all run Ecological Footprints higher than their nation’s average, suggesting that urban residents’ higher consumption lifestyle outpaces efficiency gains offered by the sharing of infrastructures in cities. Transportation comprises a larger portion of the Footprint for both Athens and Barcelona compared with Cairo, suggesting an opportunity to reduce the transportation Footprint. Housing, meanwhile, comprises a larger portion of the Footprint in Cairo compared with Athens and Barcelona. Moreover, Athens’ Footprint constitutes nearly 40 percent of Greece’s Foot- print; this city thus represents both a Footprint driver and a policy opportunity for the country. The carbon Footprint in personal transportation represents nearly 25 percent of the overall city’s Footprint. Consequently, municipal transportation policies could lead to a noticeable reduction in resource consumption. GREECE / 4.41 gha per capita ATHENS / 4.84 gha per capita Greece 1.5 gha per capita biocapacity EGYPT / 1.79gha per capita CAIRO / 2.85 gha per capita Egypt 0.5 gha per capita biocapacity Spain 1.4 gha per capita biocapacity SPAIN / 4.05 gha per capita BARCELONA / 4.52 gha per capita Services Government Infrastructure Investment (houses, bridges, roads, factories) Food Housing Personal transportation Goods Per capita Ecological Footprint (2010) 2322
  • 14.
    With an ecological bankstatement, policy decisions become more informed. Leaders today require strategies that address the dual challenges of shrinking resource supply and growing demands on the planet. Global Footprint Network and its partners have the tools and programs necessary to help countries thrive in a resource-constrained world. Our frameworks help economic decision-makers react to resource limits and demonstrate it is possible and within their power to reverse these resource trends. Ecological Footprint accounting can help cities, states and nations more accurately measure their ecological reserve or deficit, identify key challenges and opportunities, and forecast and monitor the impact of different policies. Using Ecological Footprint accounting and our Net Present Value Plus (NPV+) tool can help government agencies at all levels manage their capital investments in a fiscally responsible and environmentally sustainable way. Early warning: The Ecological Footprint can help identify which issues need to be addressed most urgently to generate political will and guide policy action. Headline and issue framing: The Ecological Footprint can improve understanding of the problems, enable comparisons across regions and raise stakeholder awareness. Policy development: With the identification of Footprint “hot-spots,” policy makers can prioritize policies and actions, often in the context of a broader sustainability policy. Monitoring: Footprint time trends and projections can be used to monitor the short- and long-term effectiveness of policies. Are we using more resources than we have? Future scenarios: NPV+ uses multiple scenarios to create a more realistic view for capital decisions and more fully assess risks and opportunities. Investment analysis: NPV+ helps governments and public agencies more accurately measure the long-term value of their investments in infrastructure and natural capital. Policy orientation: By understanding where the best long-term value is, policies can be reoriented toward better outcomes. Building resilience: Sound investments build wealth, avoid stranded assets and leave a better legacy for future generations. Will our investment reduce our exposure to limited resources? 2524 Net Present Value Plus (NPV+) Ecological Footprint
  • 15.
    Europe Office International EnvironmentHouse 2 7-9 chemin de Balexert 1219 Chatelaine (Geneva) Switzerland T: +41 (0)22 797 41 08 Funding: Support: Analysis: The MAVA Foundation was established in 1994 and is a family-led, Swiss-based philanthropic foundation whose mission is to engage in strong partnerships to conserve biodiversity for future generations. Global Footprint Network is an international think tank that coordinates research, develops methodological standards and provides decision-makers with a menu of tools to help the hu- man economy operate within Earth’s ecological limits. U.S. Office 312 Clay Street Suite 300 Oakland, CA 94607-3510 USA Tel. +1-510-839-8879 www.footprintnetwork.org/med Venice Office Regional Bureau for Science and Culture in Europe United Nations Educational, Scientific and Cultural Organization 26