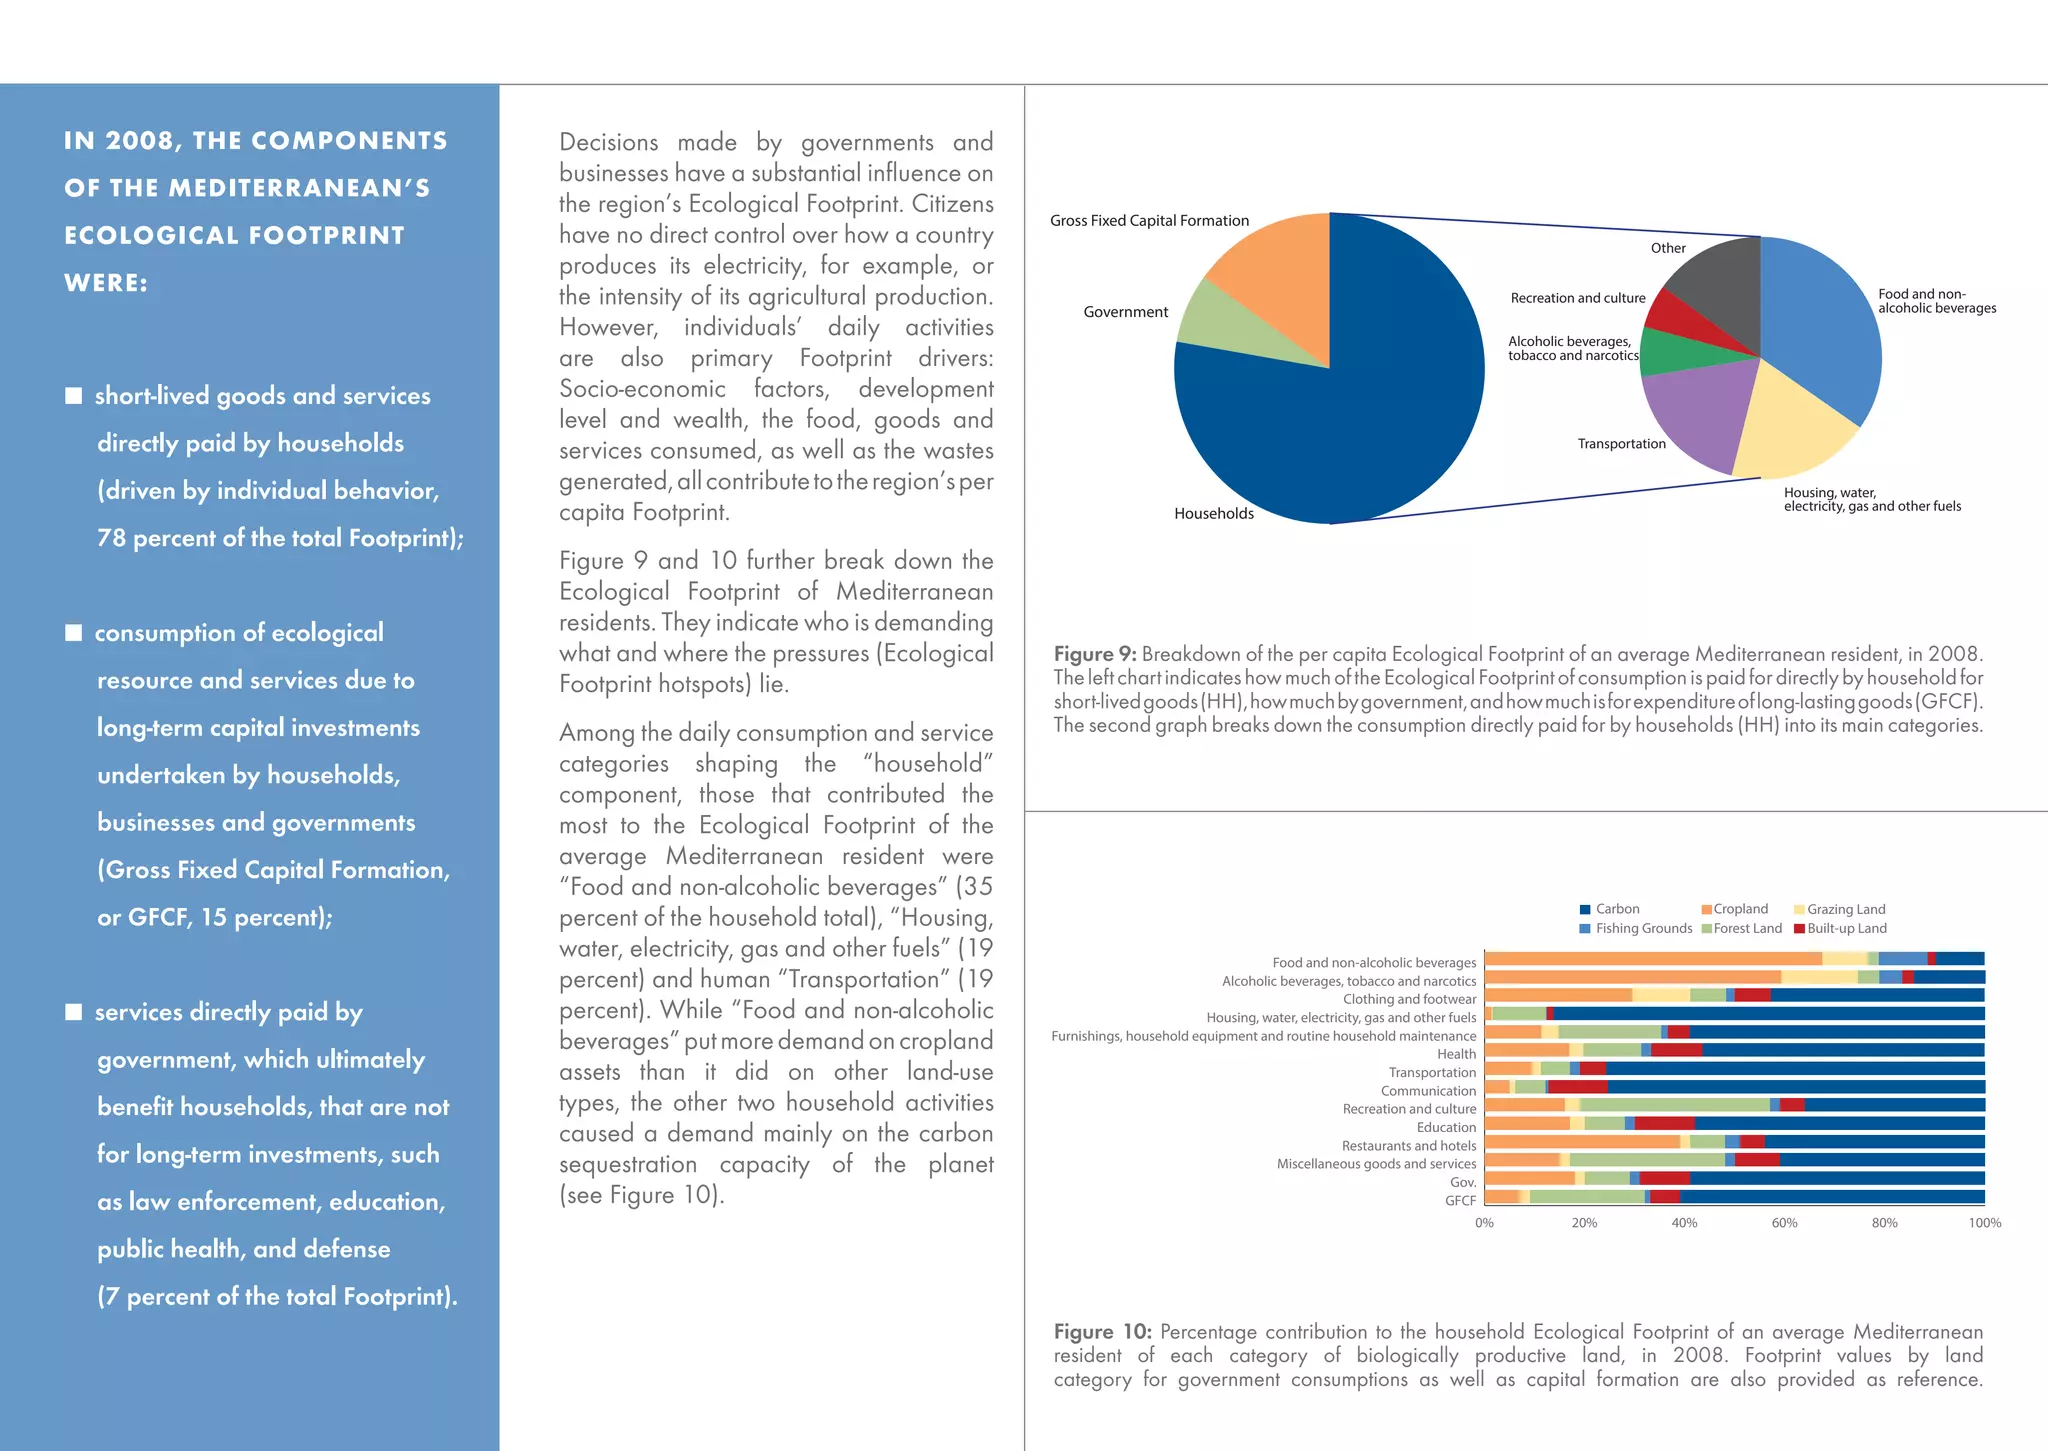
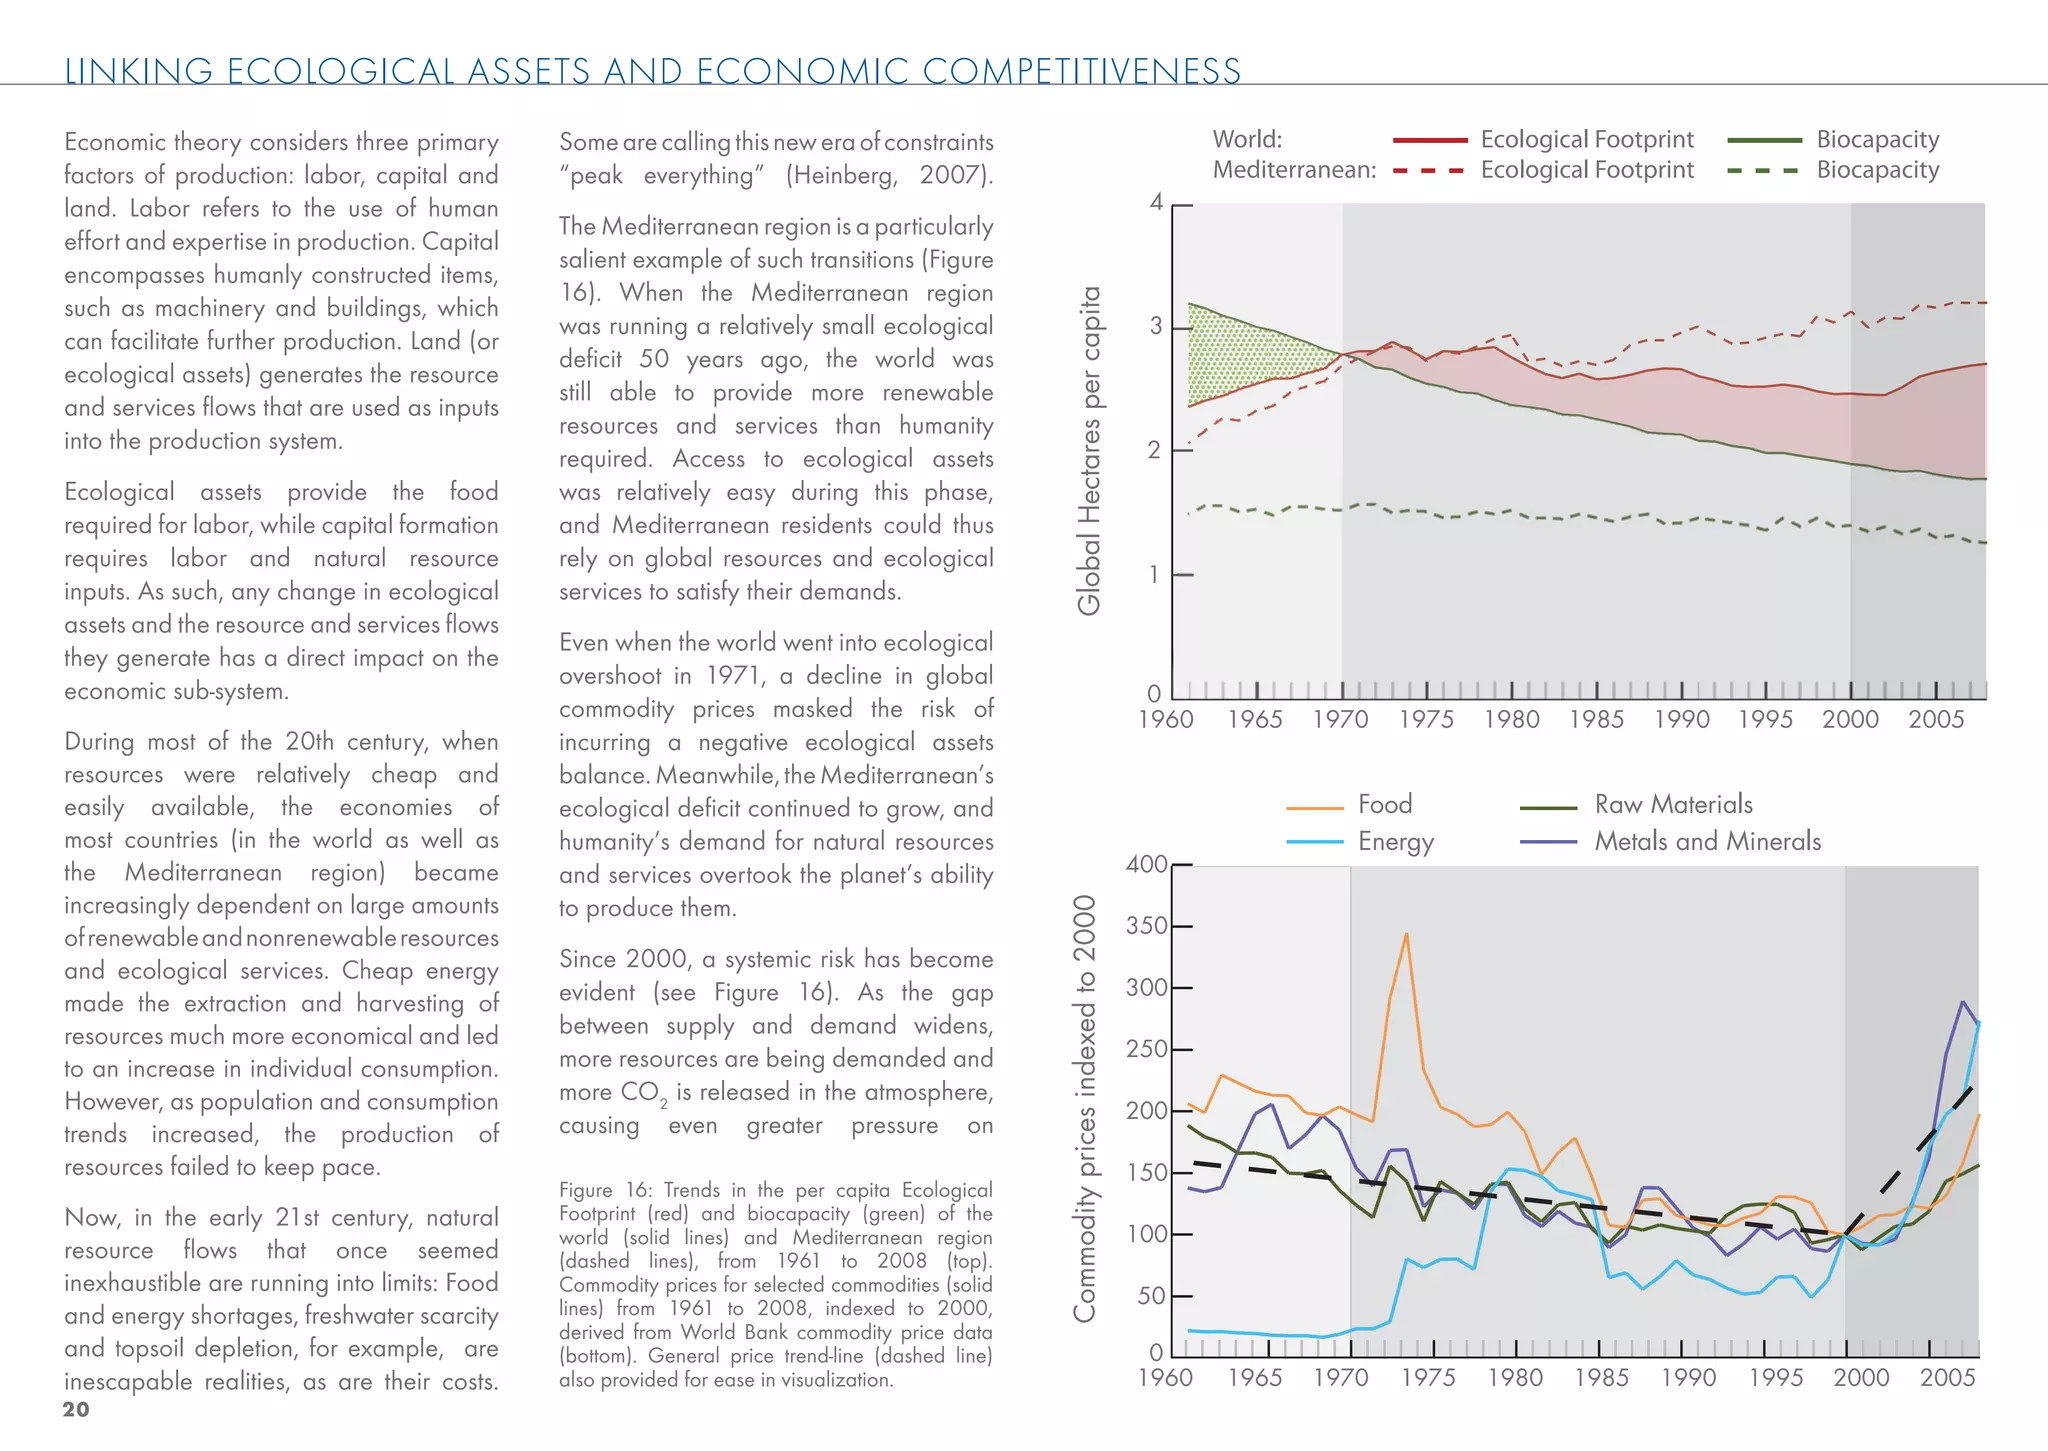
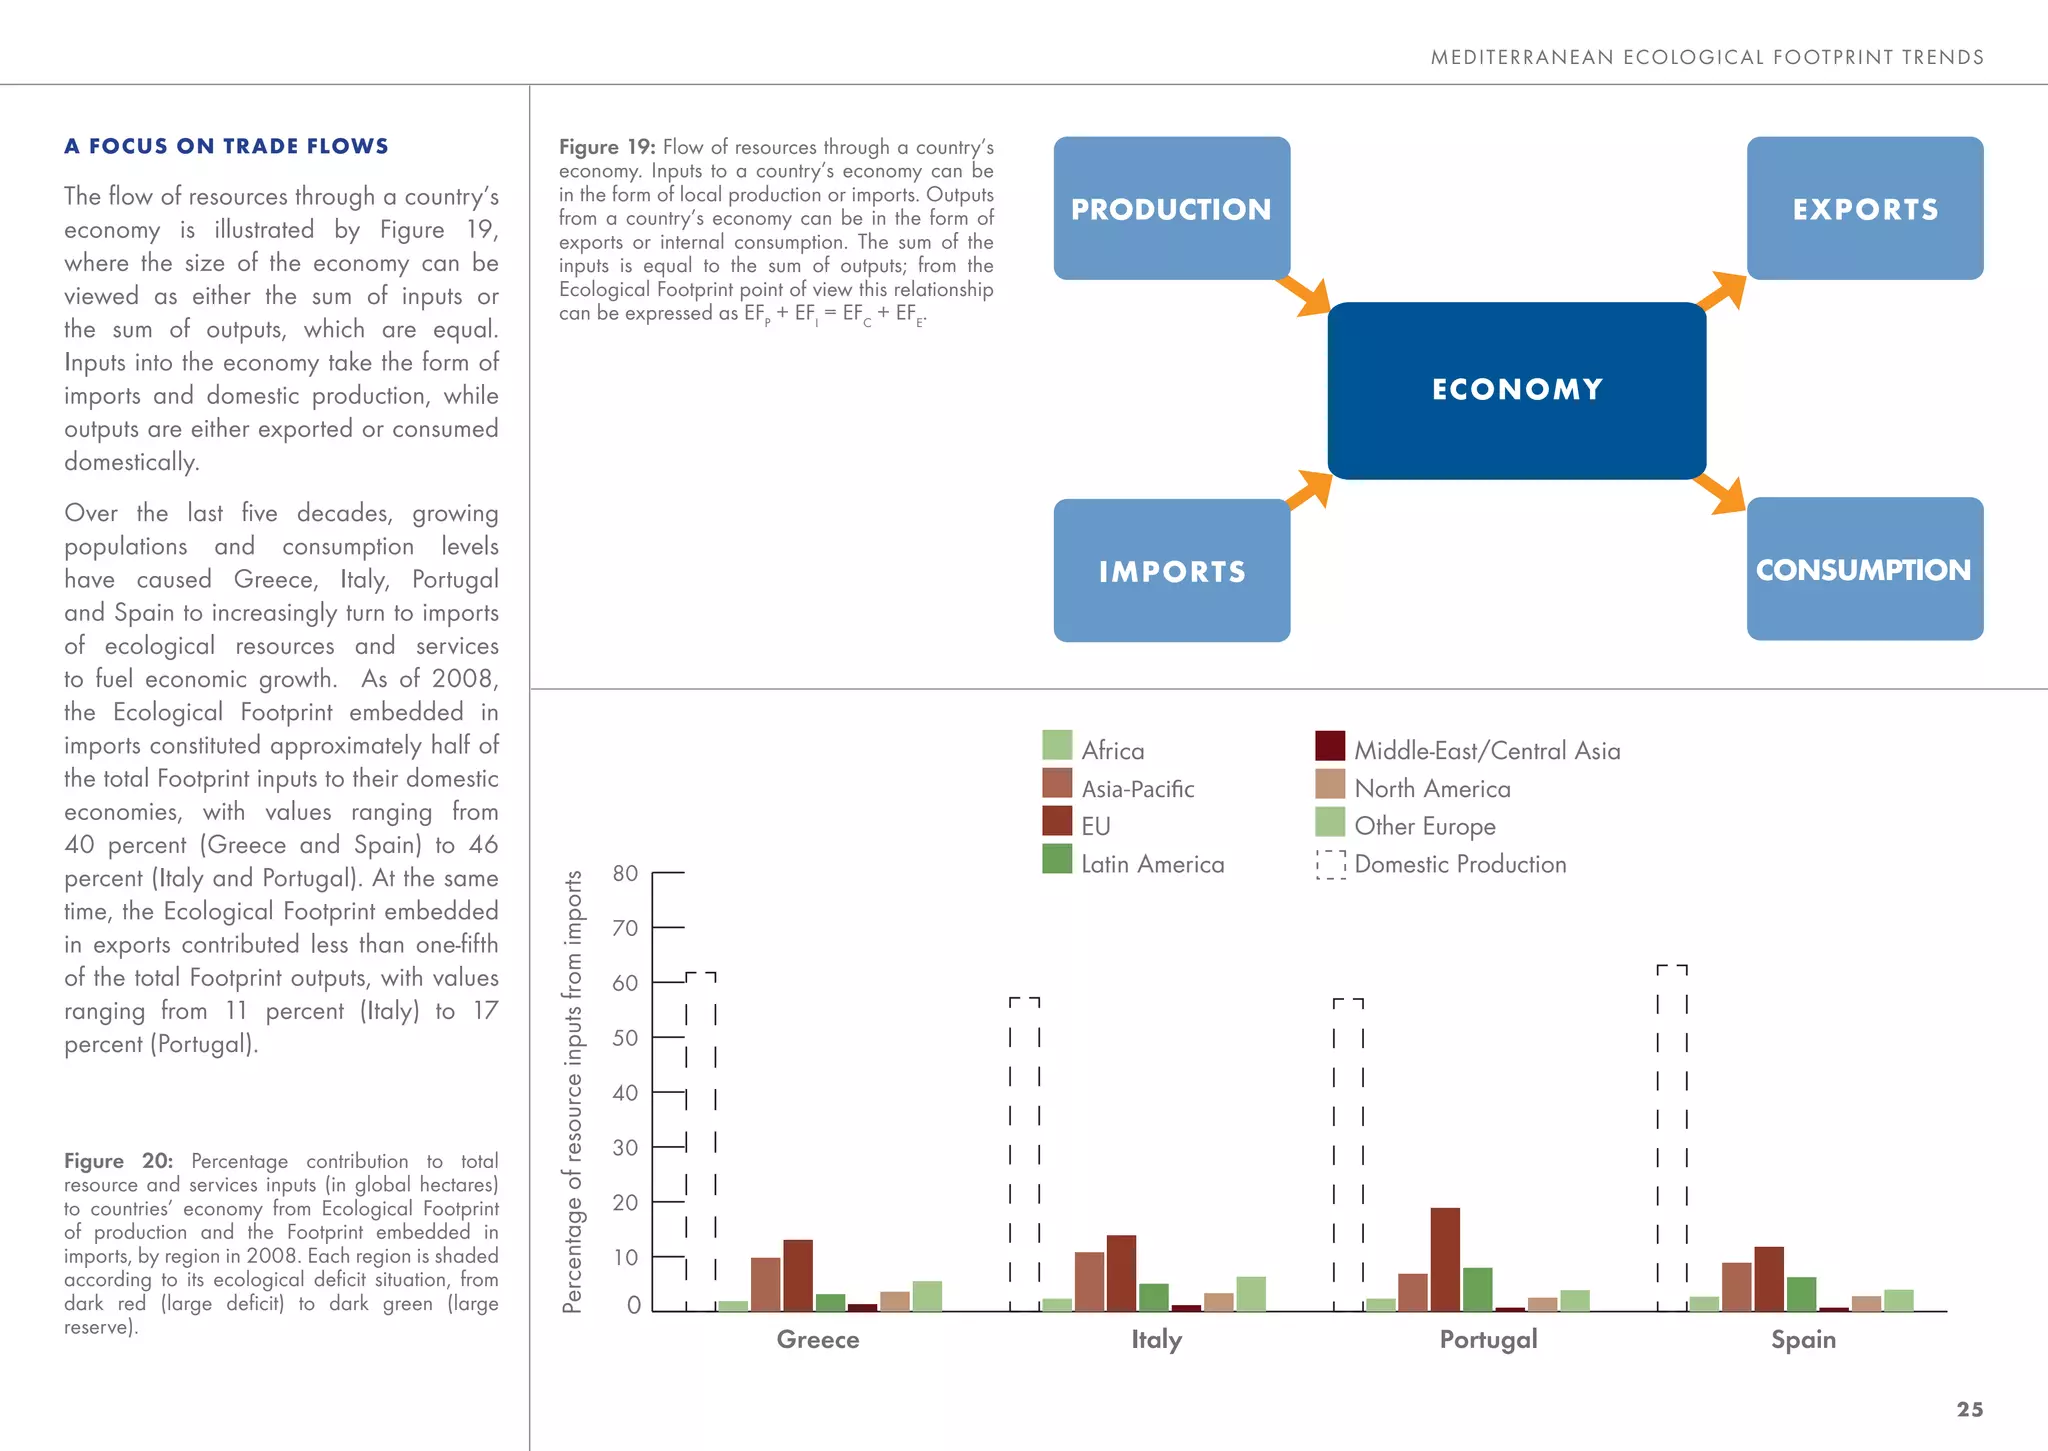
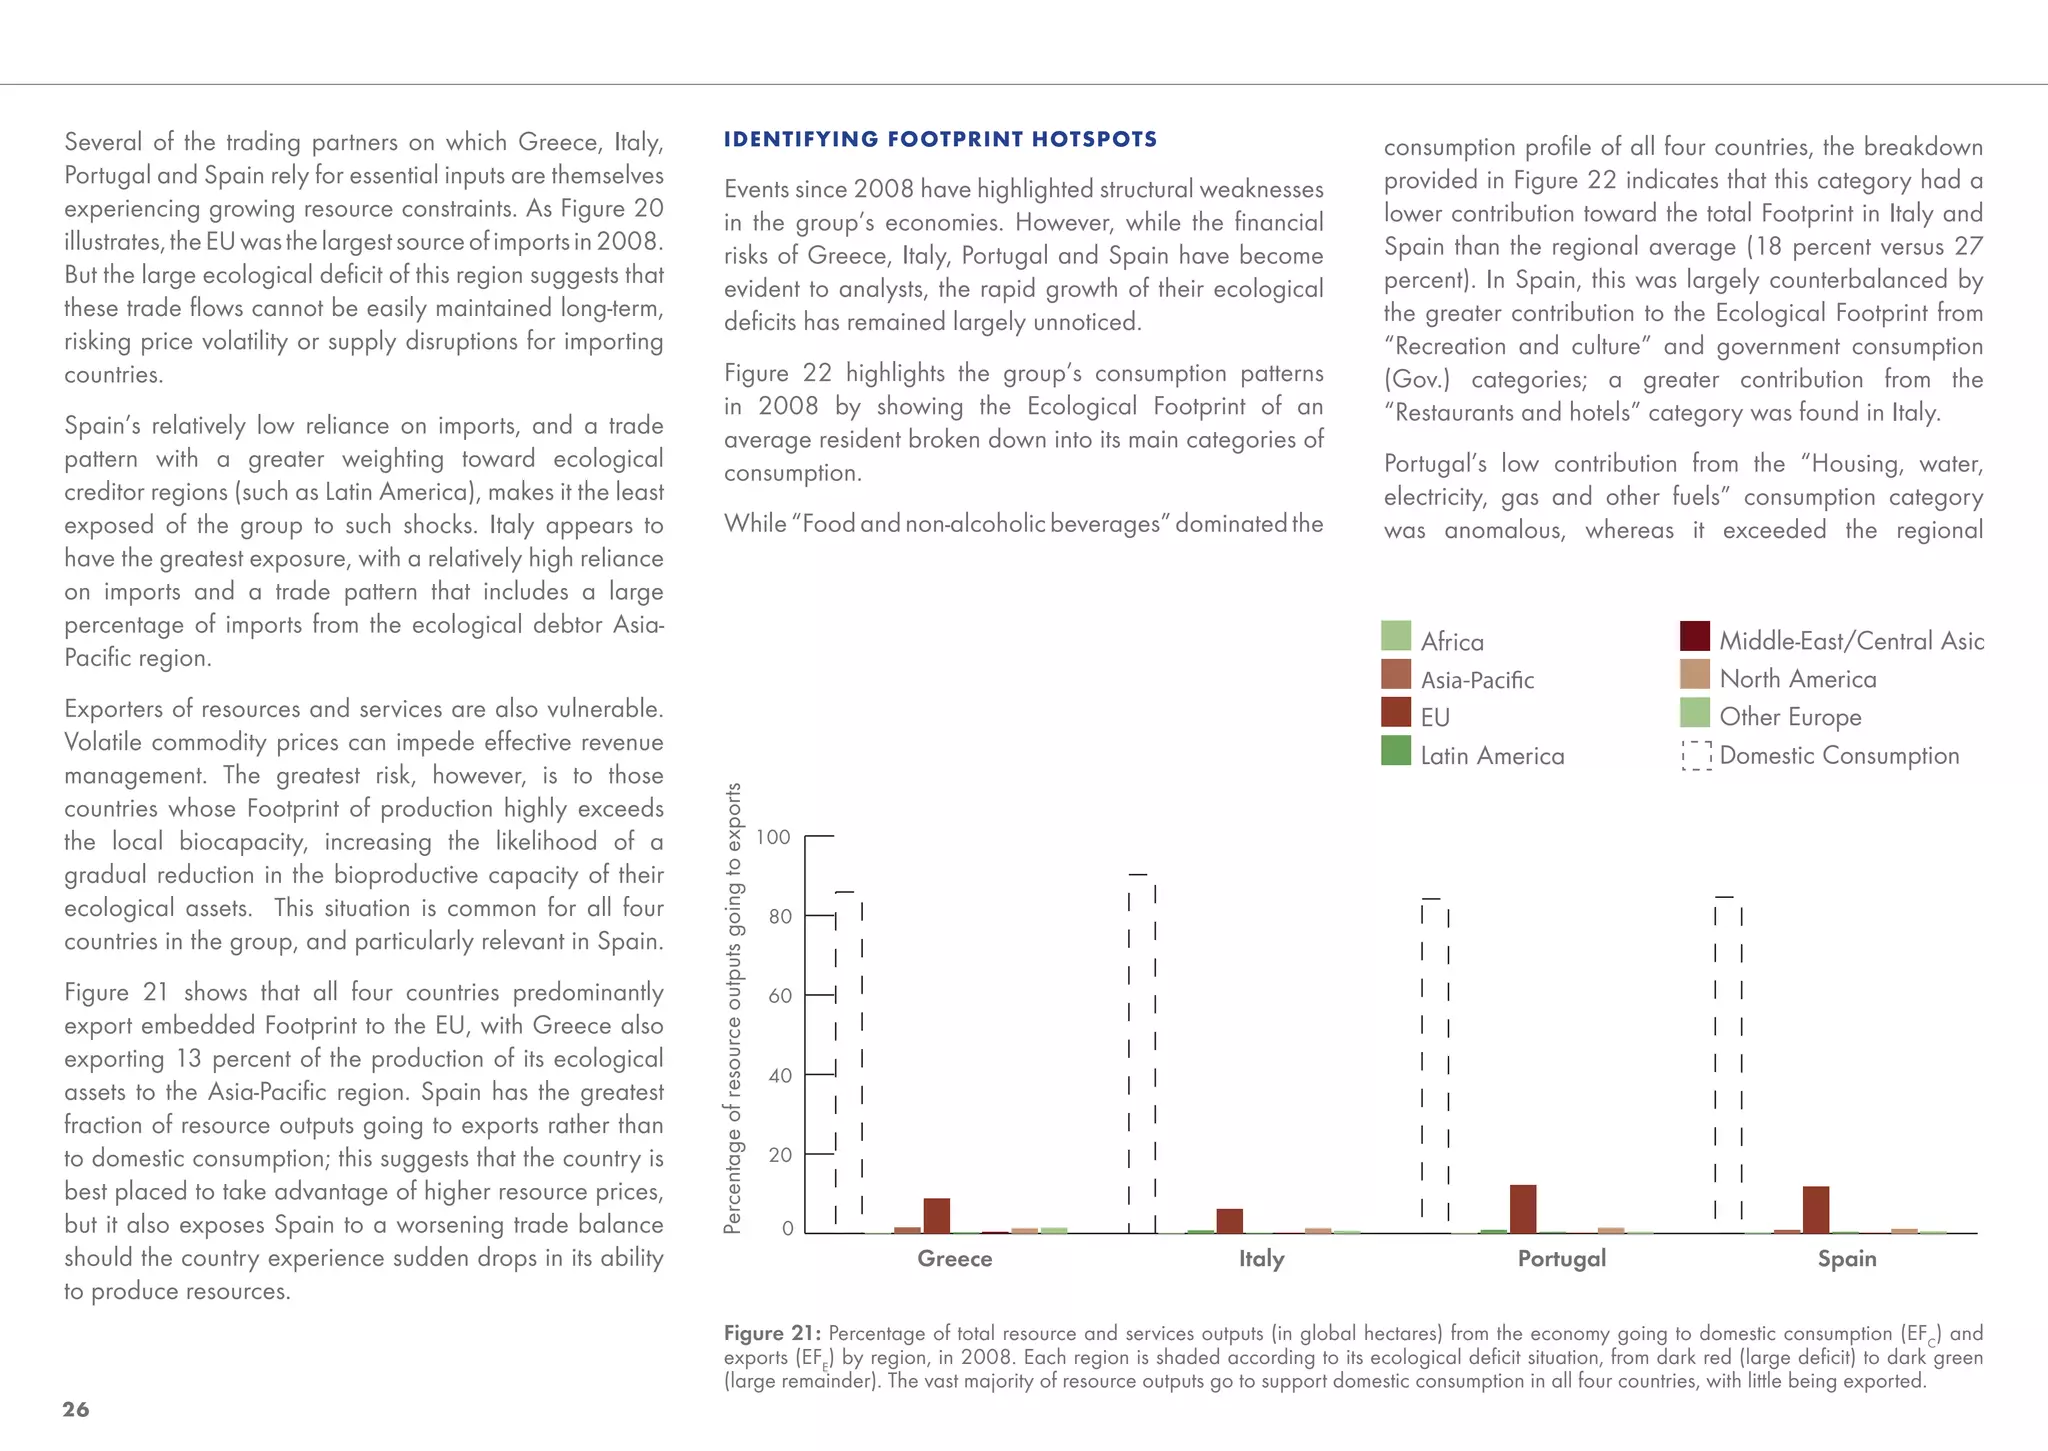
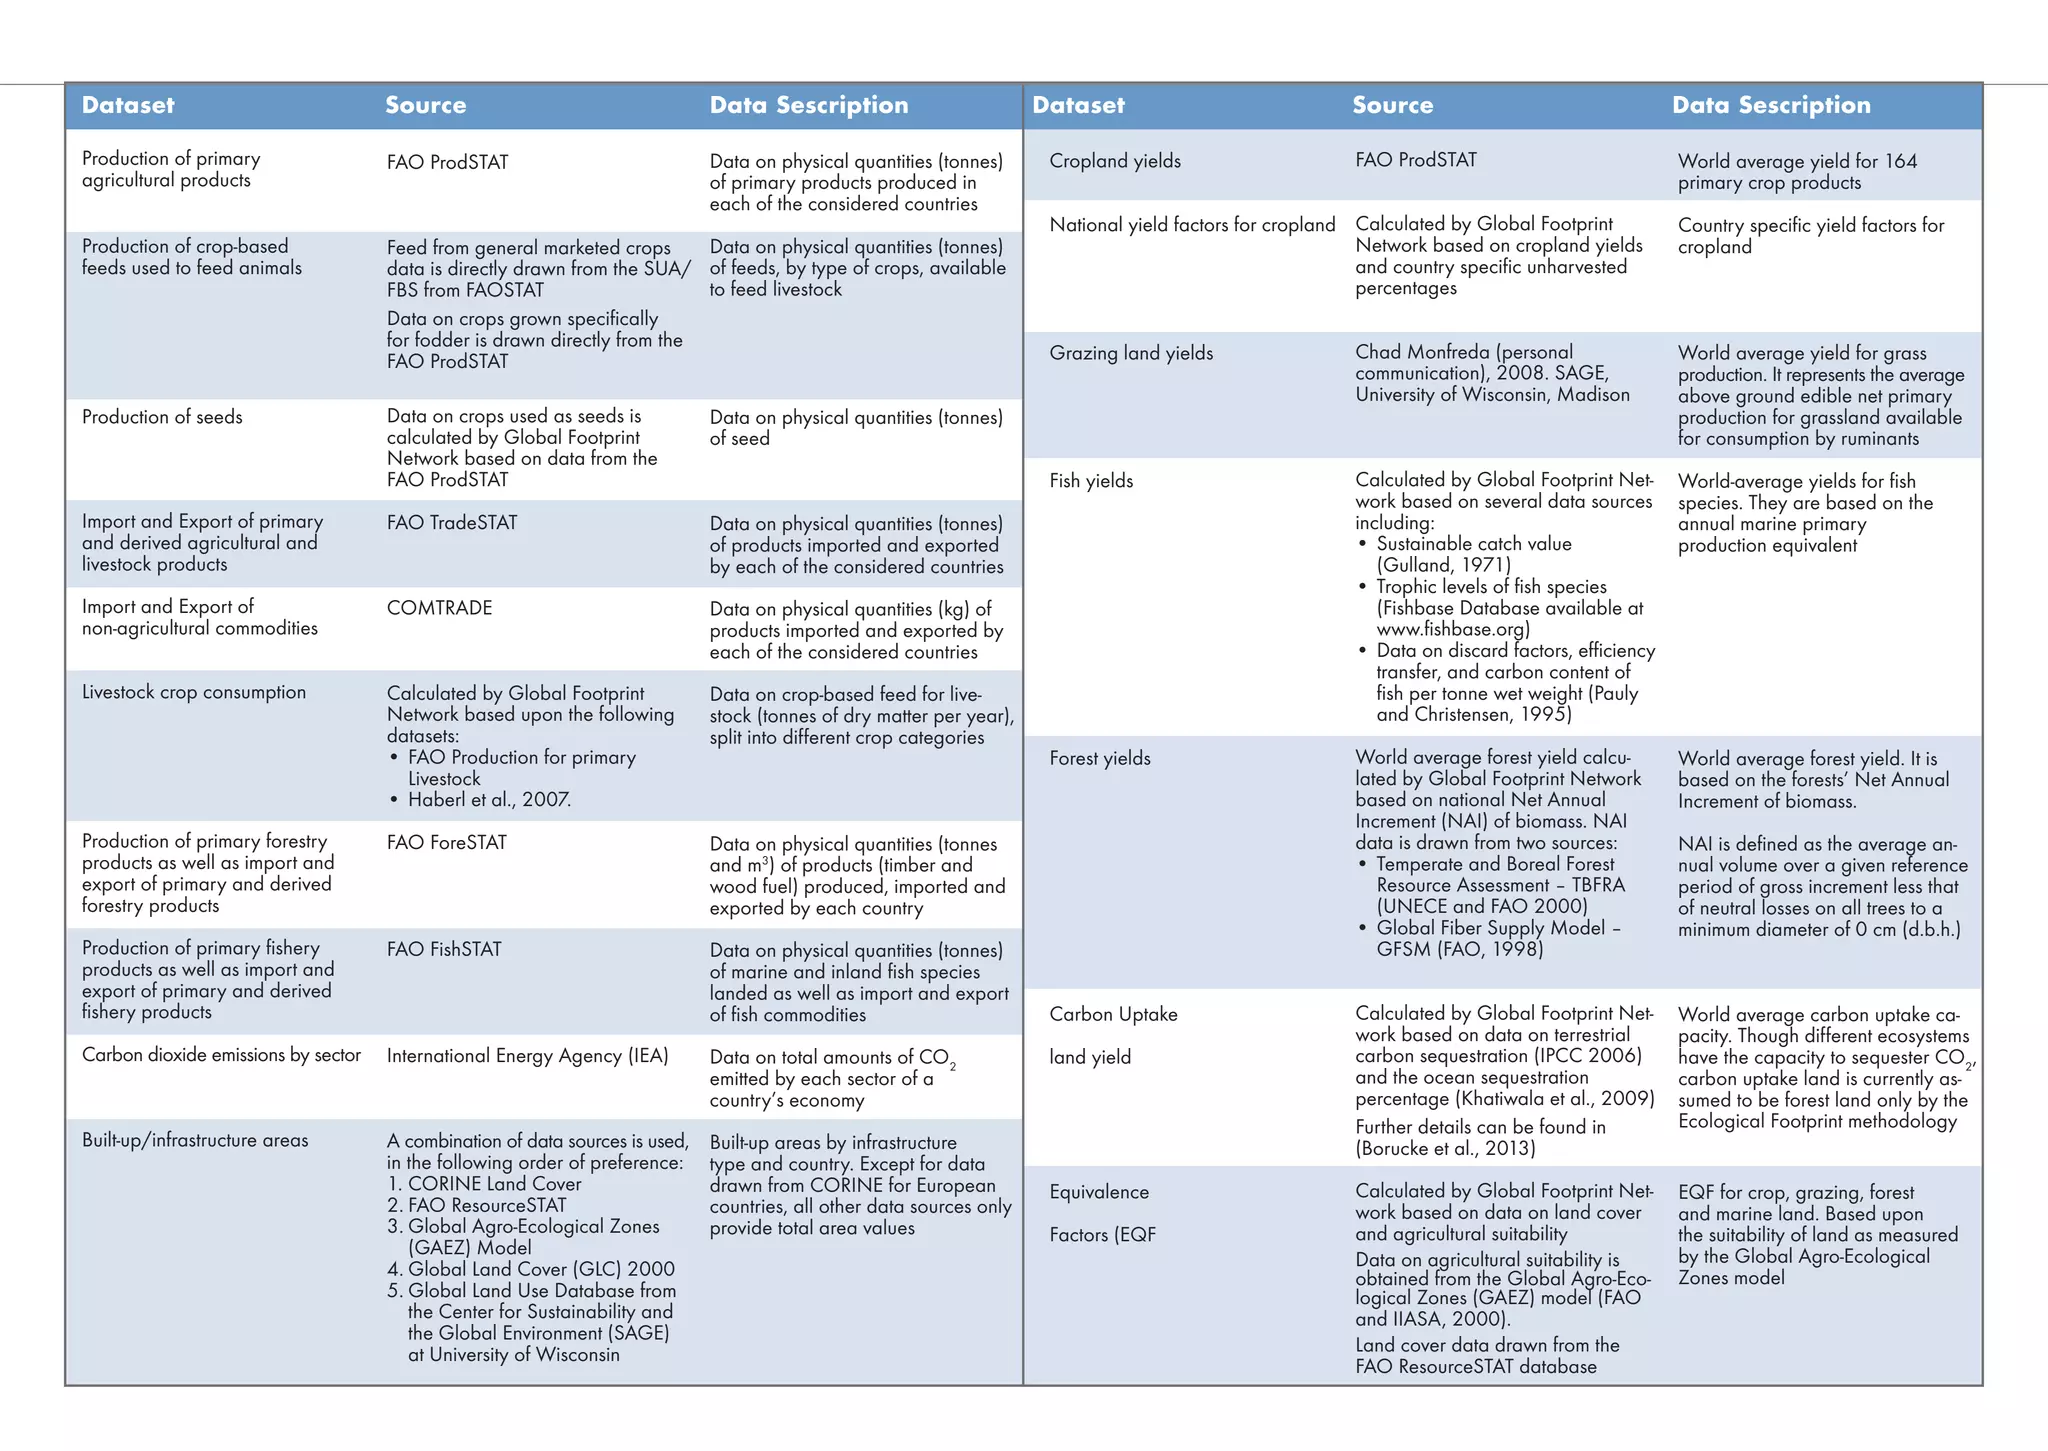
This document analyzes trends in ecological footprints in the Mediterranean region. It is a collaboration between Global Footprint Network, WWF Mediterranean, UNESCO Venice, Plan Bleu, and others. The document finds that the ecological footprints of Mediterranean nations now exceed the region's biocapacity by over 150%. Addressing ecological deficits and reducing fossil fuel dependence will help countries combat climate change and become more economically resilient by managing biocapacity and reducing demand on natural resources. Taking action now will be less costly than waiting, as countries can build economies that work with nature instead of against it.
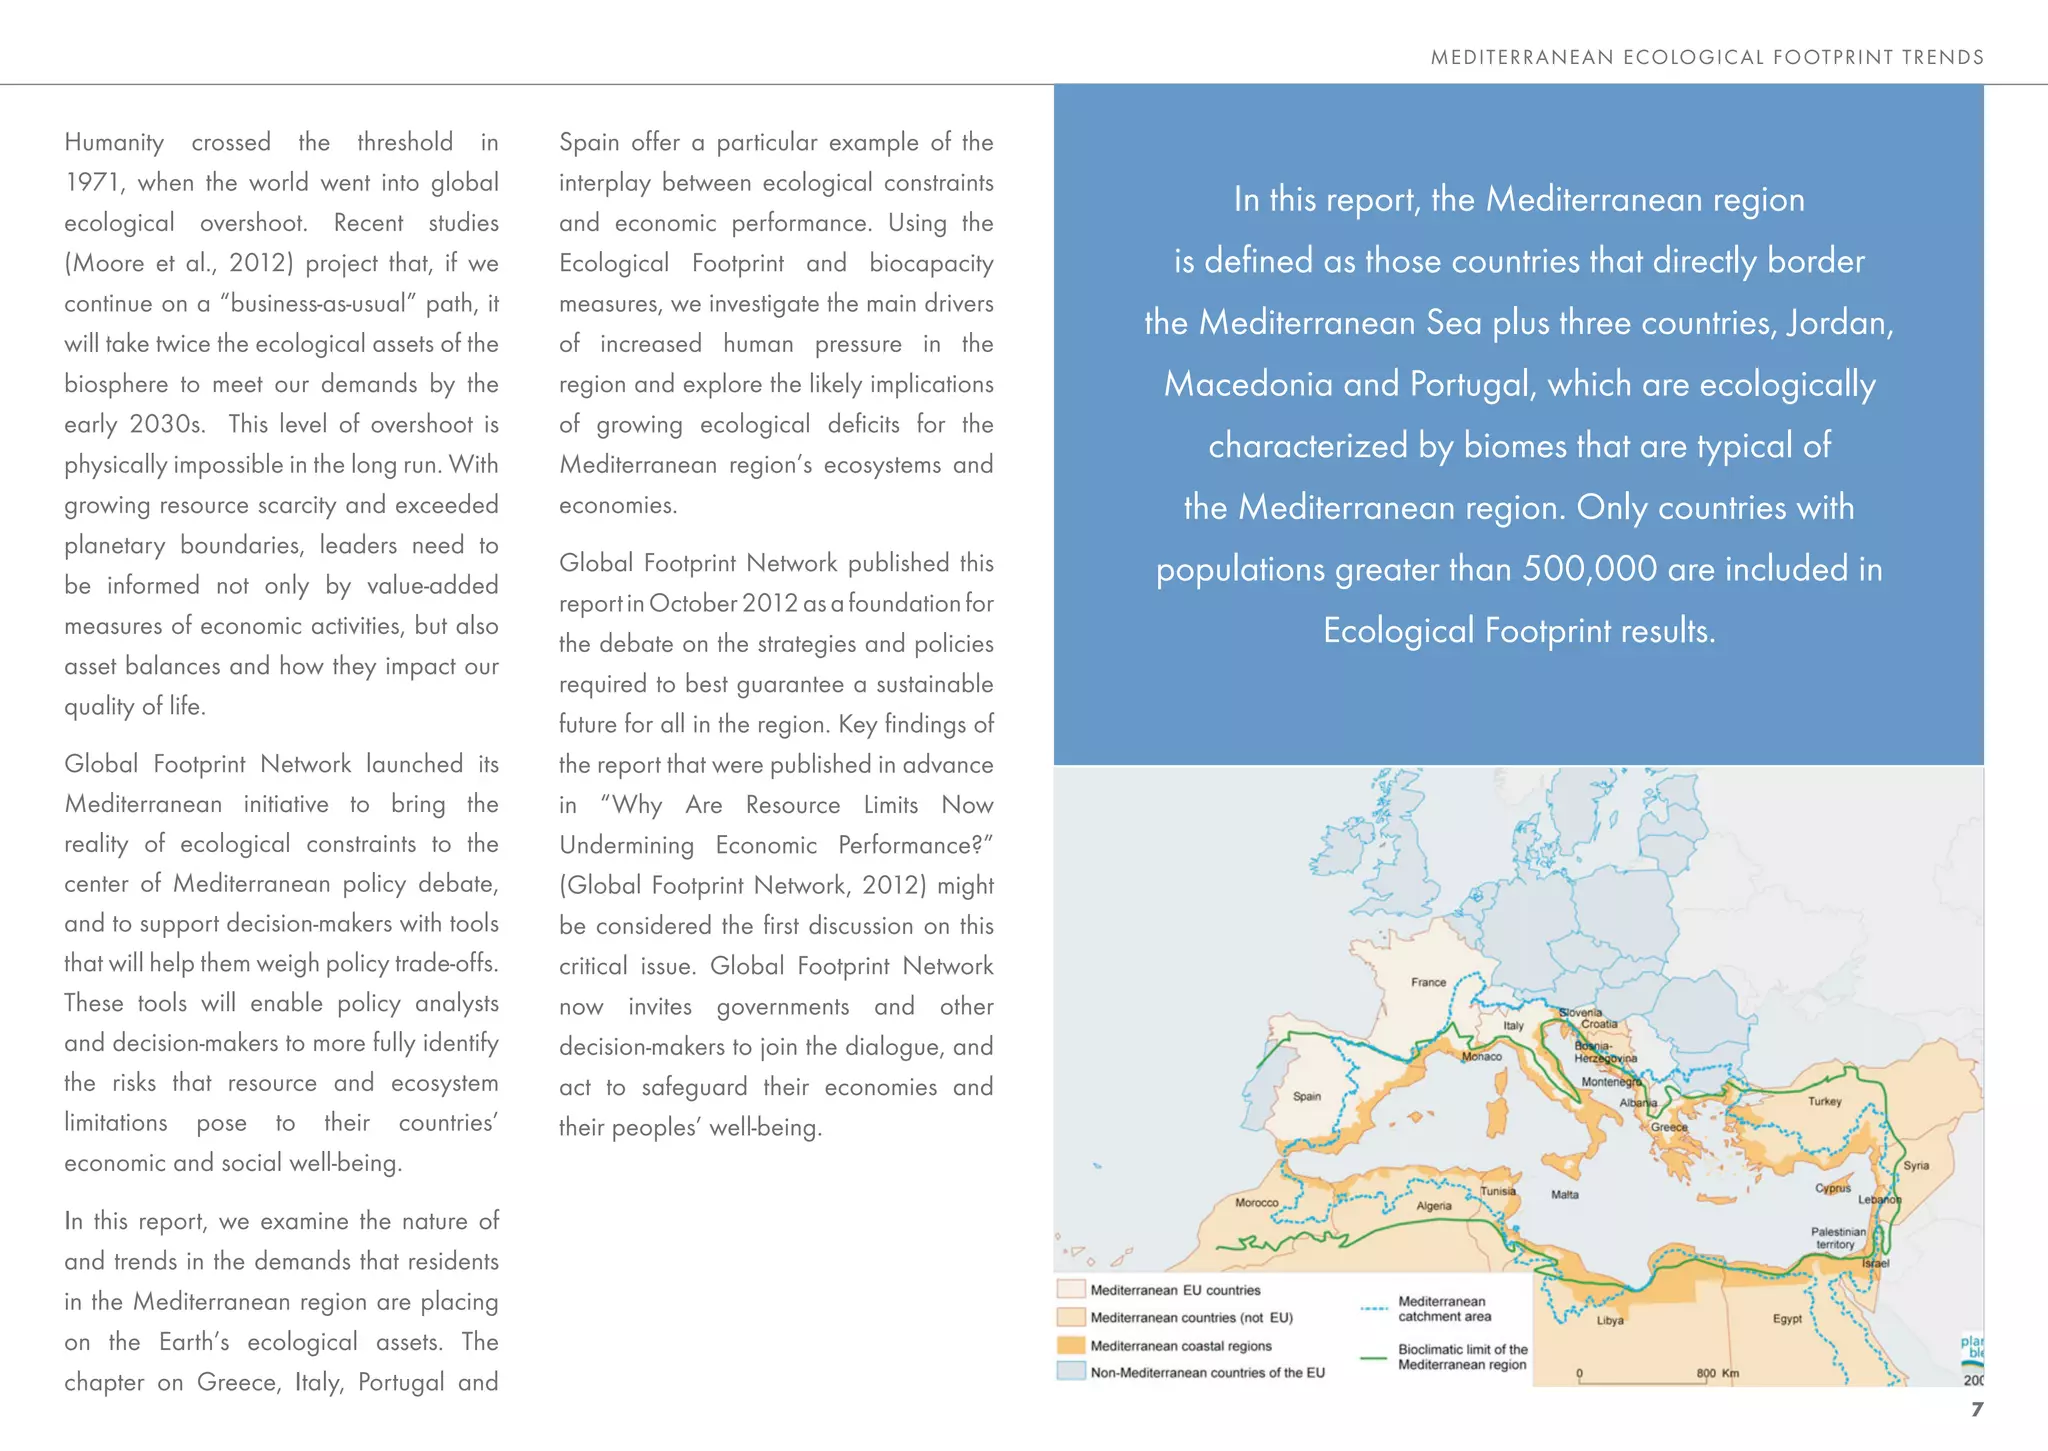

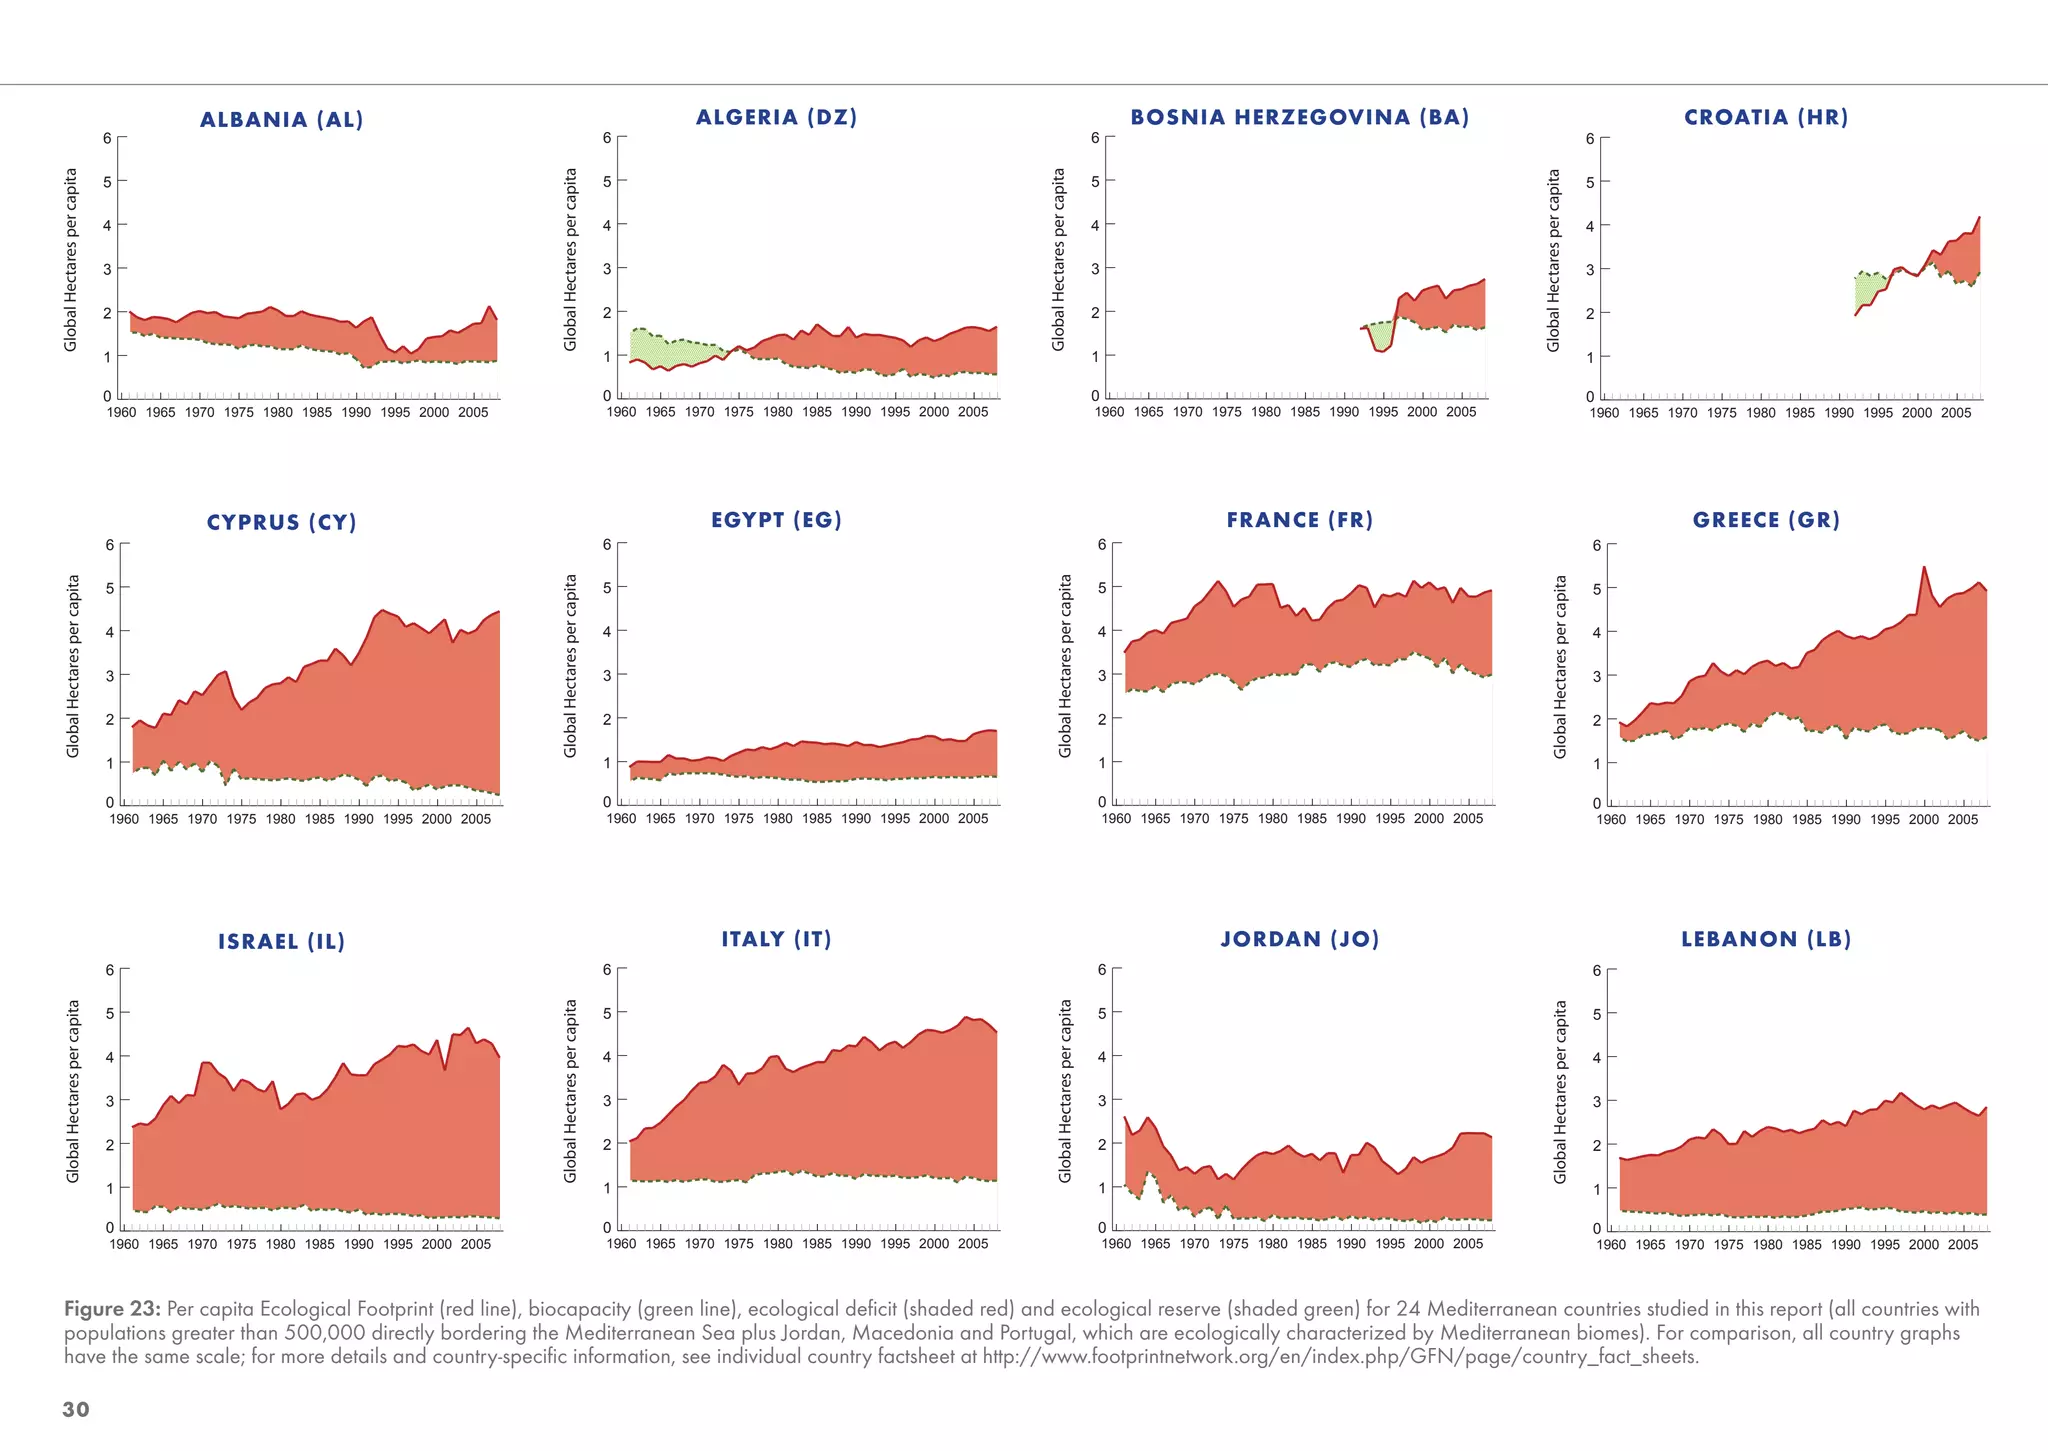
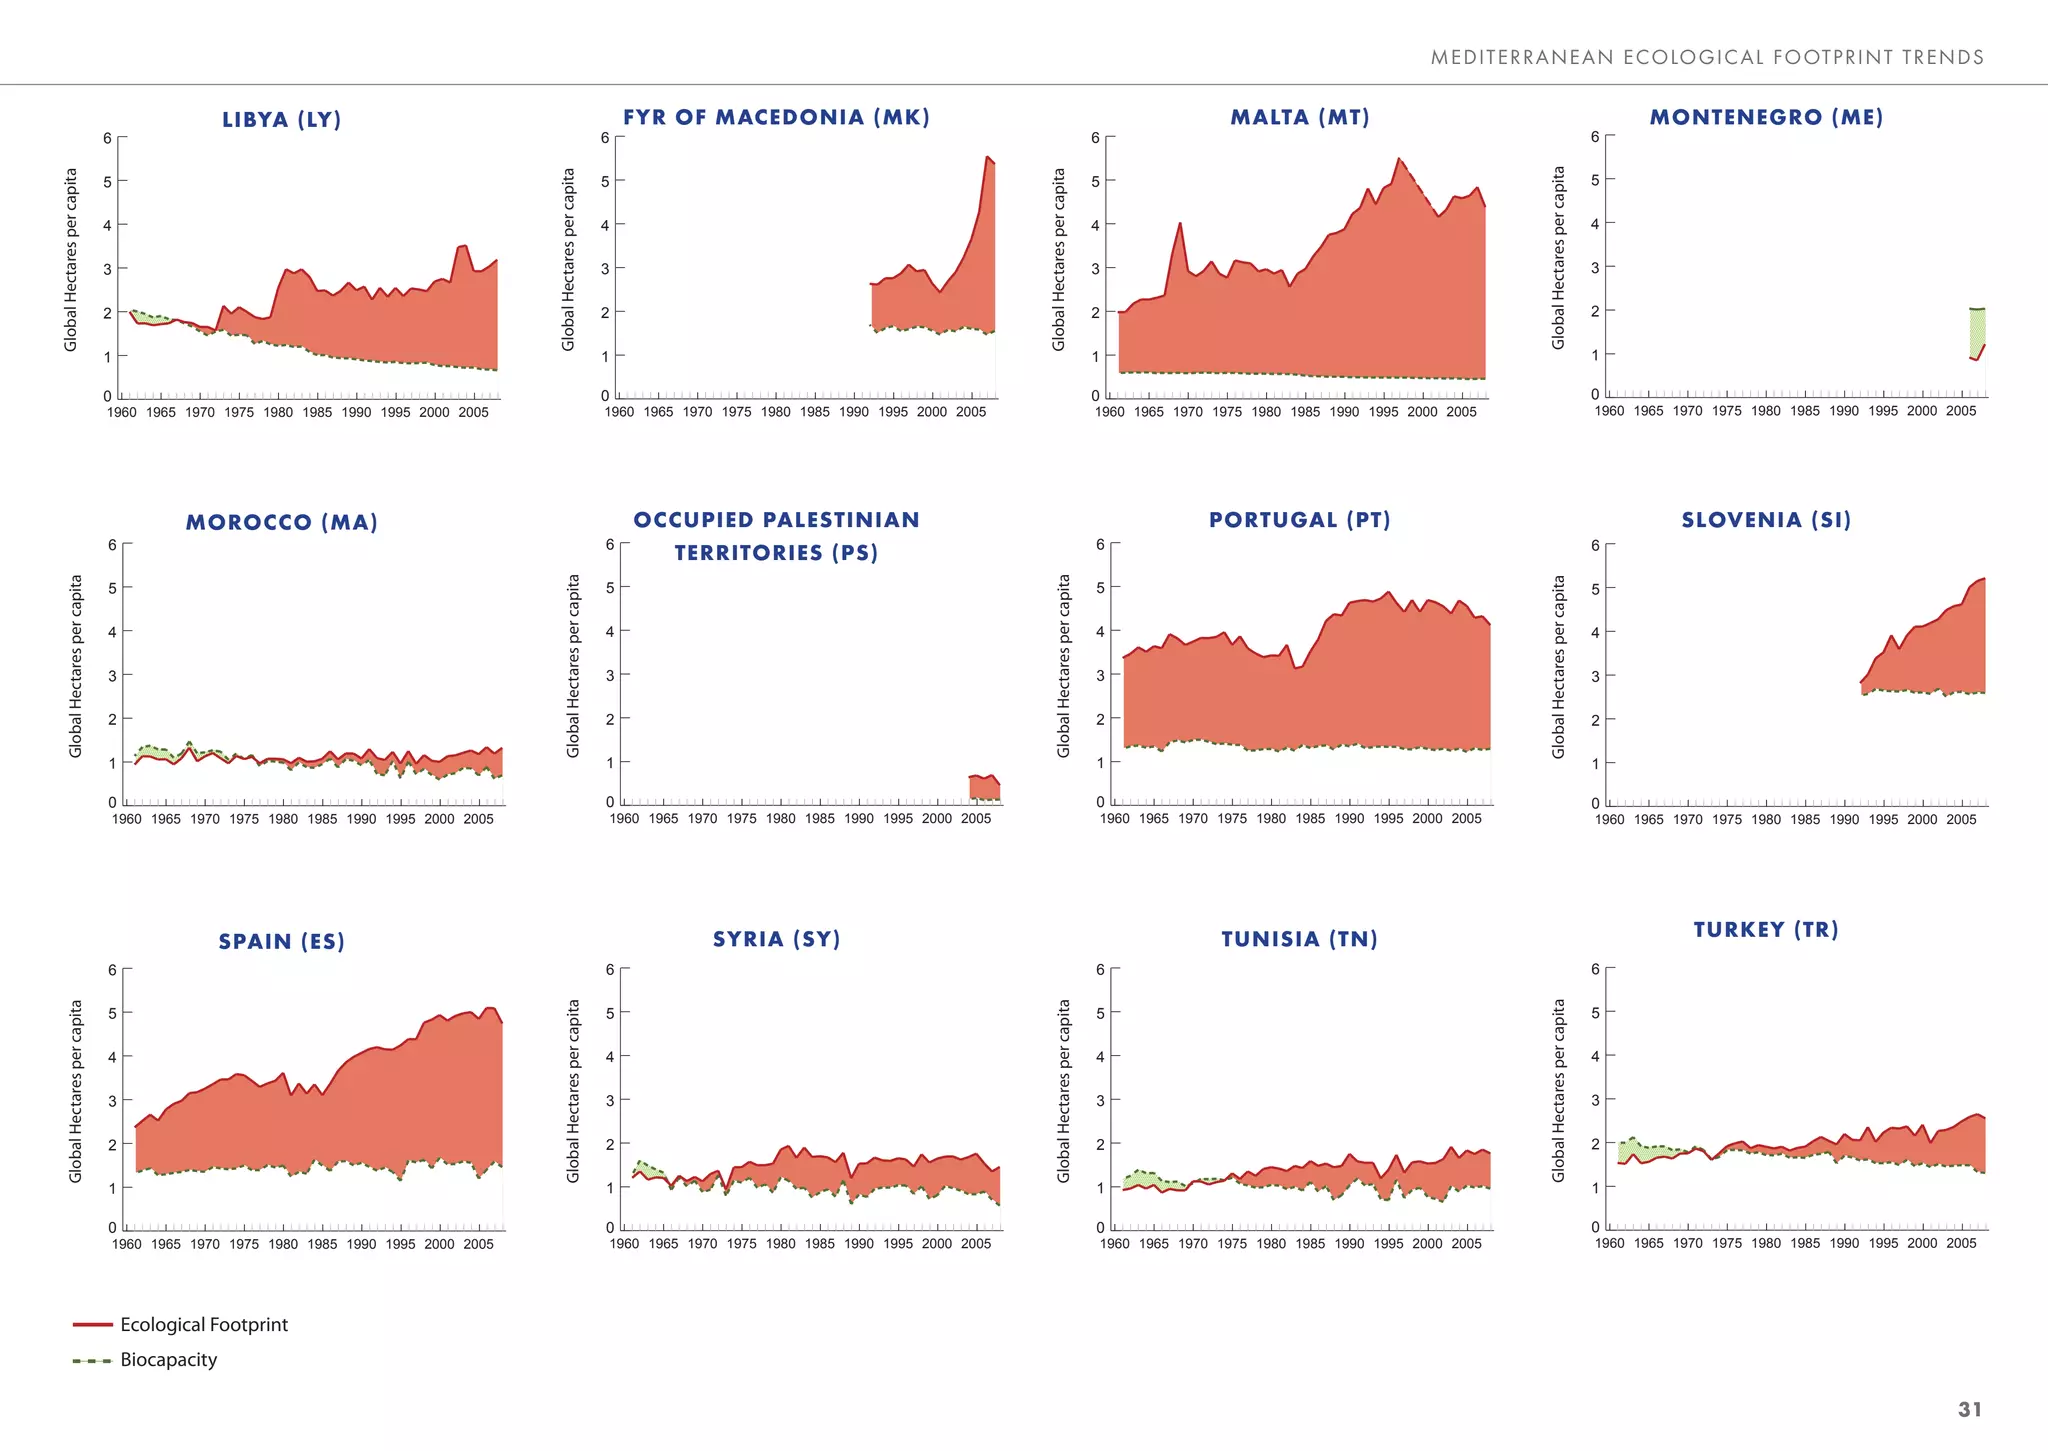
![ME DITE RRANEAN E CO LO GIC AL FO OTP RINT TRENDS
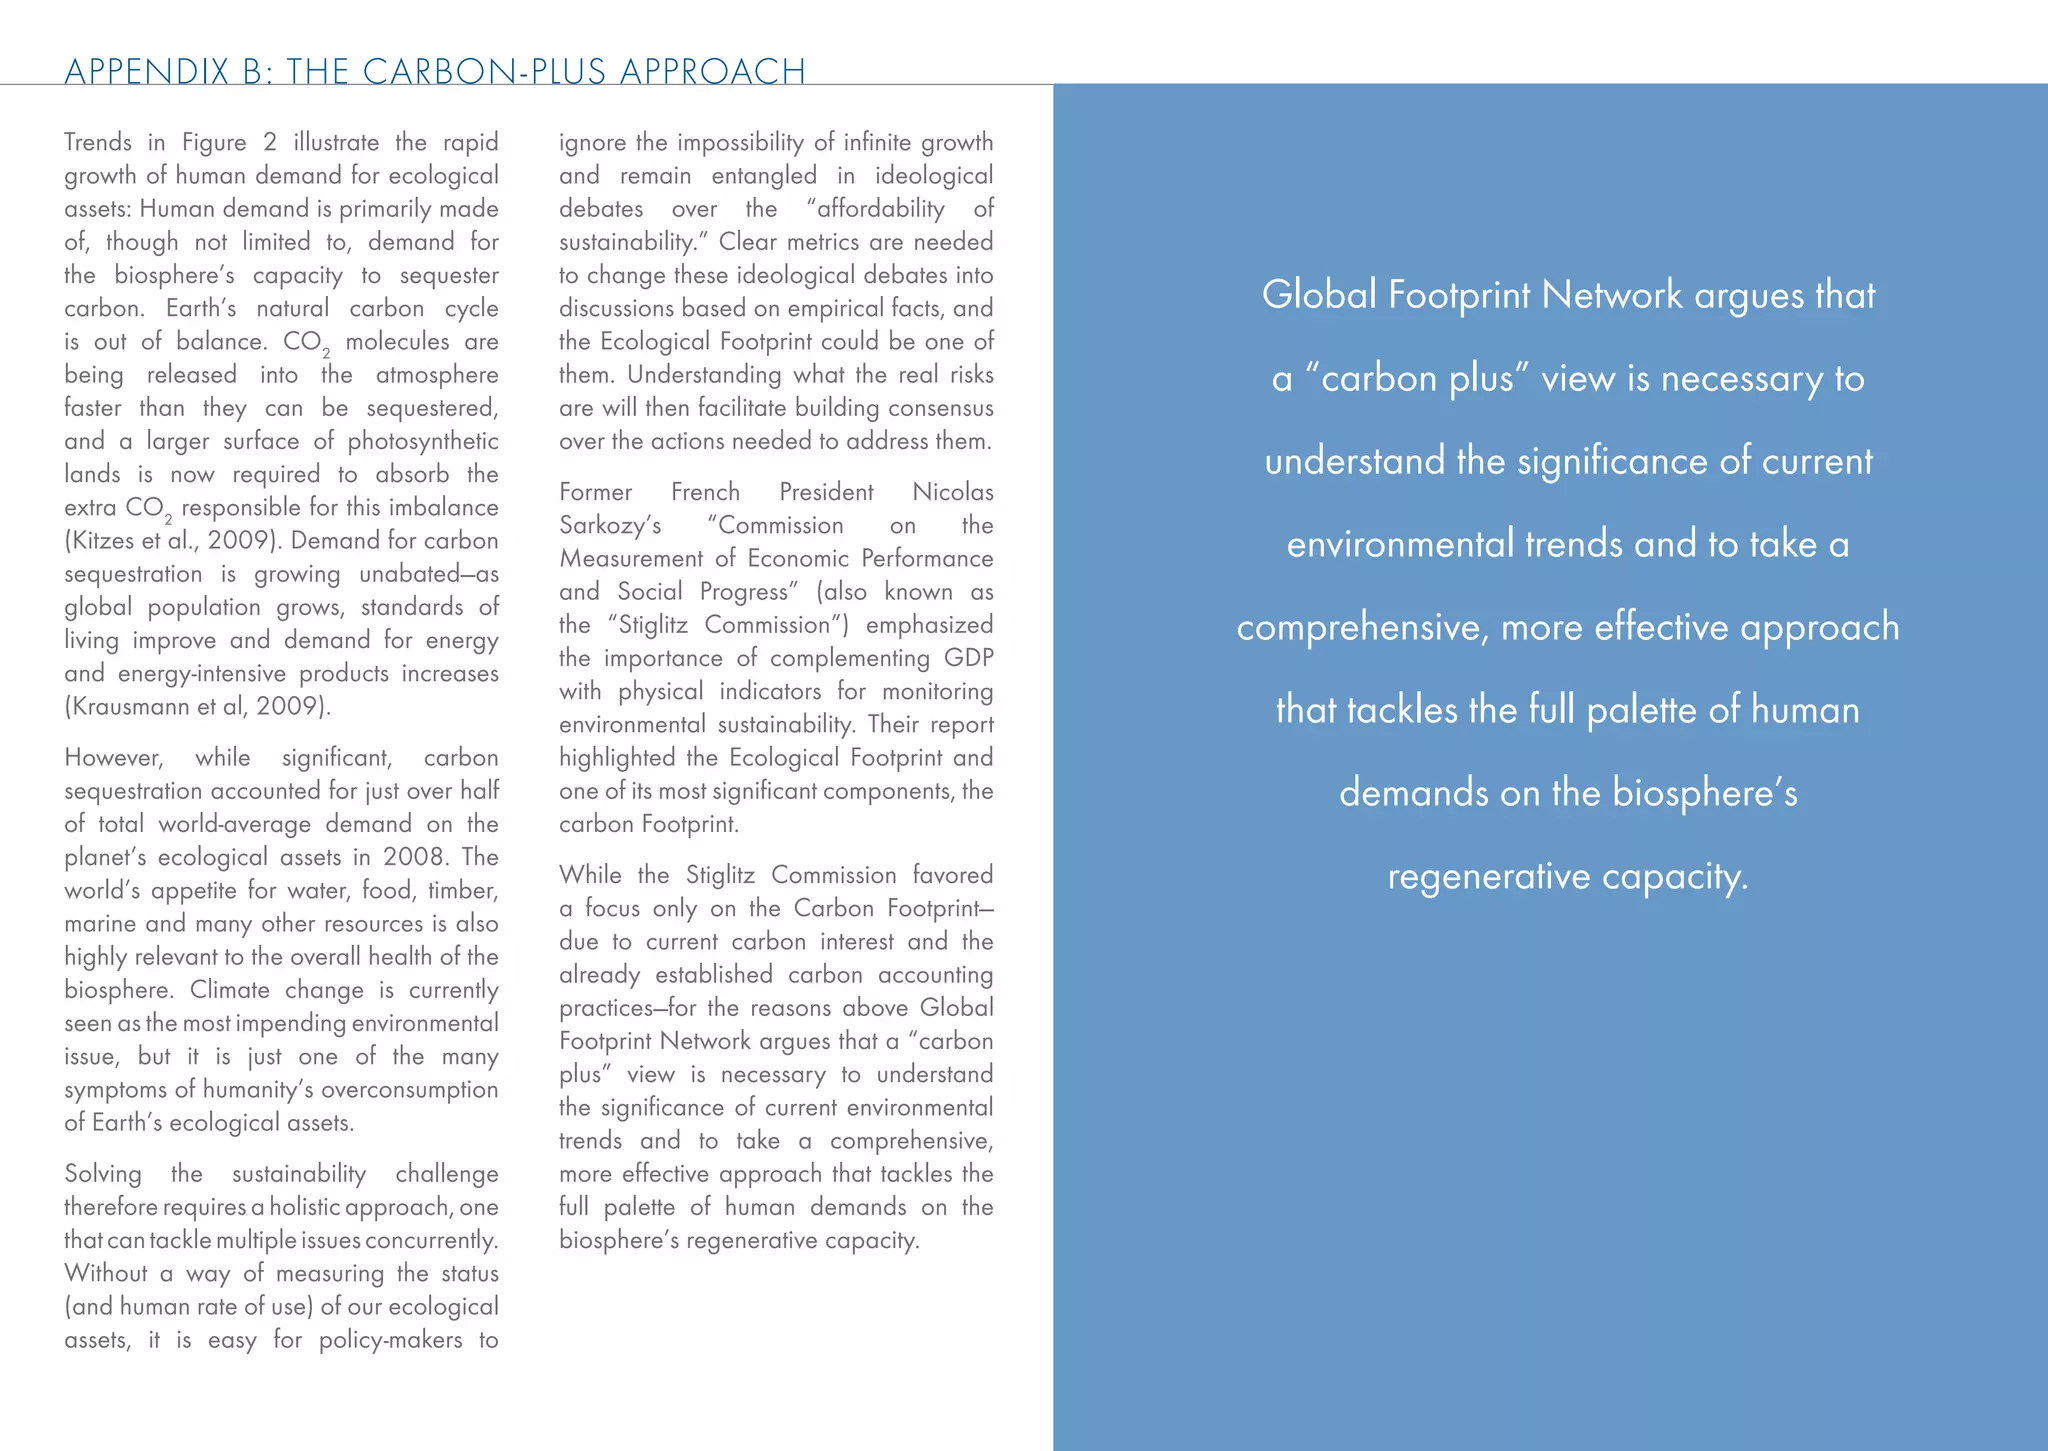
Ecological Deficit (Reserve) Financial Deficit (surplus)
ecosystems and biodiversity. The growing least partly due to ecological overshoot,
COUNTRY [Million gha] [Billion USD]
mismatch between global demand and as the economic sub-system is susceptible
supply of ecological resources and to changes in the availability of both Albania 3.0 2.0
services has led to a gradual tightening renewable and non-renewable resources. Algeria 37.4 (34.4)
of international commodity markets, Bosnia and Herzegovina 4.2 2.6
Non-renewable resources’ supply and Croatia 5.6 6.1
resulting in rising prices and heightened
demand are highly inelastic. Large Cyprus 4.5 3.9
price volatility.
price variations—as demonstrated by the Egypt 81.5 1.4
With consumption exceeding local international oil and mineral prices—are France 119.3 49.9
availability, dependence on biocapacity needed to balance supply and demand, Greece 37.7 51.3
from outside the region’s geographical especially for fossil fuels. Renewable Israel 26.0 (1.8)
boundaries will likely continue and natural resources, in contrast, have Italy 202.4 66.3
push the region to increasingly turn historically experienced supply increase Jordan 11.1 2.0
toward international trade for access to in response to additional demand, and Lebanon 10.2 4.1
ecological resources and services. But their prices are thus highly susceptible to Libya 15.5 (35.7)
Macedonia TFYR 7.8 1.2
as countries become more dependent on supply-demand imbalances.
Malta 1.6 0.5
external ecosystems, they expose their
The increasing scarcity of global Montenegro (0.5) -
economies to price volatility and possible
renewable resources—as well as the Morocco 19.6 4.5
supply disruption. Access to ecological 31.9
increased price of fossil resources Portugal 30.0
resources and services become subject not Slovenia 5.3 3.8
only to “physical limits” (the total amount used for their extraction—caused prices
Spain 148.1 154.5
globally available) but also “economic to reach historic highs in 2008. As
Syria 17.4 (0.5)
limits” (the ability of countries to purchase global renewable resource availability 1.7
Tunisia 8.3
these resources and services). diminishes and oil prices keep climbing, Turkey 88.5 41.5
this volatility will increase, with severe
Over the last five decades, many of the implications for the trade balance Table 2: Ecological assets balance and current account balance for each Mediterranean country, in
world’s limited resources have become of many Mediterranean countries. 2008. Ecological assets balance values are calculated as total Ecological Footprint of consumption minus
more expensive (World Bank, 2012). total biocapacity. Current account balance values are drawn from the World Bank (2011). No data were
available for the Occupied Palestinian Territories.
Prices have become highly reactive to The degree of dependence on external
supply-demand imbalances. During the ecological assets for imports of resources income (or GDP levels) by liquidating ecological services, as well as weakened
Russian droughts and wildfires of 2010, makes responding to important price their ecological or financial assets, or financially through large debts, will
a drop in grain production led to a 70 hikes challenging and could further both. Table 2 shows the ecological assets face growing difficulties in accessing
percent increase in wheat prices over a negatively affect a country’s capacity to balance and the current account balance the required resources and services.
single month. The drought experienced by maintain its economic output. Over the for each Mediterranean country in 2008. This might have crippling effects for its
the U.S. Midwest in the summer of 2012 past few decades, economic success Results show that ecological deficits are future economic performance. To ensure
will also likely impact prices. Such price or has translated into higher resource coupled with fiscal deficits (indicated long-term economic prosperity and
supply shocks can cause severe economic consumption levels that are no longer by the negative account balance) in the competitiveness, decisions are needed
imbalances in countries and sometimes sustainable. Countries’ efforts to drive majority of the Mediterranean countries. that recognize ecological assets—both
lead to social unrest. The high volatility their competitive advantage could lead to Any economic actor who is both highly dependence on and access to—as among
of commodity prices in recent years is at a race to disaster, as they maintain their dependent on external resources and the key drivers of economic success.
21](https://image.slidesharecdn.com/mediterraneanreportfinal-121025041137-phpapp02/75/Mediterranean-report-final-23-2048.jpg)

![ME DITE RRANEAN E CO LO GIC AL FO OTP RINT TRENDS
Robinson, J., Bradley, M., Busby, Mediterranean, UNEP/MAP, Athens, at http://data.worldbank.org/
P., Connor, D., et al., 2006. Climate October 2009. data-catalog/commodity-price-data
Change and Sustainable Development: [Accessed May 2012].
UNEP/MAP-Plan Bleu , Benoit
Realizing the Opportunity. Ambio, 35(1),
Guillaume (dir.), Comeau Aline (dir.)
2-8.
(2005). A sustainable future for
Rockström, R., Steffen, W., Noone, the Mediterranean: the Blue Plan’s
K., Persson, A., et al., 2009. A safe environment and development outlook.
operating space for humanity. Nature, Earthscan
461, 472-475.
Wackernagel, M., B. Schulz, D.
Sen, A. 2001. Development as freedom. Deumling, A. Callejas Linares, M.
Oxford University Press, Oxford. Jenkins, V. Kapos, C. Monfreda, J. Loh,
N. Myers, R. Norgaard and J. Randers.
Turner, G.H., 2008. A comparison of
2002. Tracking the ecological overshoot
The Limits to Growth with 30 years of
of the human economy. Proc. Natl. Acad.
reality. Global Environmental Change,
Sci., 99(14), 9266-9271.
18, 397-411.
Wackernagel, M., L. Onisto, P.
UNDP (United Nations Development
Bello, Al. C. Linares, I. S. L. Falfán, J.
Programme), 2011. Human Development
M. García, A. I. S. Guerrero, Ma. G.
Report 2011. Sustainability and Equity:
S. Guerrero. 1999a. National natural
A Better Future for All. Published for the
capital accounting with the ecological
United Nations Development Programme
footprint concept. Ecological Economics,
(UNDP).
29, 375-390.
UNEP (United Nations Environment
Wackernagel, M., Lewan, L.,
Programme), 2007. GEO4 Global
Hansson, C.B., 1999b. Evaluating the
Environment Outlook: environment for
use of natural capital with the ecological
development. Progress Press Ltd, Malta.
footprint. Ambio, 28, 604–612.
UNEP Mediterranean Strategy for
World Bank, 2011. World
Sustainable development: a framework
Development Indicators & Global
for environmental sustainability and
Development Finance (World
shared prosperity. Mediterranean Action
Plan (MAP), Mediterranean Commission Bank, Washington, DC, December
on Sustainable Development (MCSD), 2011. Available at: http://databank.
2006 worldbank.org.
UNEP/MAP-Plan Bleu State of the World Bank, 2012. Commodity Price
Environment and Development in the Data (a.k.a. Pink Sheet). Available
41](https://image.slidesharecdn.com/mediterraneanreportfinal-121025041137-phpapp02/75/Mediterranean-report-final-43-2048.jpg)
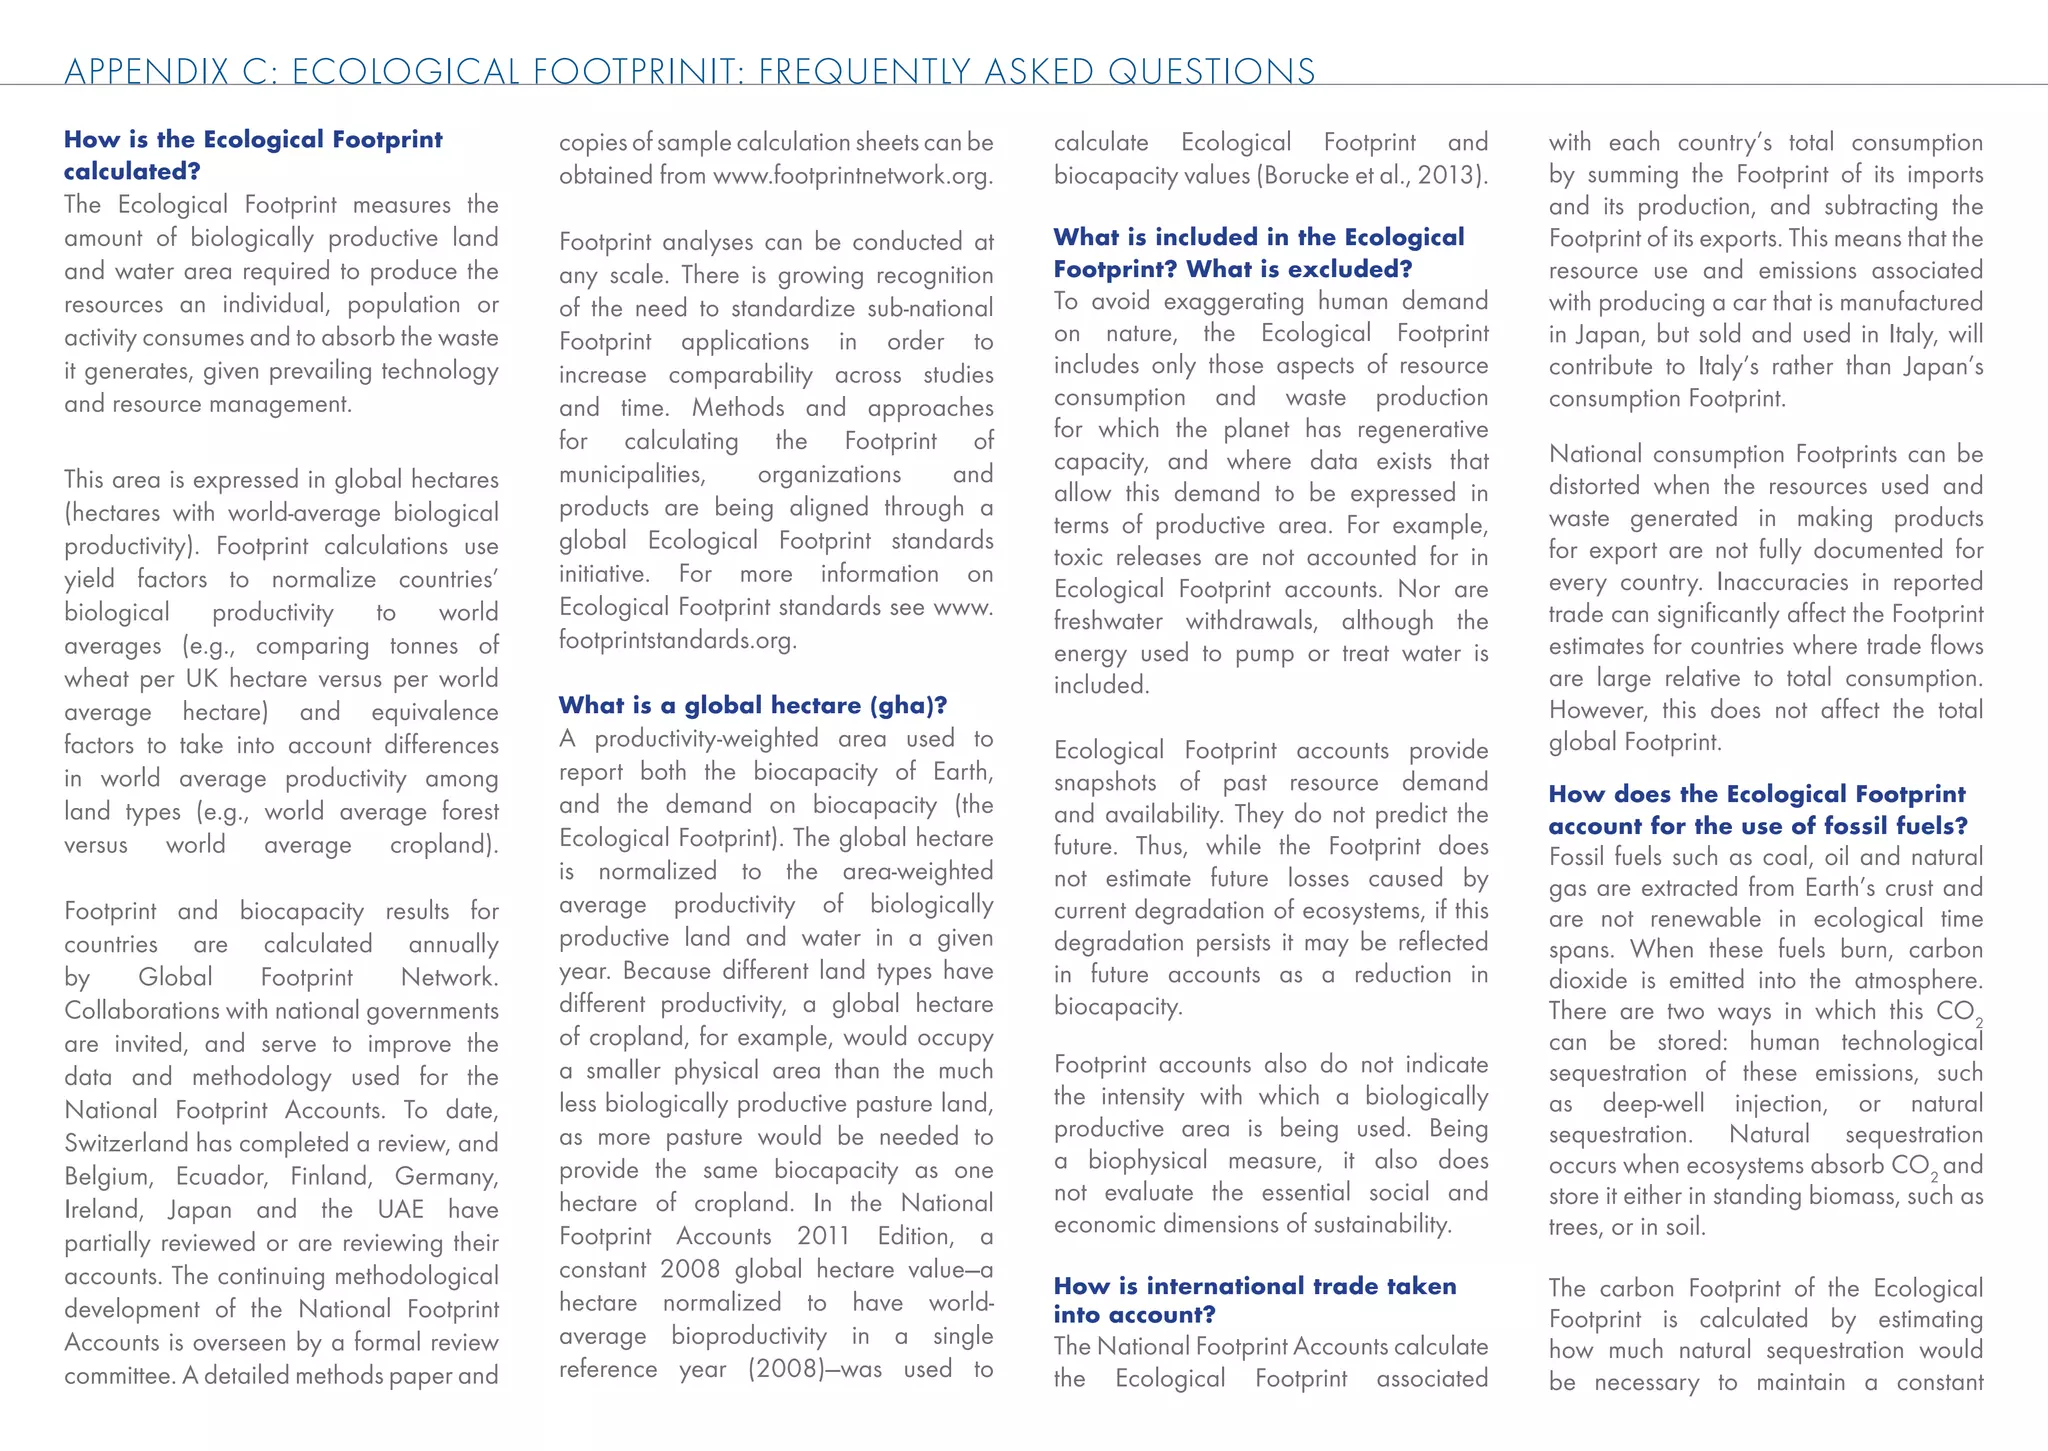
![E C O LO G I C A L F O OTPR I NT C O M PO NE NTS
Total Per capita Fishing
Ecological Ecological Cropland Grazing land Forest ground Carbon Built up
C O U N T RY Population Footprint Footprint Footprint Footprint Footprint Footprint Footprint Footprint
[-] [million gha] [gha per capita] [gha per capita] [gha per capita] [gha per capita] [gha per capita] [gha per capita] [gha per capita]
Albania 3,181,000 5.76 1.81 0.71 0.21 0.09 0.02 0.71 0.06
Algeria 34,428,000 56.74 1.65 0.51 0.35 0.13 0.02 0.62 0.02
Bosnia and Herzegovina 3,774,000 10.34 2.74 0.78 0.22 0.48 0.04 1.16 0.05
Croatia 4,418,000 18.53 4.19 1.02 0.13 0.66 0.07 1.89 0.43
Cyprus 1,077,000 4.78 4.44 1.19 0.23 0.41 0.07 2.54 0.00
Egypt 78,323,000 132.80 1.70 0.66 0.07 0.16 0.03 0.59 0.18
France 62,098,000 304.96 4.91 1.25 0.39 0.60 0.18 2.24 0.25
Greece 11,292,000 55.57 4.92 1.26 0.53 0.38 0.13 2.53 0.11
Israel 7,092,000 28.07 3.96 0.86 0.36 0.33 0.01 2.33 0.06
Italy 59,891,000 271.00 4.52 1.03 0.40 0.46 0.14 2.39 0.10
Jordan 5,849,000 12.46 2.13 0.66 0.41 0.18 0.05 0.74 0.09
Lebanon 4,167,000 11.87 2.85 0.66 0.48 0.28 0.05 1.33 0.05
Libya 6,150,000 19.60 3.19 0.65 0.54 0.12 0.04 1.82 0.02
Macedonia TFYR 2,053,000 11.01 5.36 0.79 0.21 0.33 0.07 3.87 0.09
Malta 414,000 1.81 4.38 0.77 0.76 0.31 - 2.55 -
Montenegro 629,000 0.77 1.22 0.31 0.32 0.48 0.11 - -
Morocco 31,321,000 41.45 1.32 0.60 0.21 0.06 0.05 0.37 0.03
Occupied Palestinian Territories 3,827,000 1.77 0.46 0.33 0.05 - 0.00 0.09 -
Portugal 10,635,000 43.78 4.12 0.96 - 0.14 0.95 2.01 0.05
Slovenia 2,018,000 10.52 5.21 0.94 0.25 0.61 0.04 3.22 0.15
Spain 45,146,000 214.00 4.74 1.26 0.31 0.35 0.38 2.39 0.06
Syria 19,694,000 28.64 1.45 0.48 0.16 0.05 0.01 0.71 0.04
Tunisia 10,247,000 18.08 1.76 0.65 0.12 0.21 0.10 0.66 0.03
Turkey 70,924,000 181.20 2.55 0.92 0.08 0.28 0.03 1.17 0.07
42](https://image.slidesharecdn.com/mediterraneanreportfinal-121025041137-phpapp02/75/Mediterranean-report-final-44-2048.jpg)
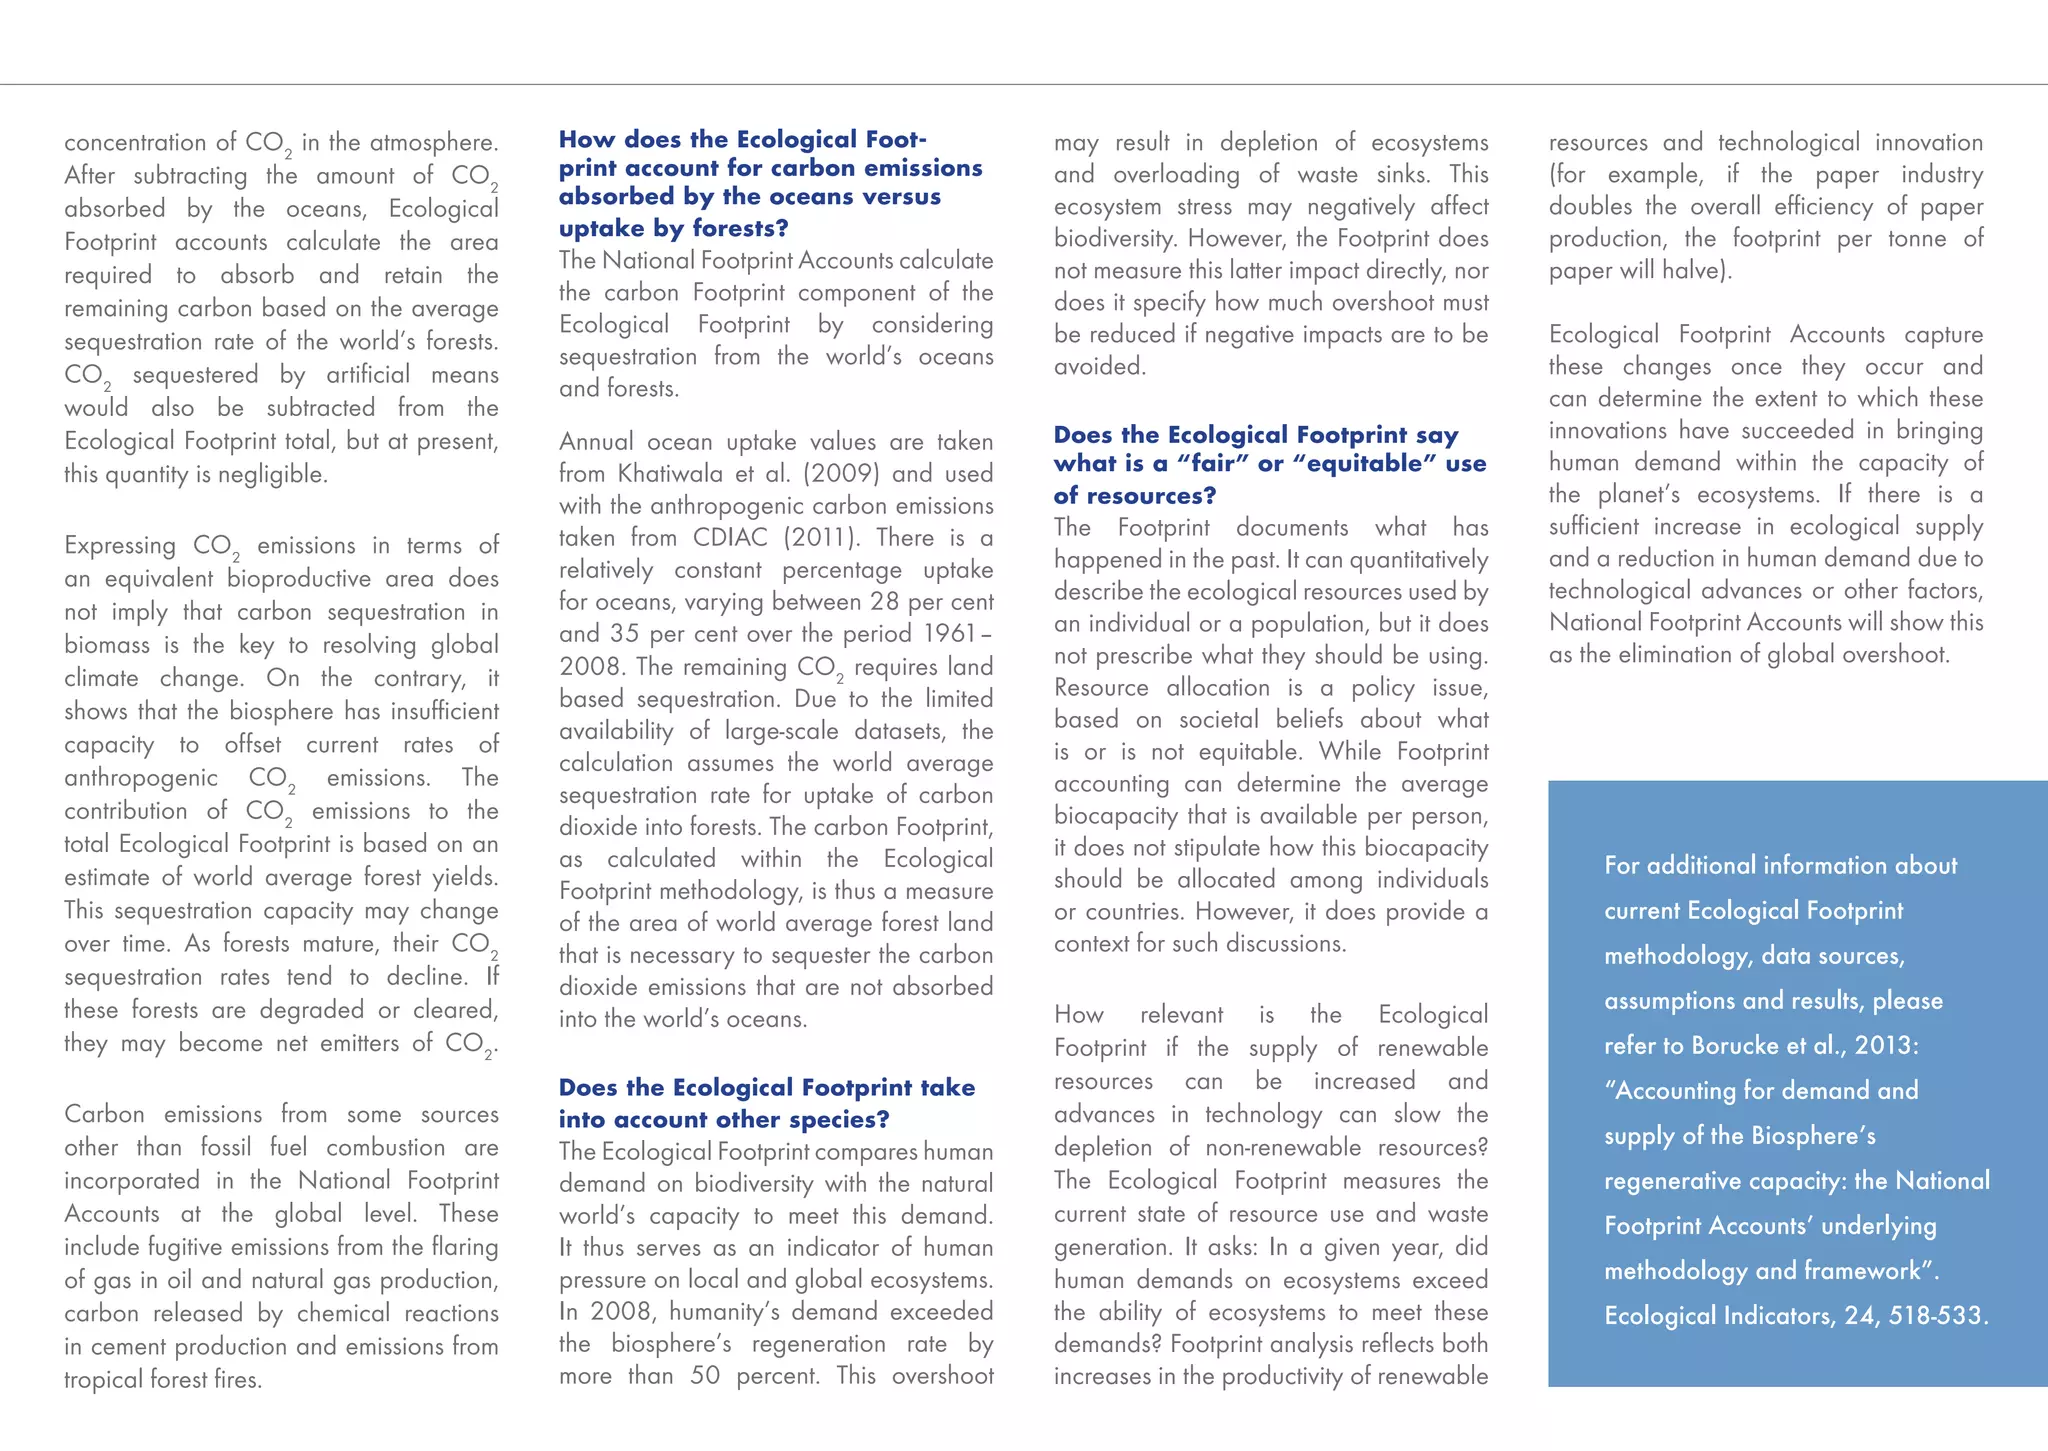
![B I O C A PAC I T Y C O M P O N E N T S
Ecological Ecological Total Per capita Cropland Grazing land Forest land Fishing grounds Built-up land
C O U N T RY deficit (reserve) deficit (reserve) biocapacity biocapacity
[million gha] [gha per capita] [million gha] [gha per capita] [gha per capita] [gha per capita] [gha per capita] [gha per capita] [gha per capita]
Albania 2.96 0.93 2.81 0.88 0.41 0.13 0.20 0.08 0.06
Algeria 37.40 1.09 19.34 0.56 0.19 0.31 0.02 0.01 0.02
Bosnia and Herzegovina 4.16 1.10 6.17 1.64 0.41 0.26 0.91 0.00 0.05
Croatia 5.61 1.27 12.92 2.92 0.87 0.17 1.14 0.32 0.43
Cyprus 4.52 4.20 0.26 0.24 0.13 - 0.05 0.06 0.00
Egypt 81.54 1.04 51.26 0.65 0.45 - 0.00 0.02 0.18
France 119.27 1.92 185.69 2.99 1.47 0.24 0.87 0.16 0.25
Greece 37.66 3.34 17.90 1.59 1.03 0.09 0.14 0.22 0.11
Israel 26.01 3.67 2.06 0.29 0.17 0.01 0.03 0.01 0.06
Italy 202.40 3.38 68.59 1.15 0.62 0.06 0.30 0.06 0.10
Jordan 11.07 1.89 1.39 0.24 0.09 0.02 0.03 0.00 0.09
Lebanon 10.22 2.45 1.64 0.39 0.22 0.05 0.06 0.01 0.05
Libya 15.52 2.52 4.08 0.66 0.15 0.23 0.02 0.24 0.02
Macedonia TFYR 7.82 3.81 3.19 1.55 0.53 0.22 0.70 0.01 0.09
Malta 1.62 3.92 0.19 0.46 0.10 - - 0.37 -
Montenegro (0.51) (0.81) 1.28 2.03 0.13 0.45 1.26 0.19 -
Morocco 19.64 0.63 21.82 0.70 0.30 0.18 0.09 0.10 0.03
Occupied Palestinian Territories 1.26 0.33 0.50 0.13 0.11 0.02 0.00 - -
Portugal 30.02 2.82 13.76 1.29 0.29 0.24 0.64 0.07 0.05
Slovenia 5.28 2.62 5.23 2.59 0.37 0.23 1.84 0.00 0.15
Spain 148.13 3.28 65.87 1.46 0.98 0.11 0.25 0.06 0.06
Syria 17.39 0.88 11.26 0.57 0.37 0.11 0.04 0.00 0.04
Tunisia 8.26 0.81 9.82 0.96 0.53 0.09 0.05 0.25 0.03
Turkey 88.47 1.25 92.73 1.31 0.74 0.13 0.32 0.05 0.07
43](https://image.slidesharecdn.com/mediterraneanreportfinal-121025041137-phpapp02/75/Mediterranean-report-final-45-2048.jpg)


