Download as PDF, PPTX

![Examples of traditional studies
Papers published in recent issues of the Journal of Communication:
“A total of 529 stories from NBC Nightly News and 322 stories aired
on Special Report about Iraq, and 64 and 47, respectively, about
Afghanistan were analysed by two coders”
S. Aday, “Chasing the Bad News: An Analysis of 2005 Iraq and Afghanistan War
Coverage on NBC and Fox News Channel”, J. of Com. 60, 144-164 (2010).
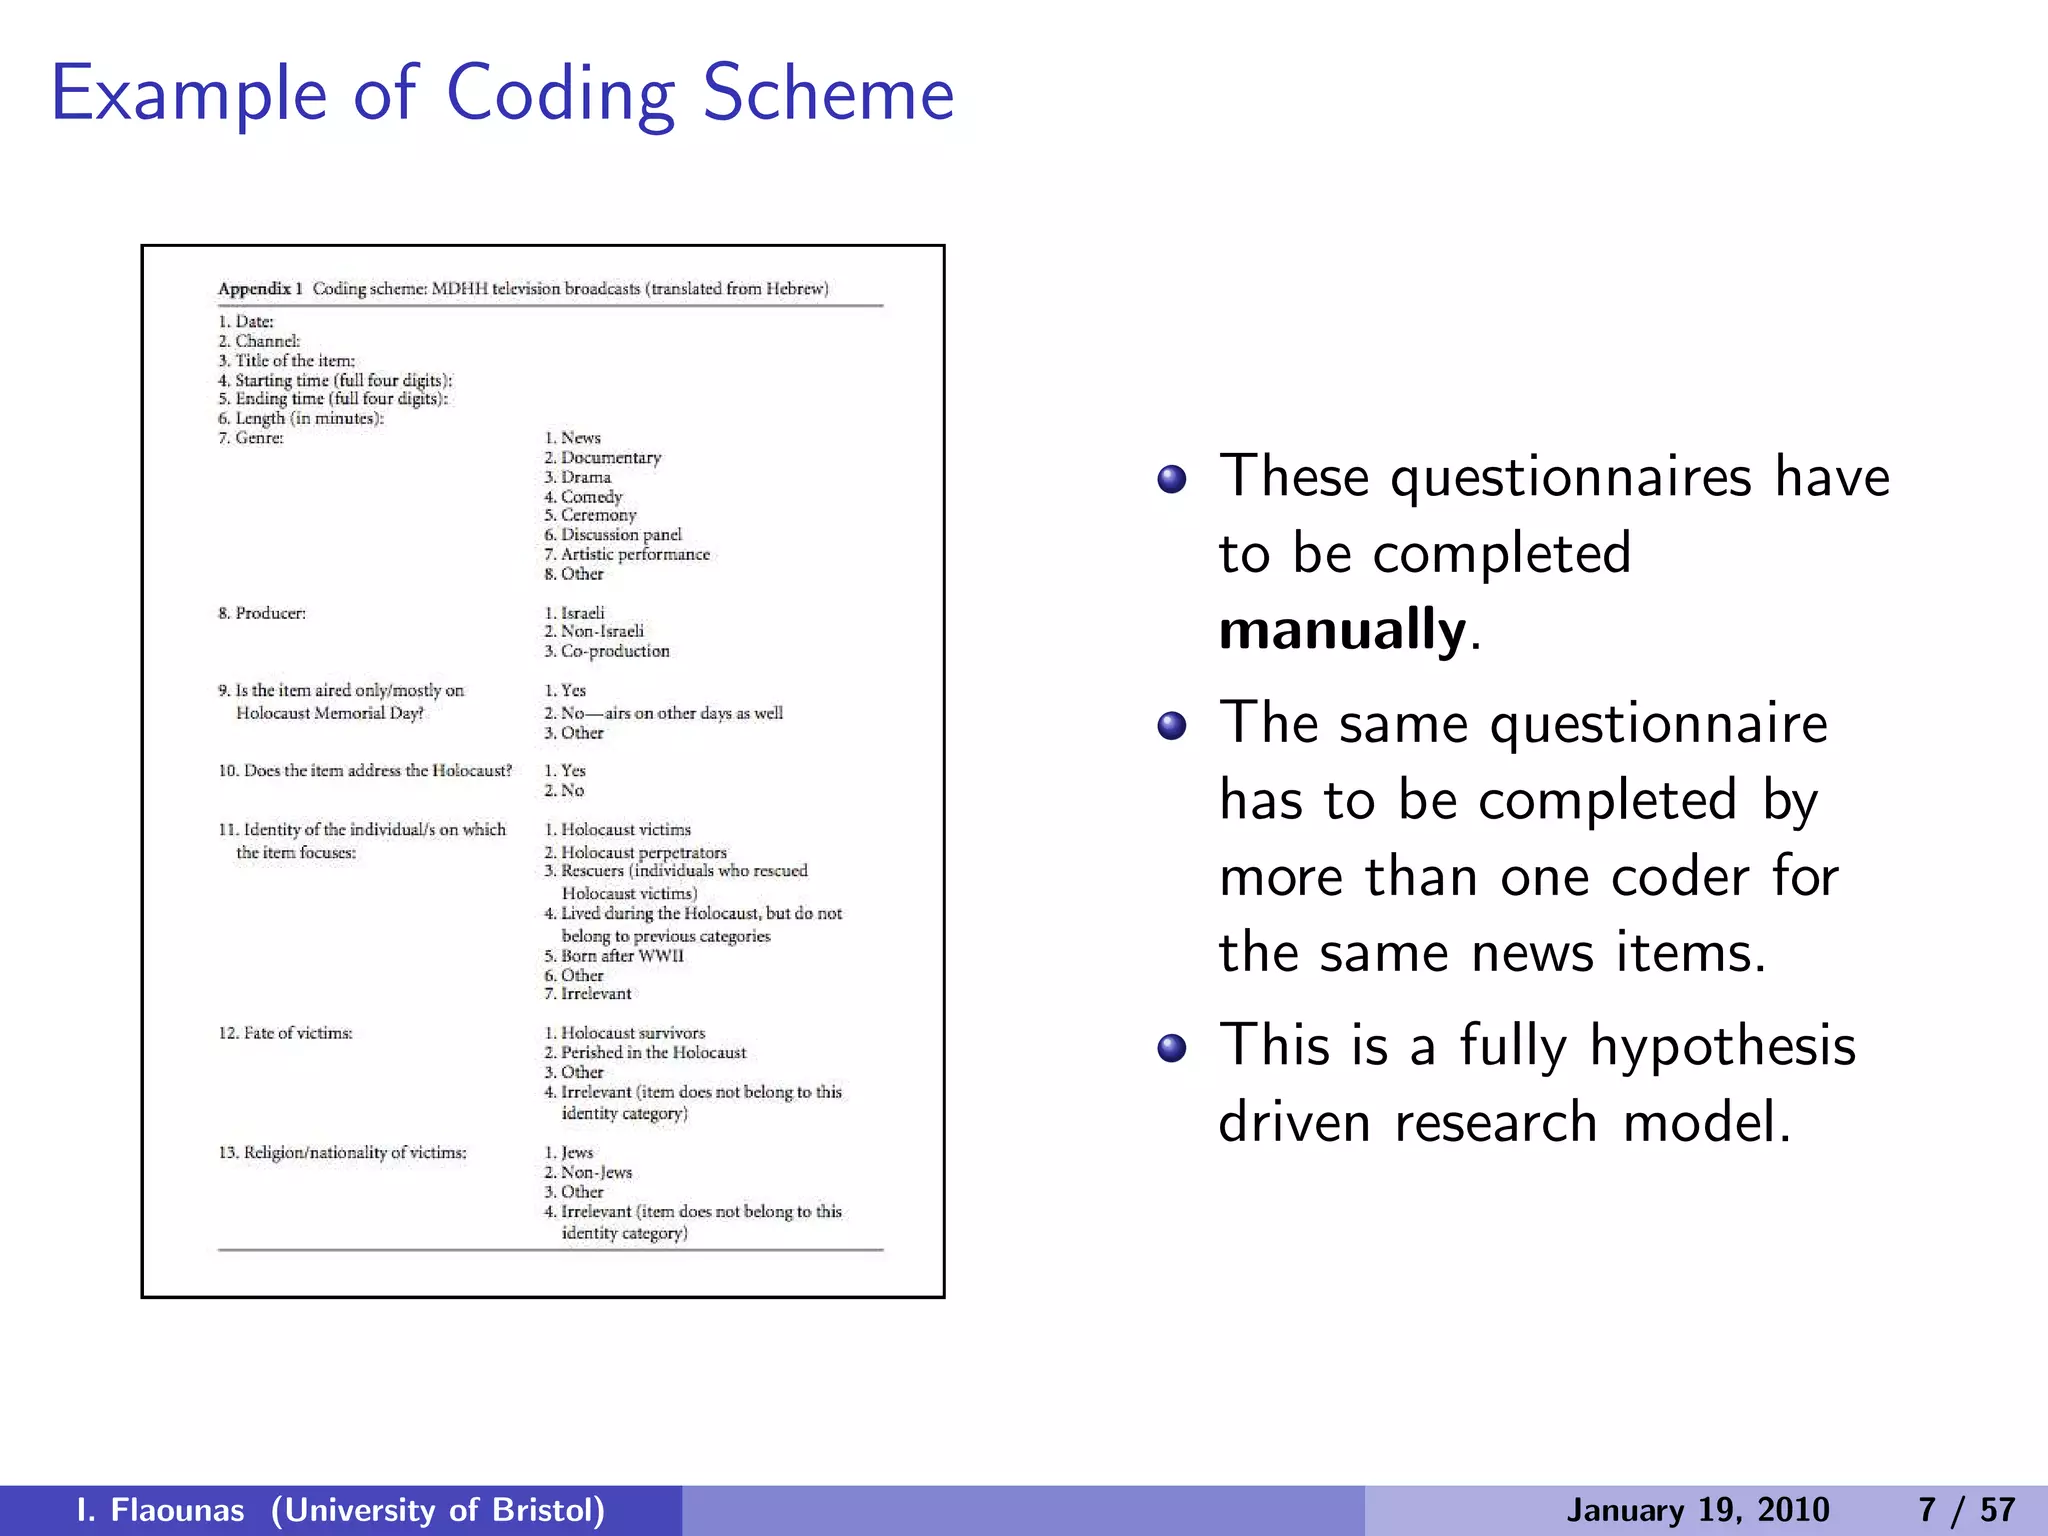
“Our corpus of data consisted of Channel 2s broadcasts on the eve of
MDHH between 7:30 p.m. and midnight in the years 1994-2007[...].
All 278 items aired on the 14 examined evenings were coded.”
O. Meyers et al. “Prime Time Commemoration: An Analysis of Television
Broadcasts on Israel’s Memorial Day for the Holocaust and the Heroism”, J. of
Com. 59, 456-480 (2009).
I. Flaounas (University of Bristol) January 19, 2010 6 / 57](https://image.slidesharecdn.com/mediapatternsdemokritos-150524075422-lva1-app6891/75/Detecting-Patterns-in-News-Media-Content-7-2048.jpg)
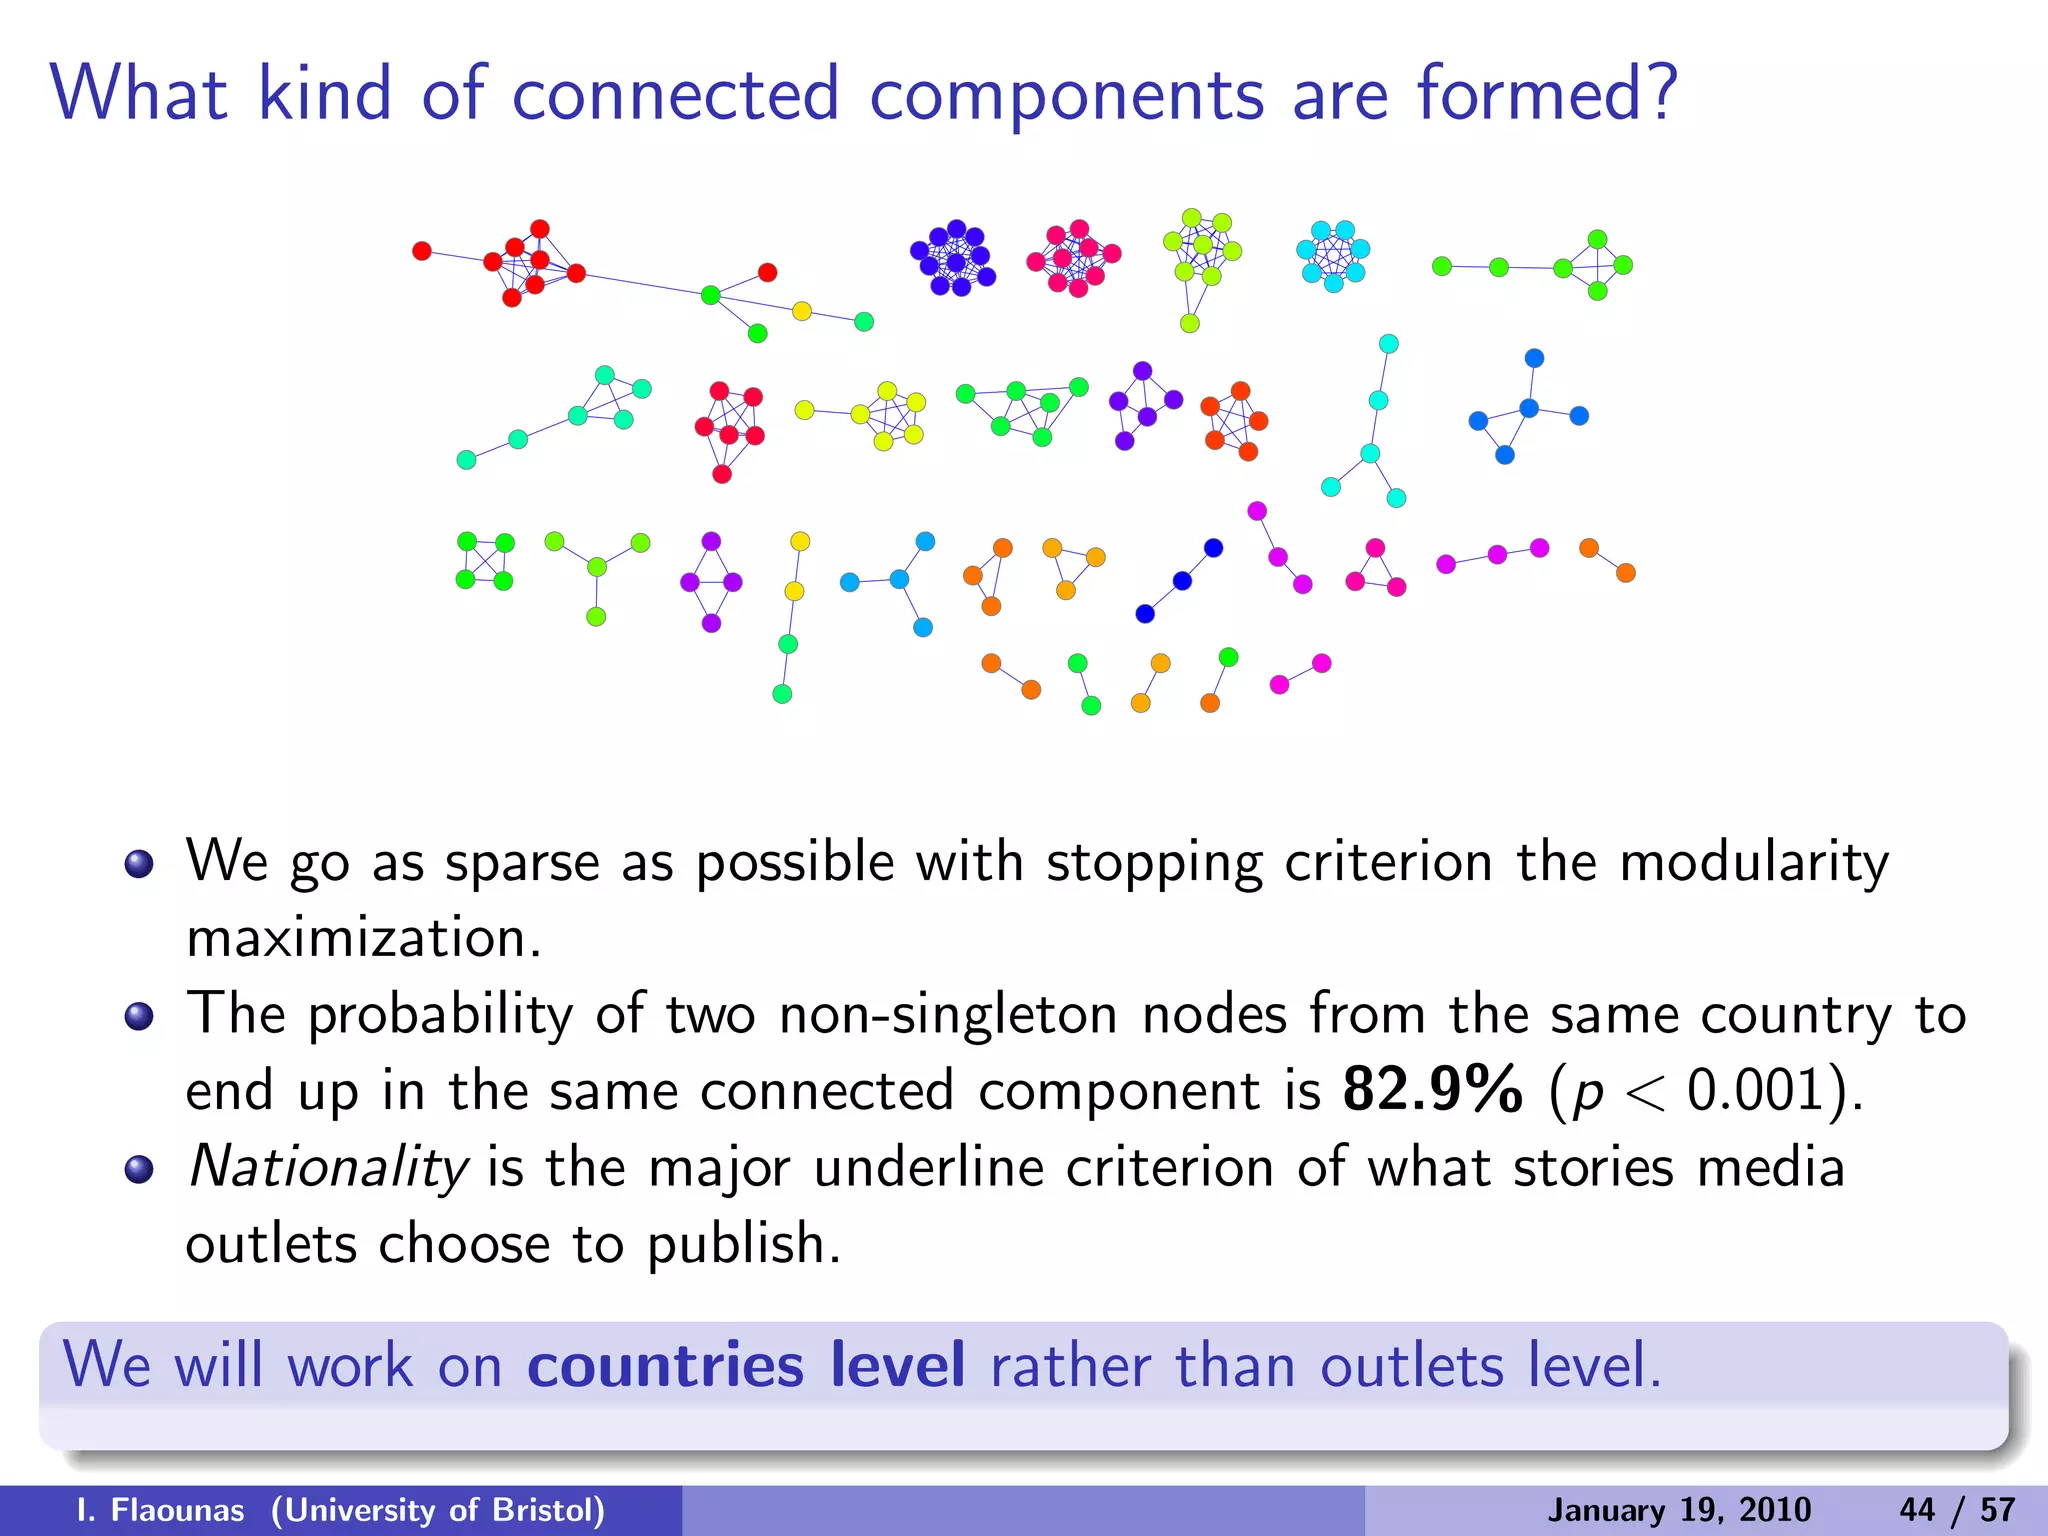
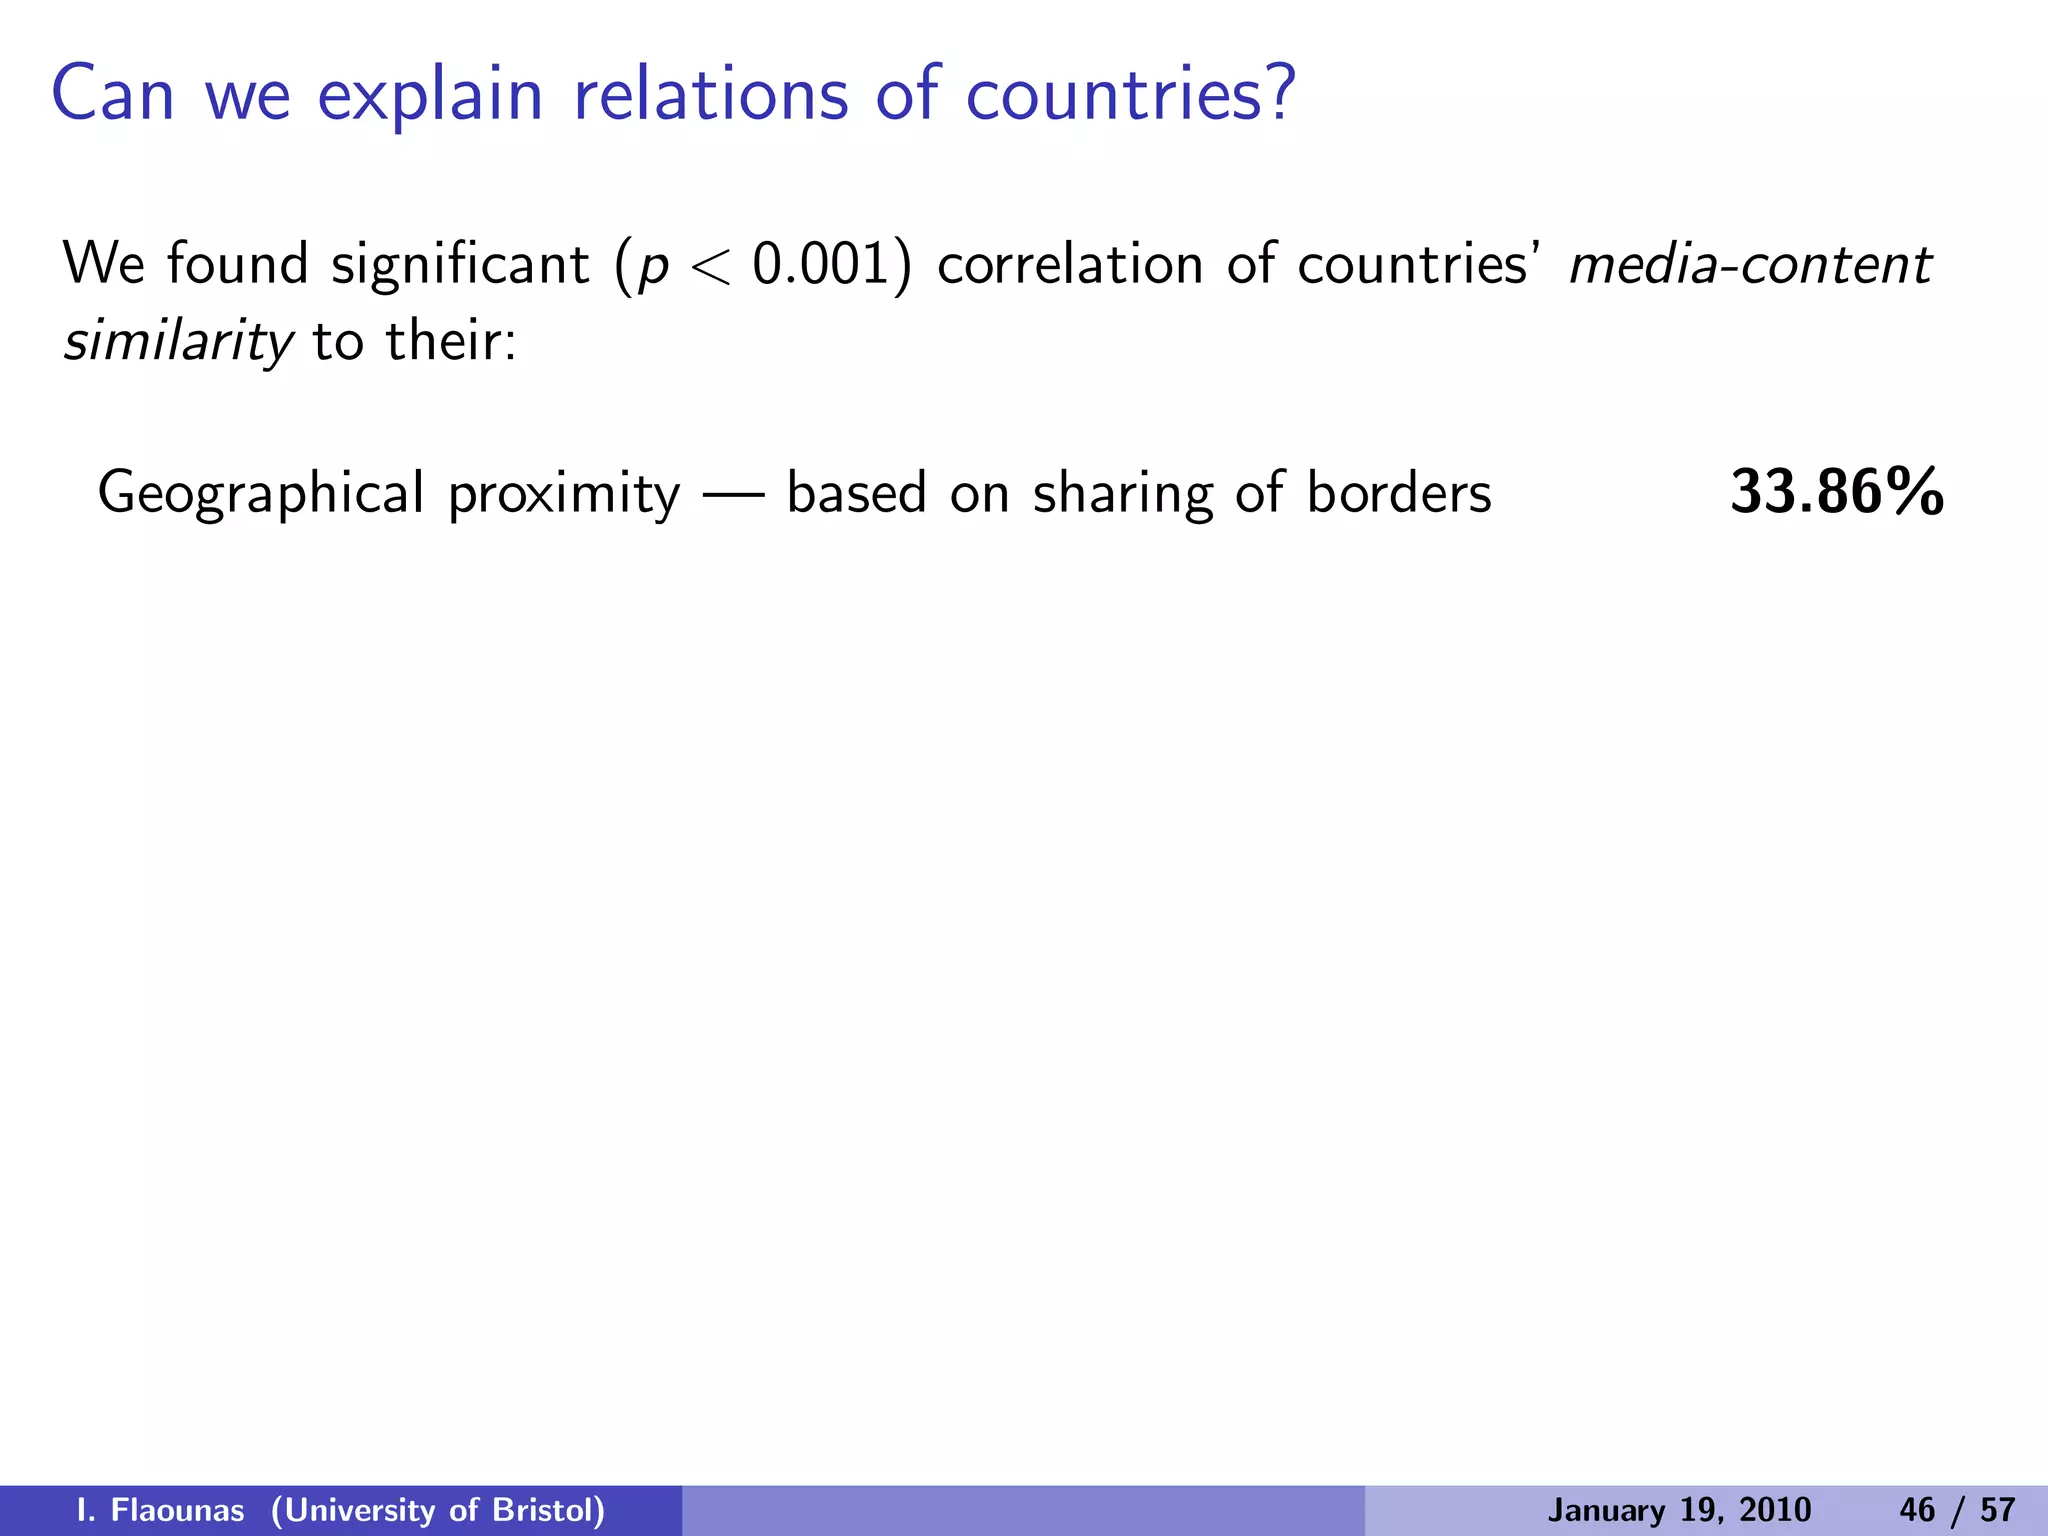
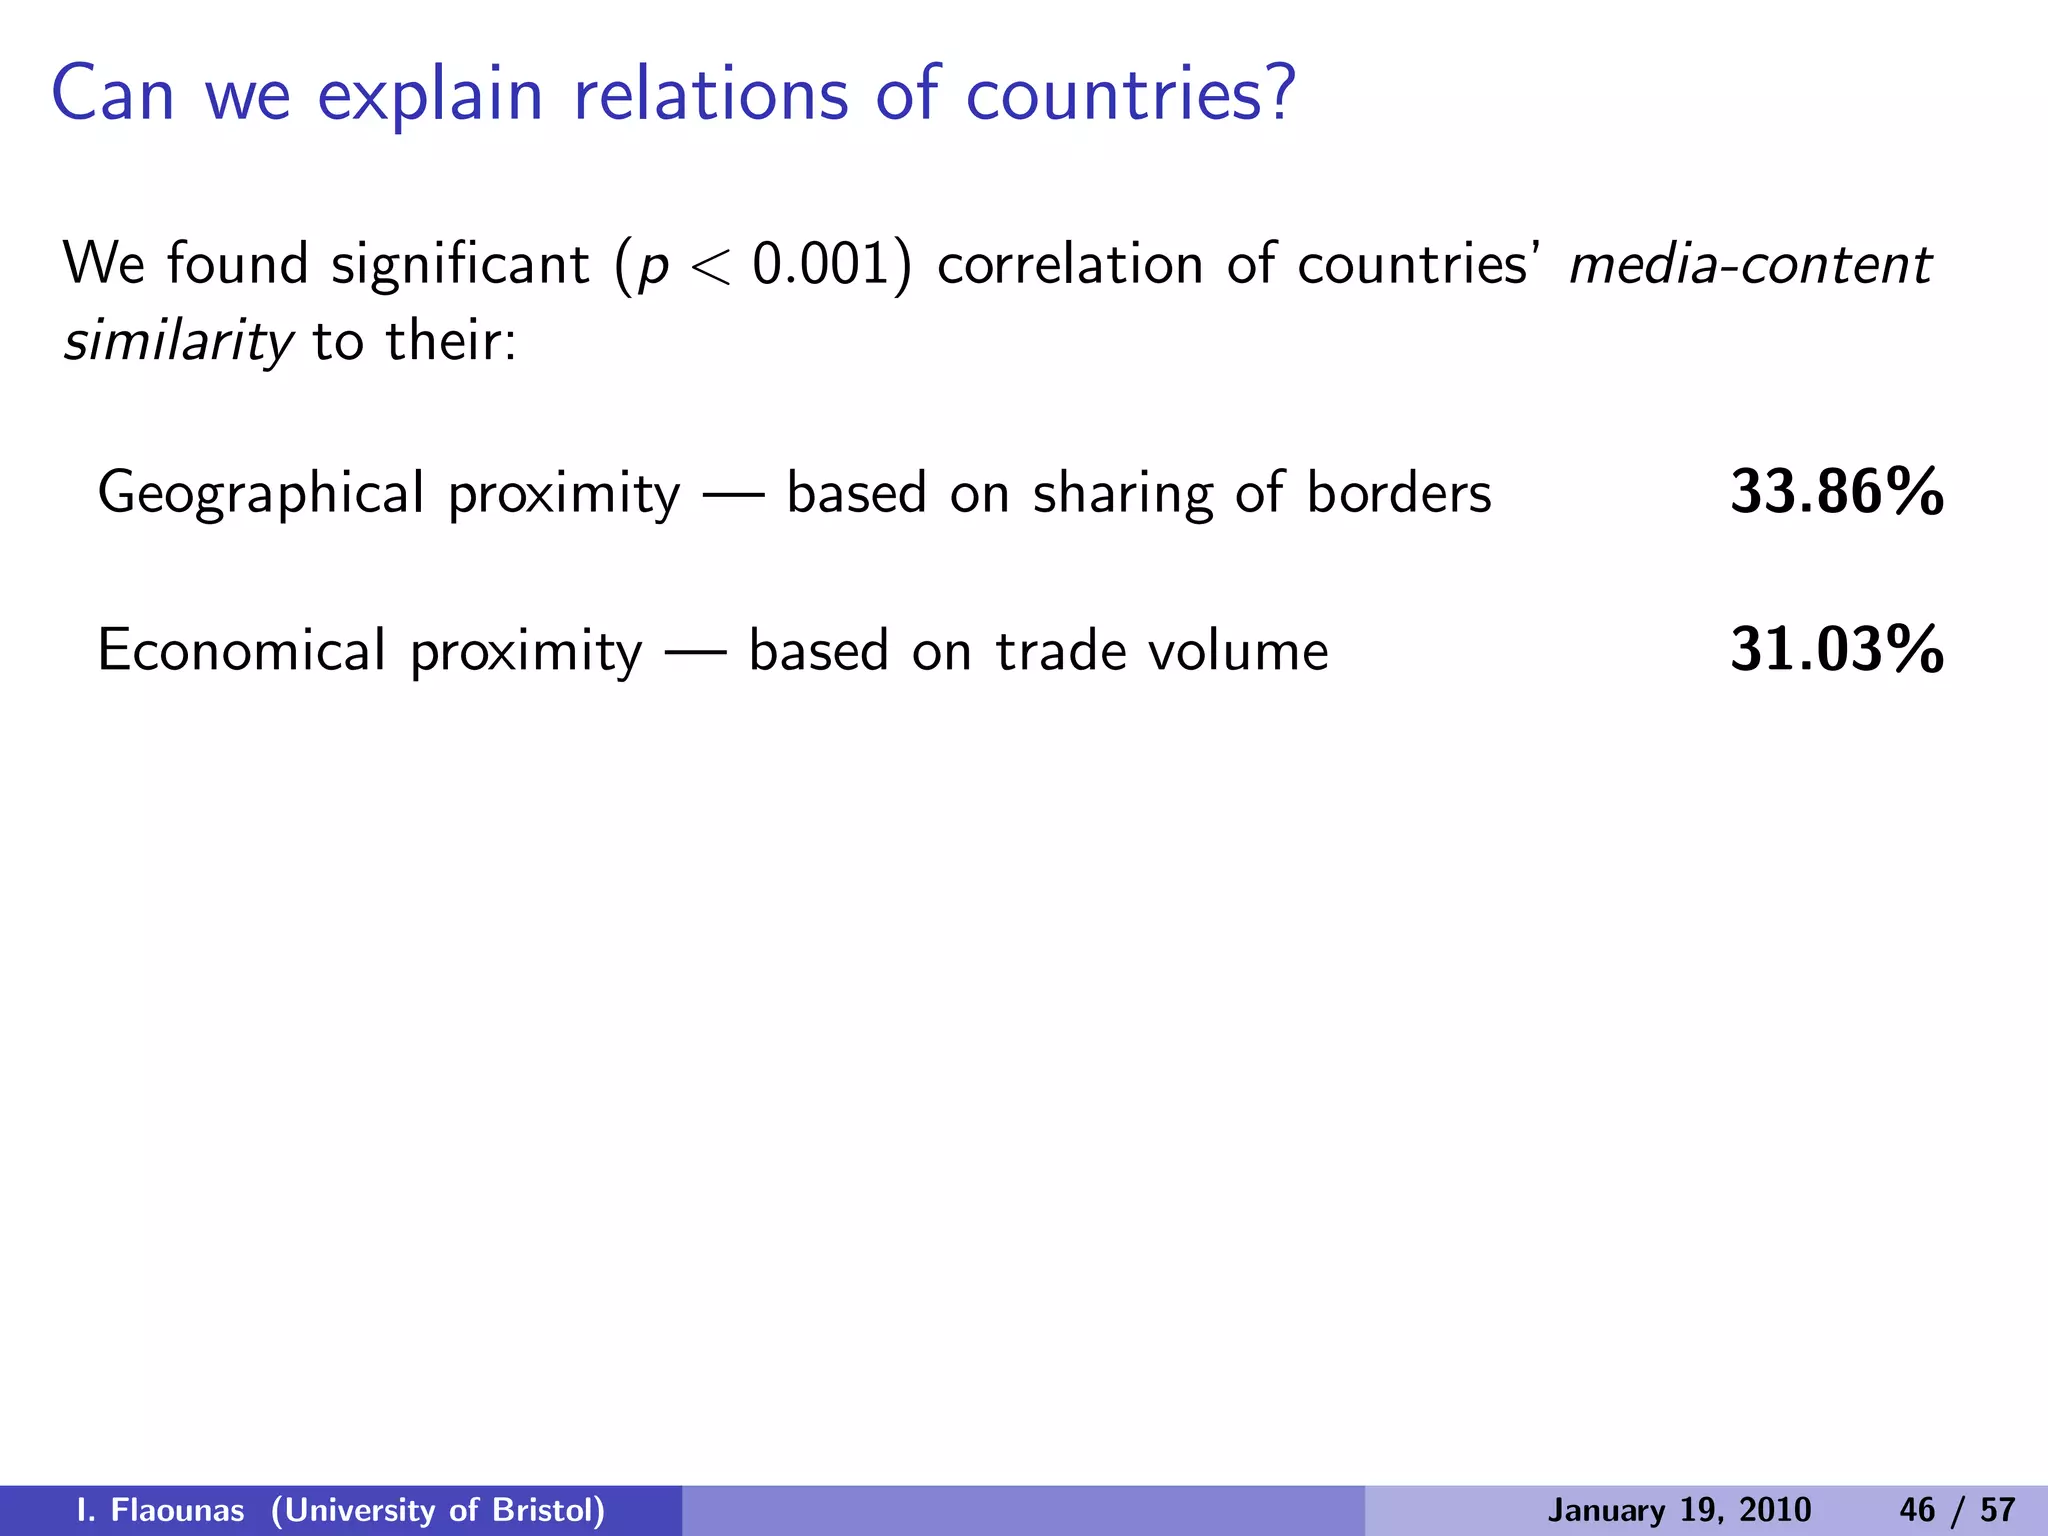
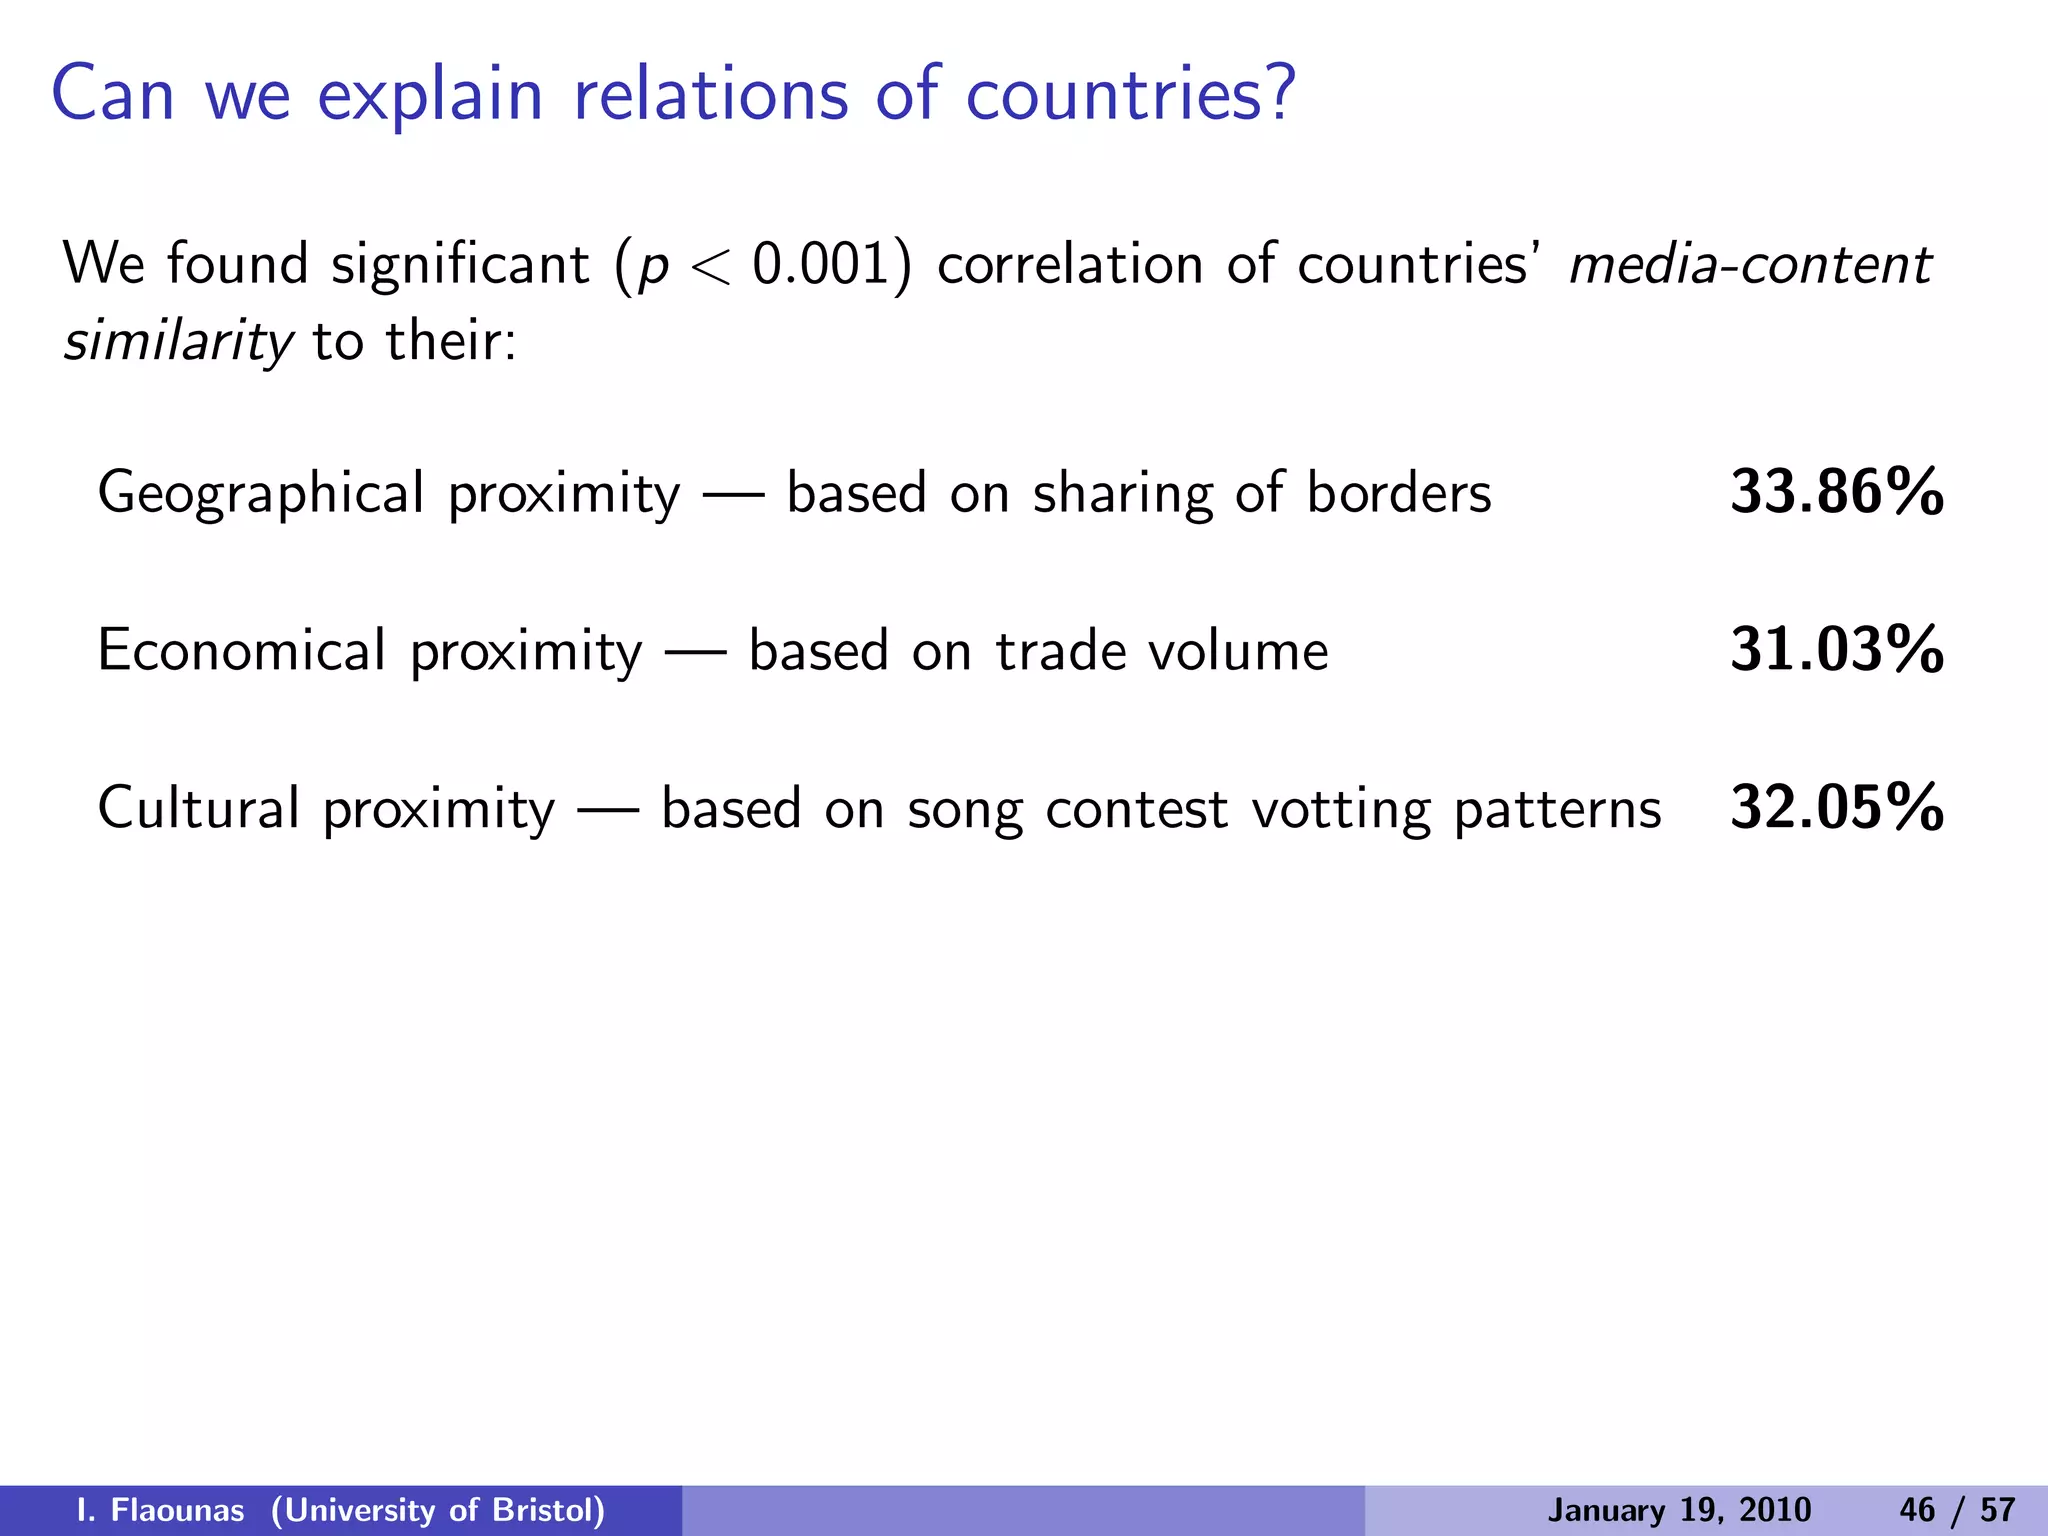
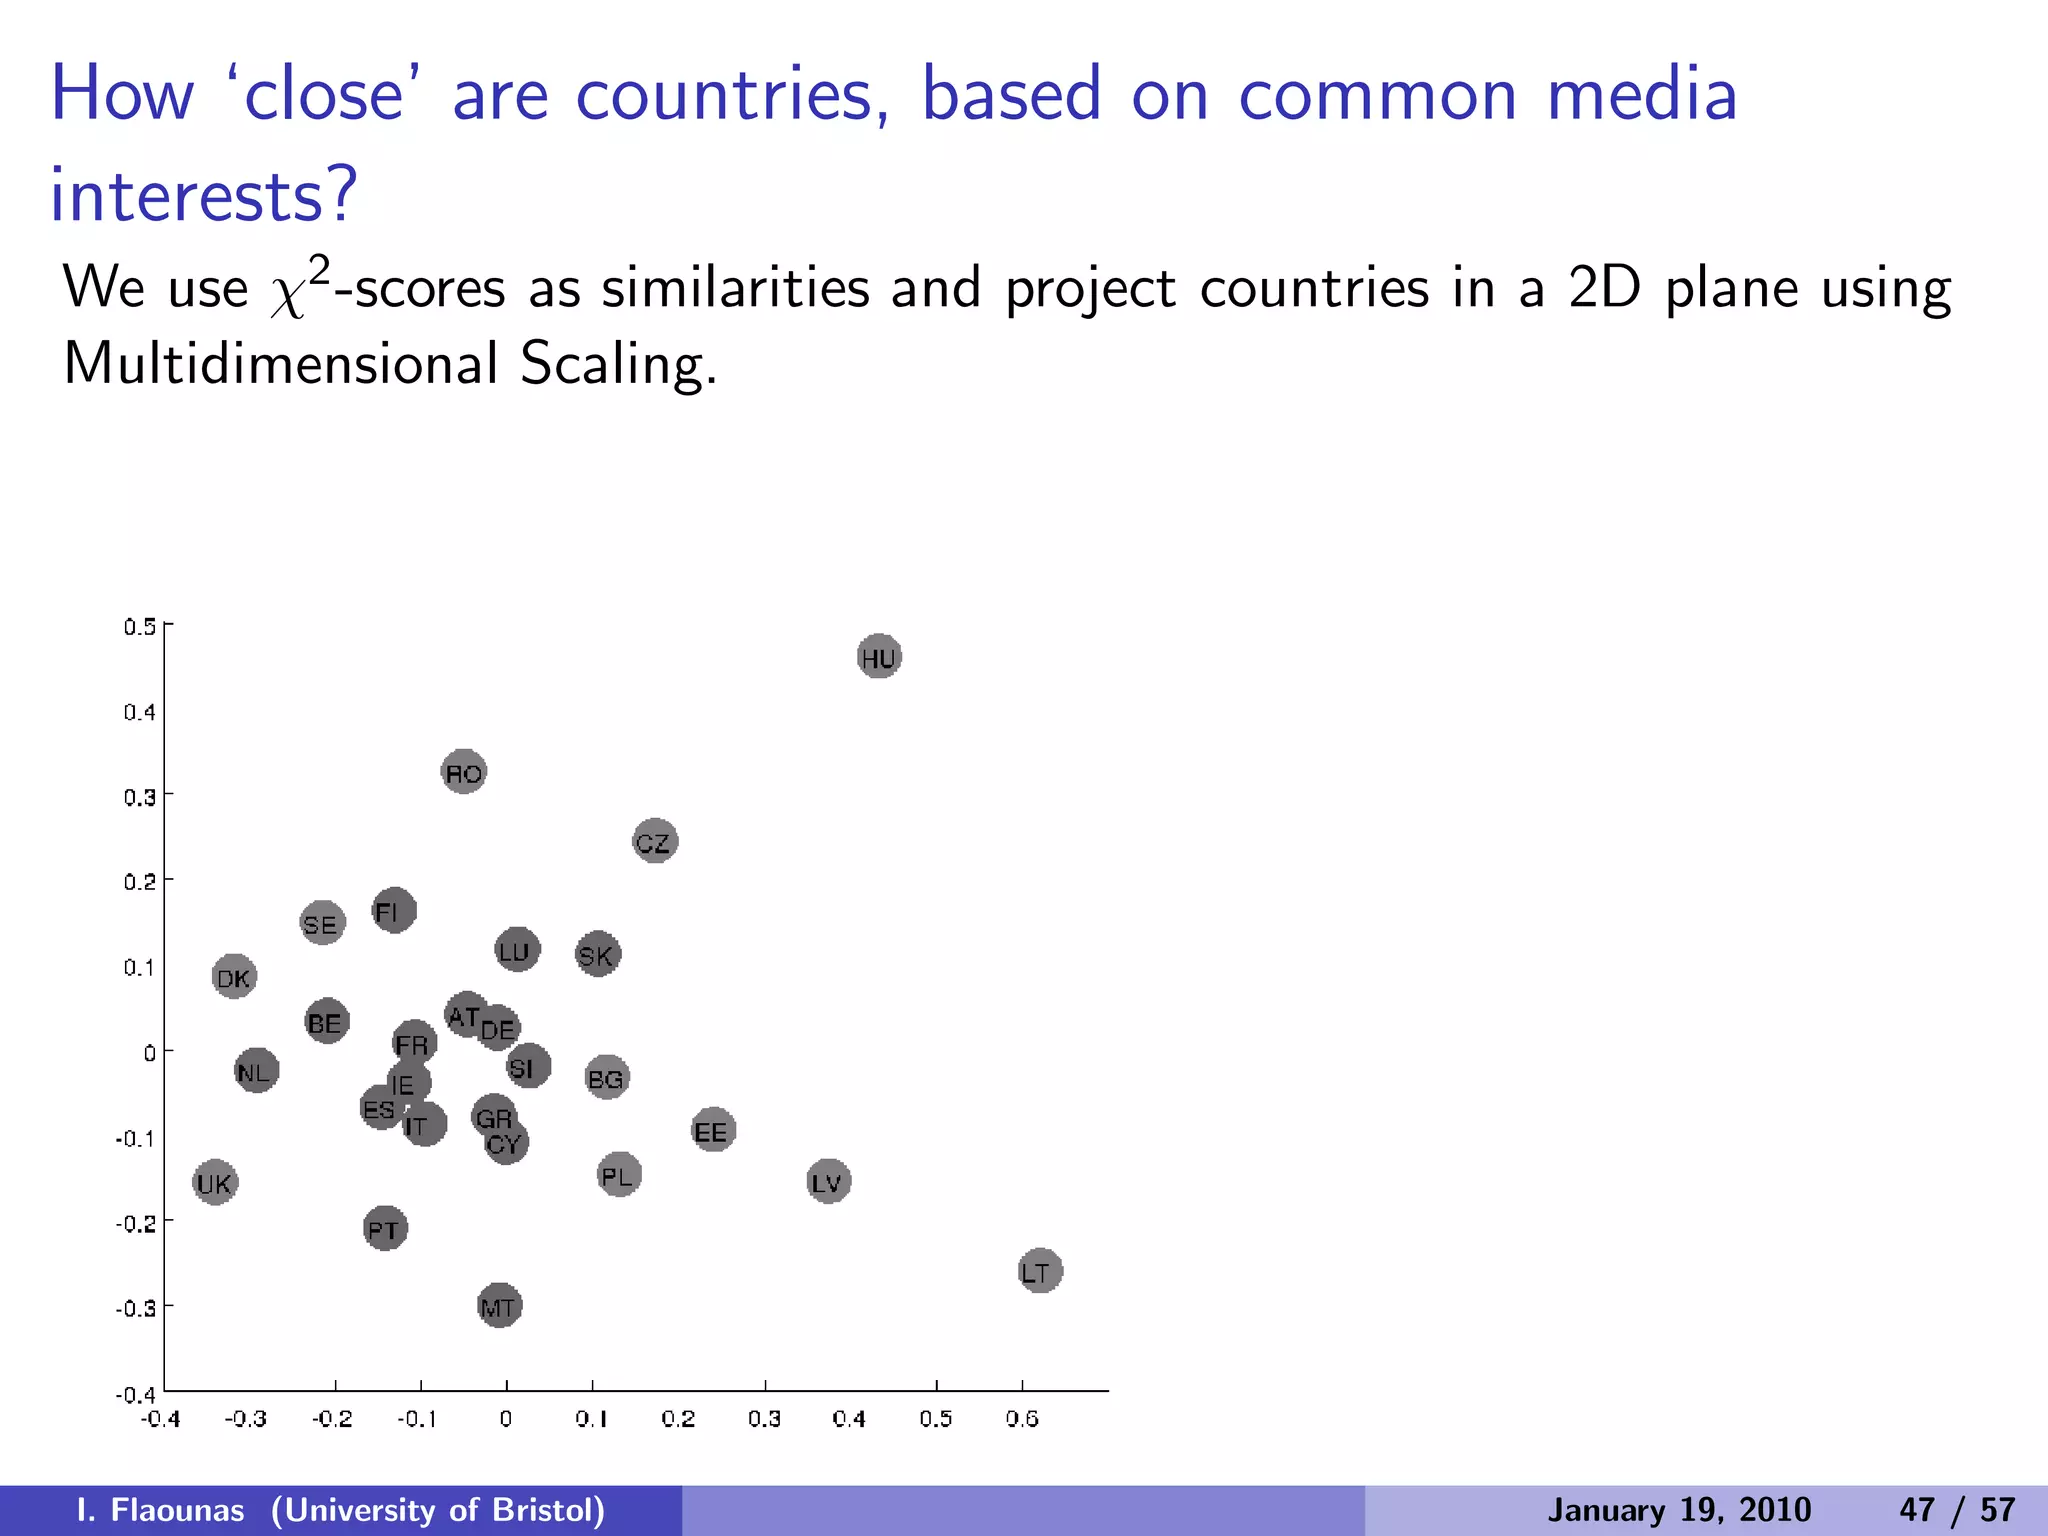
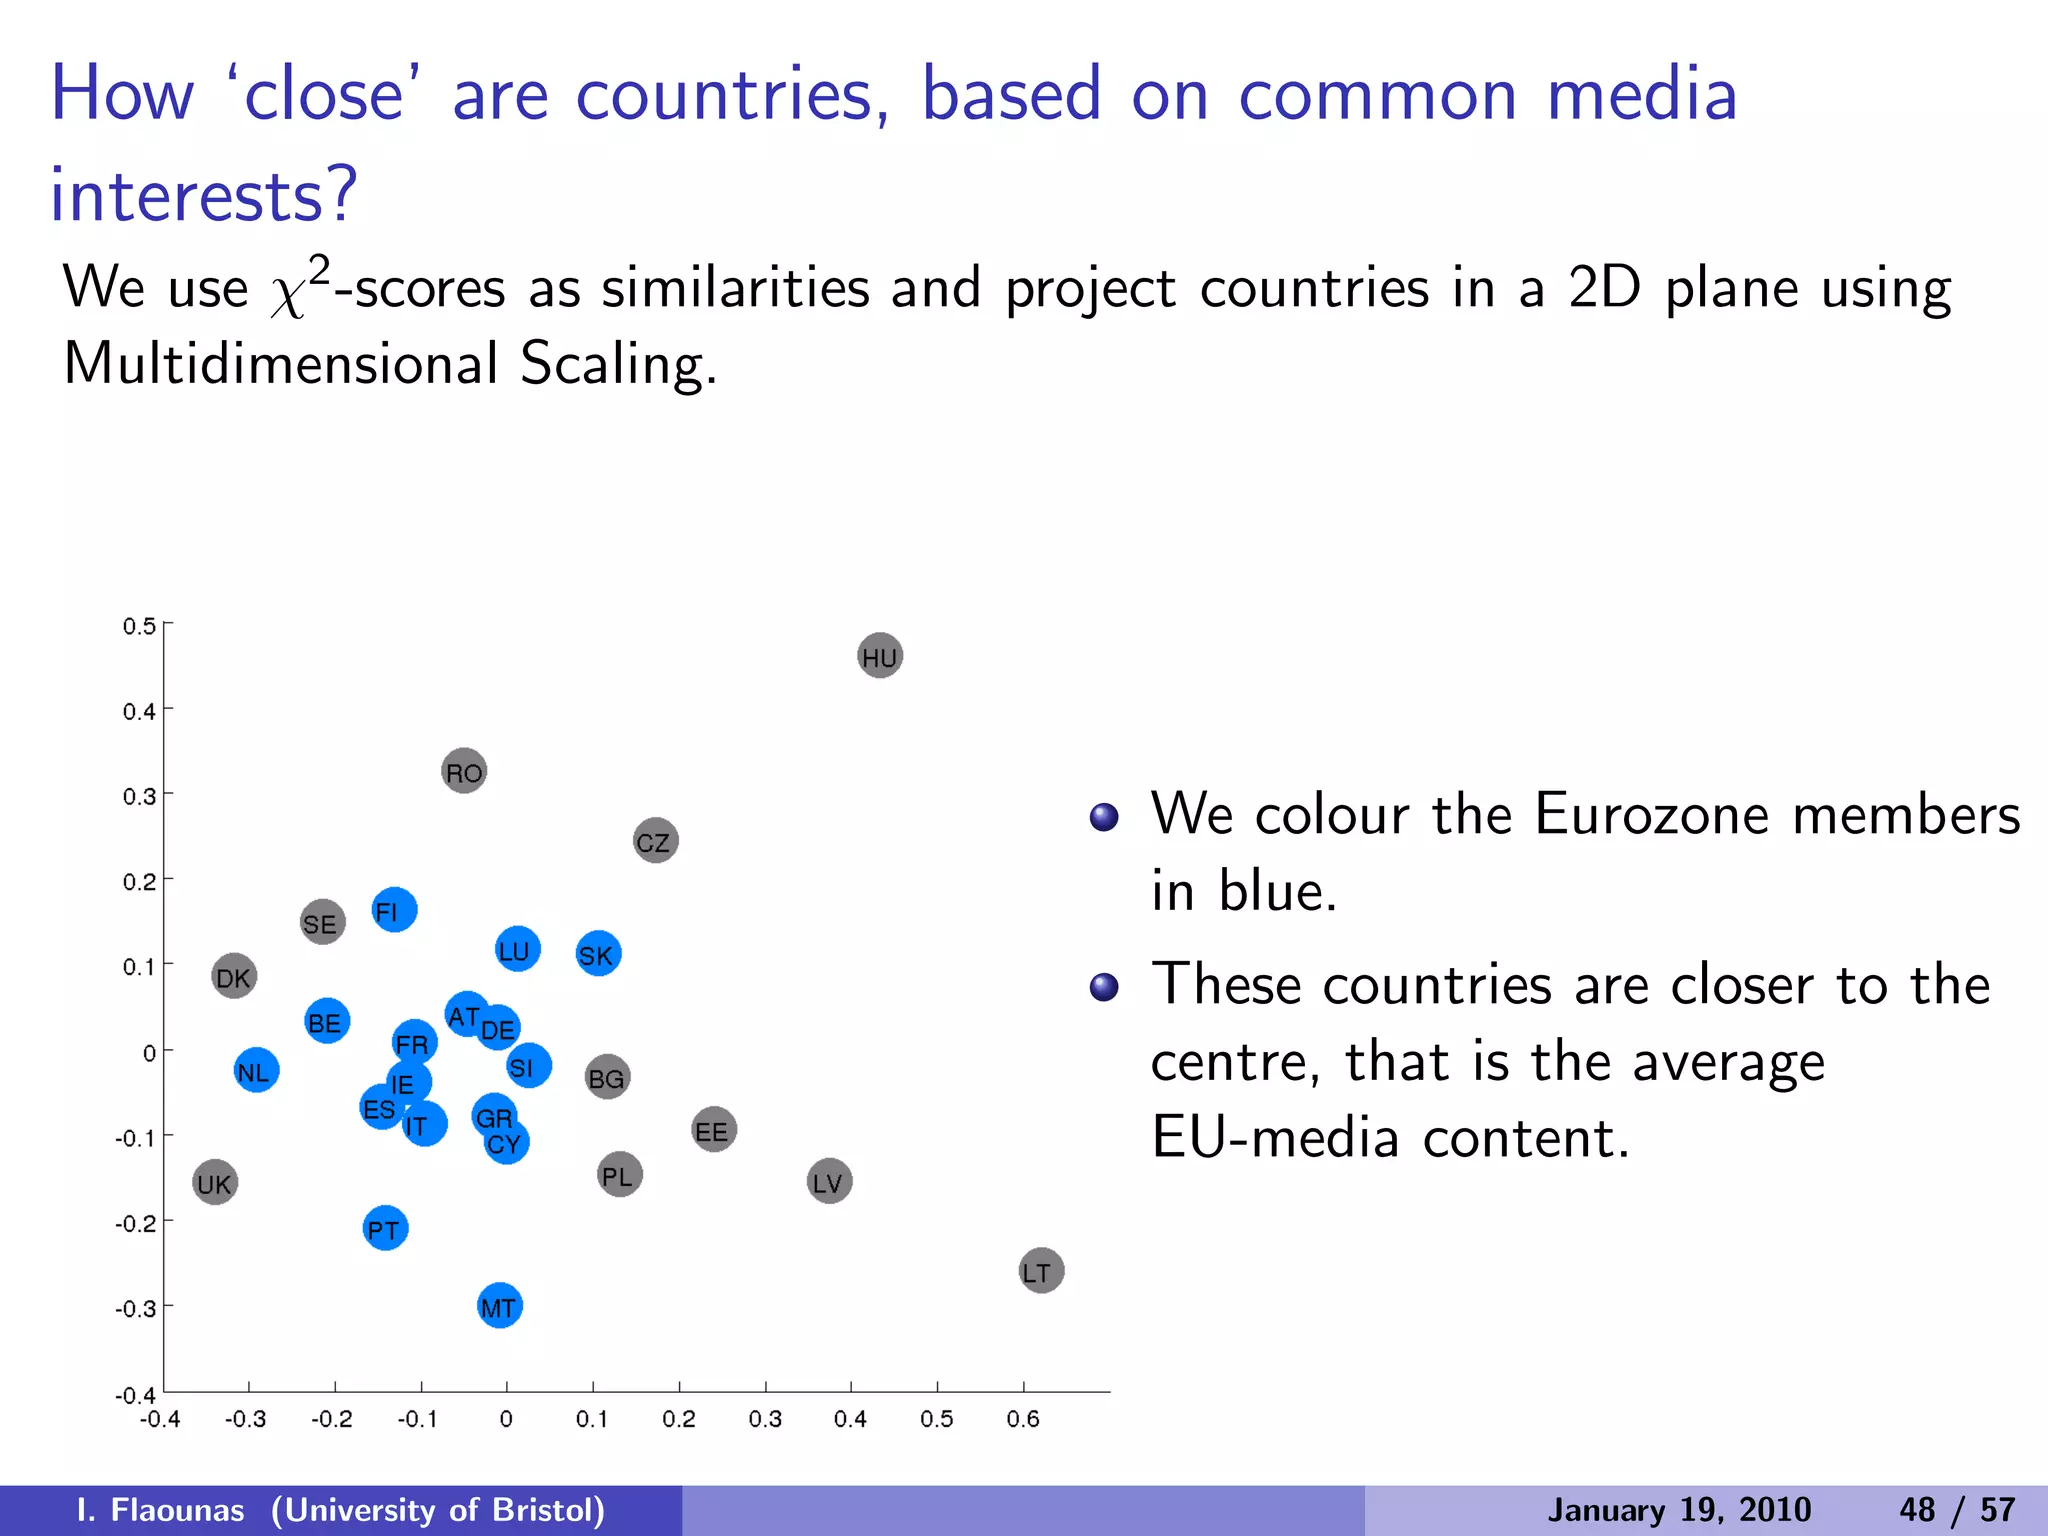
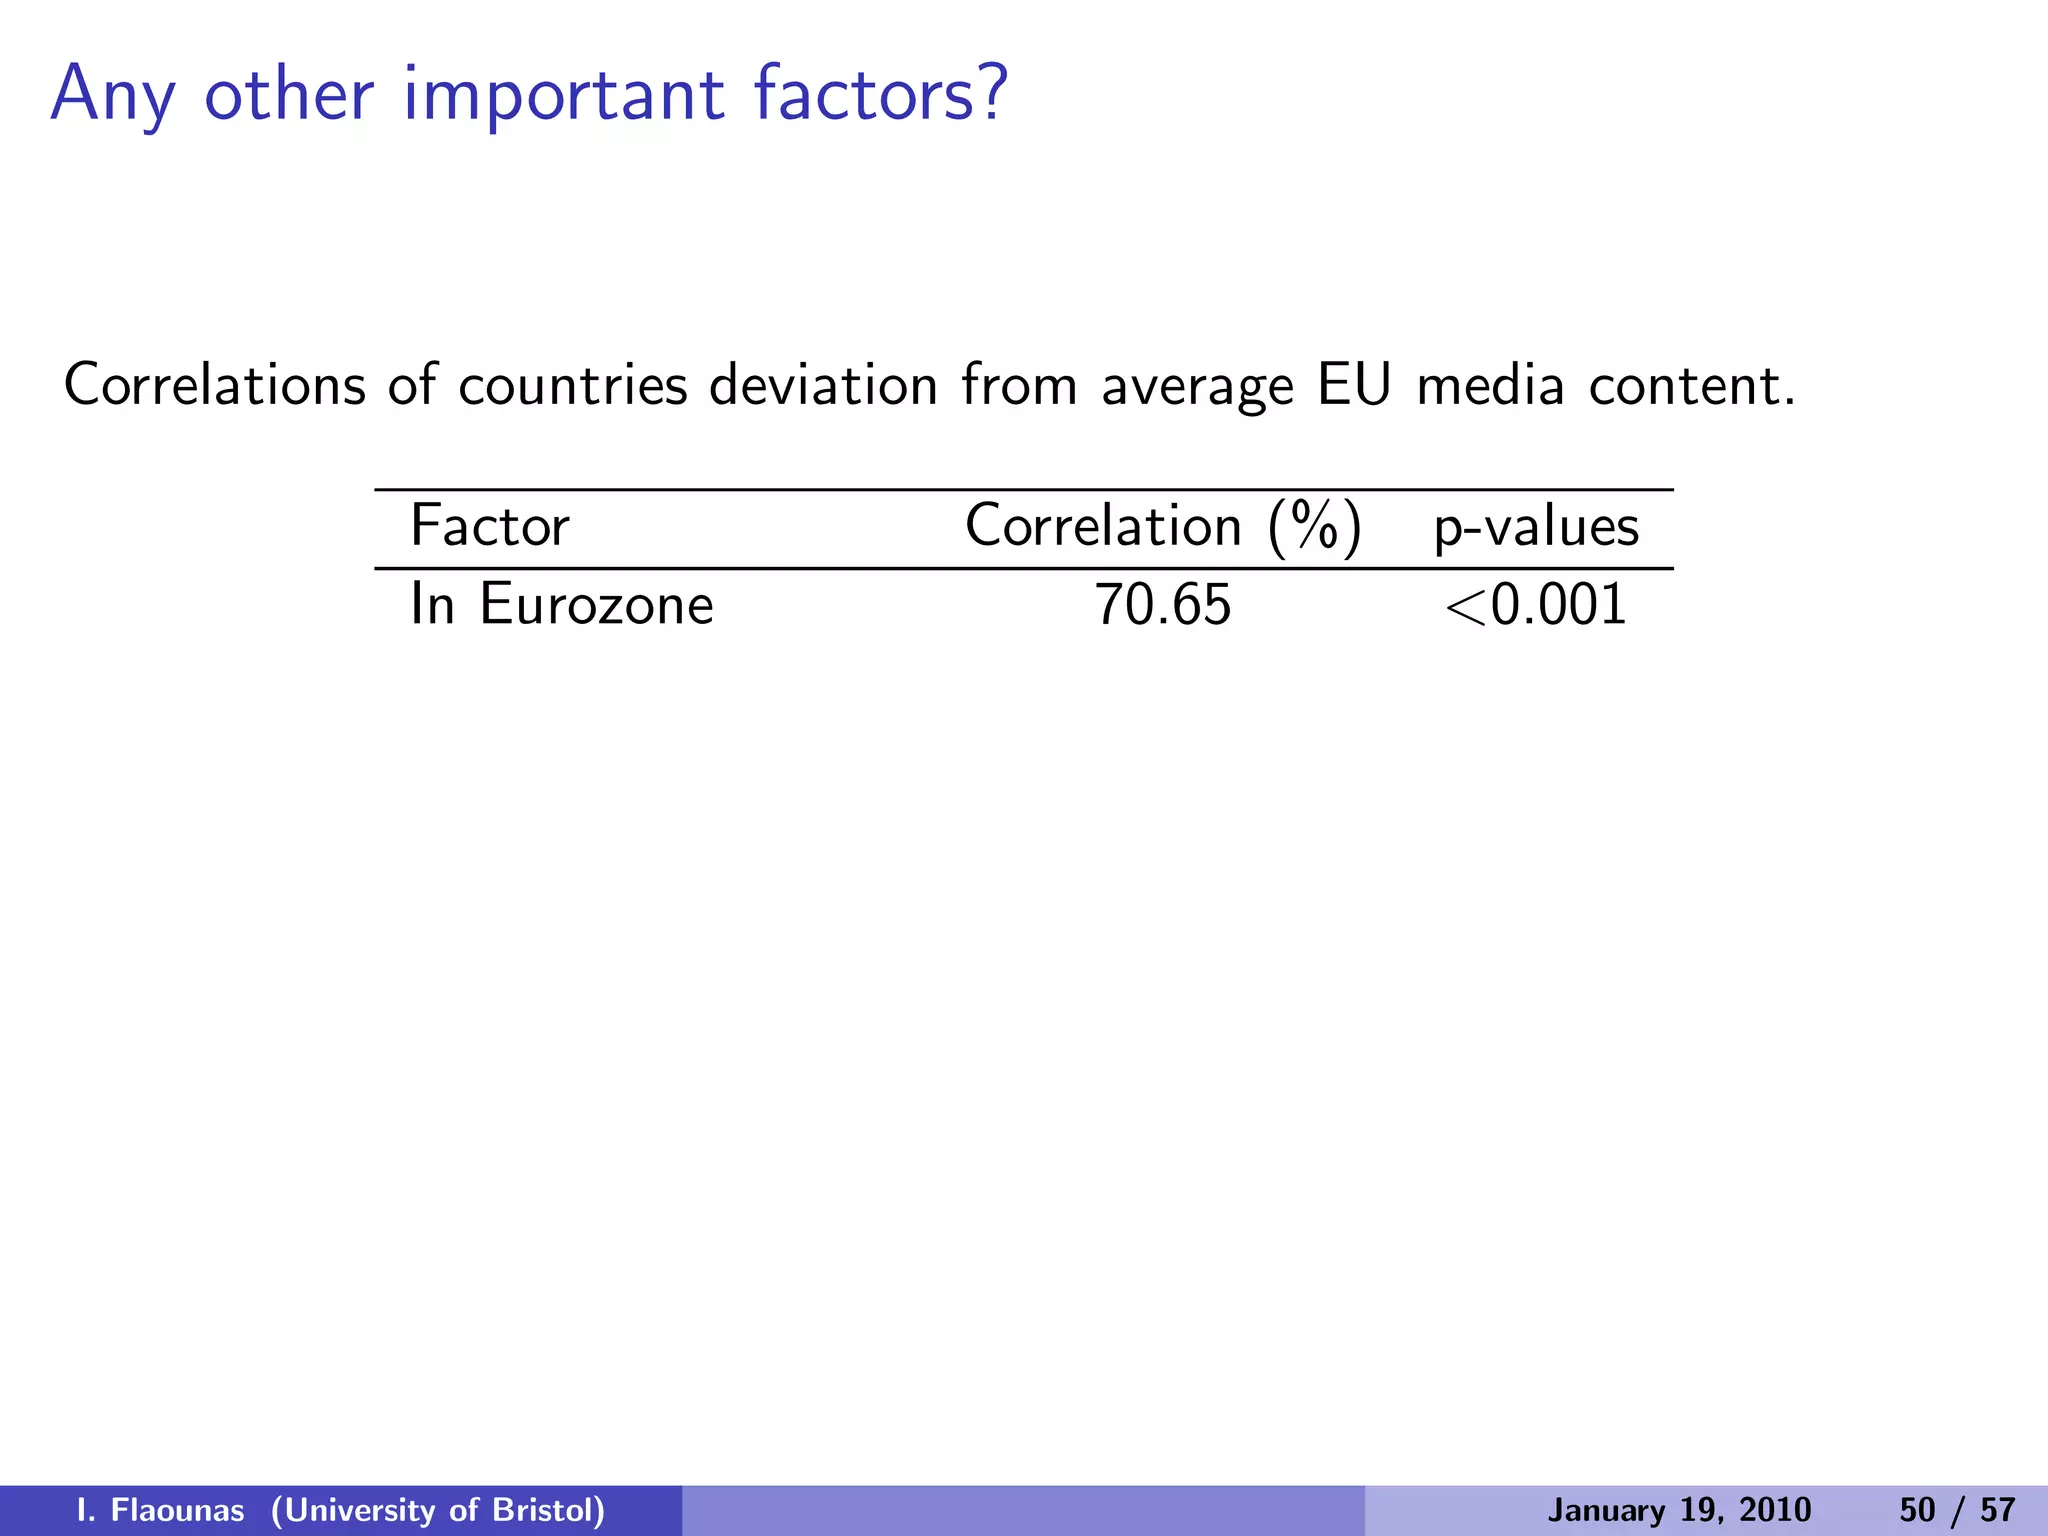
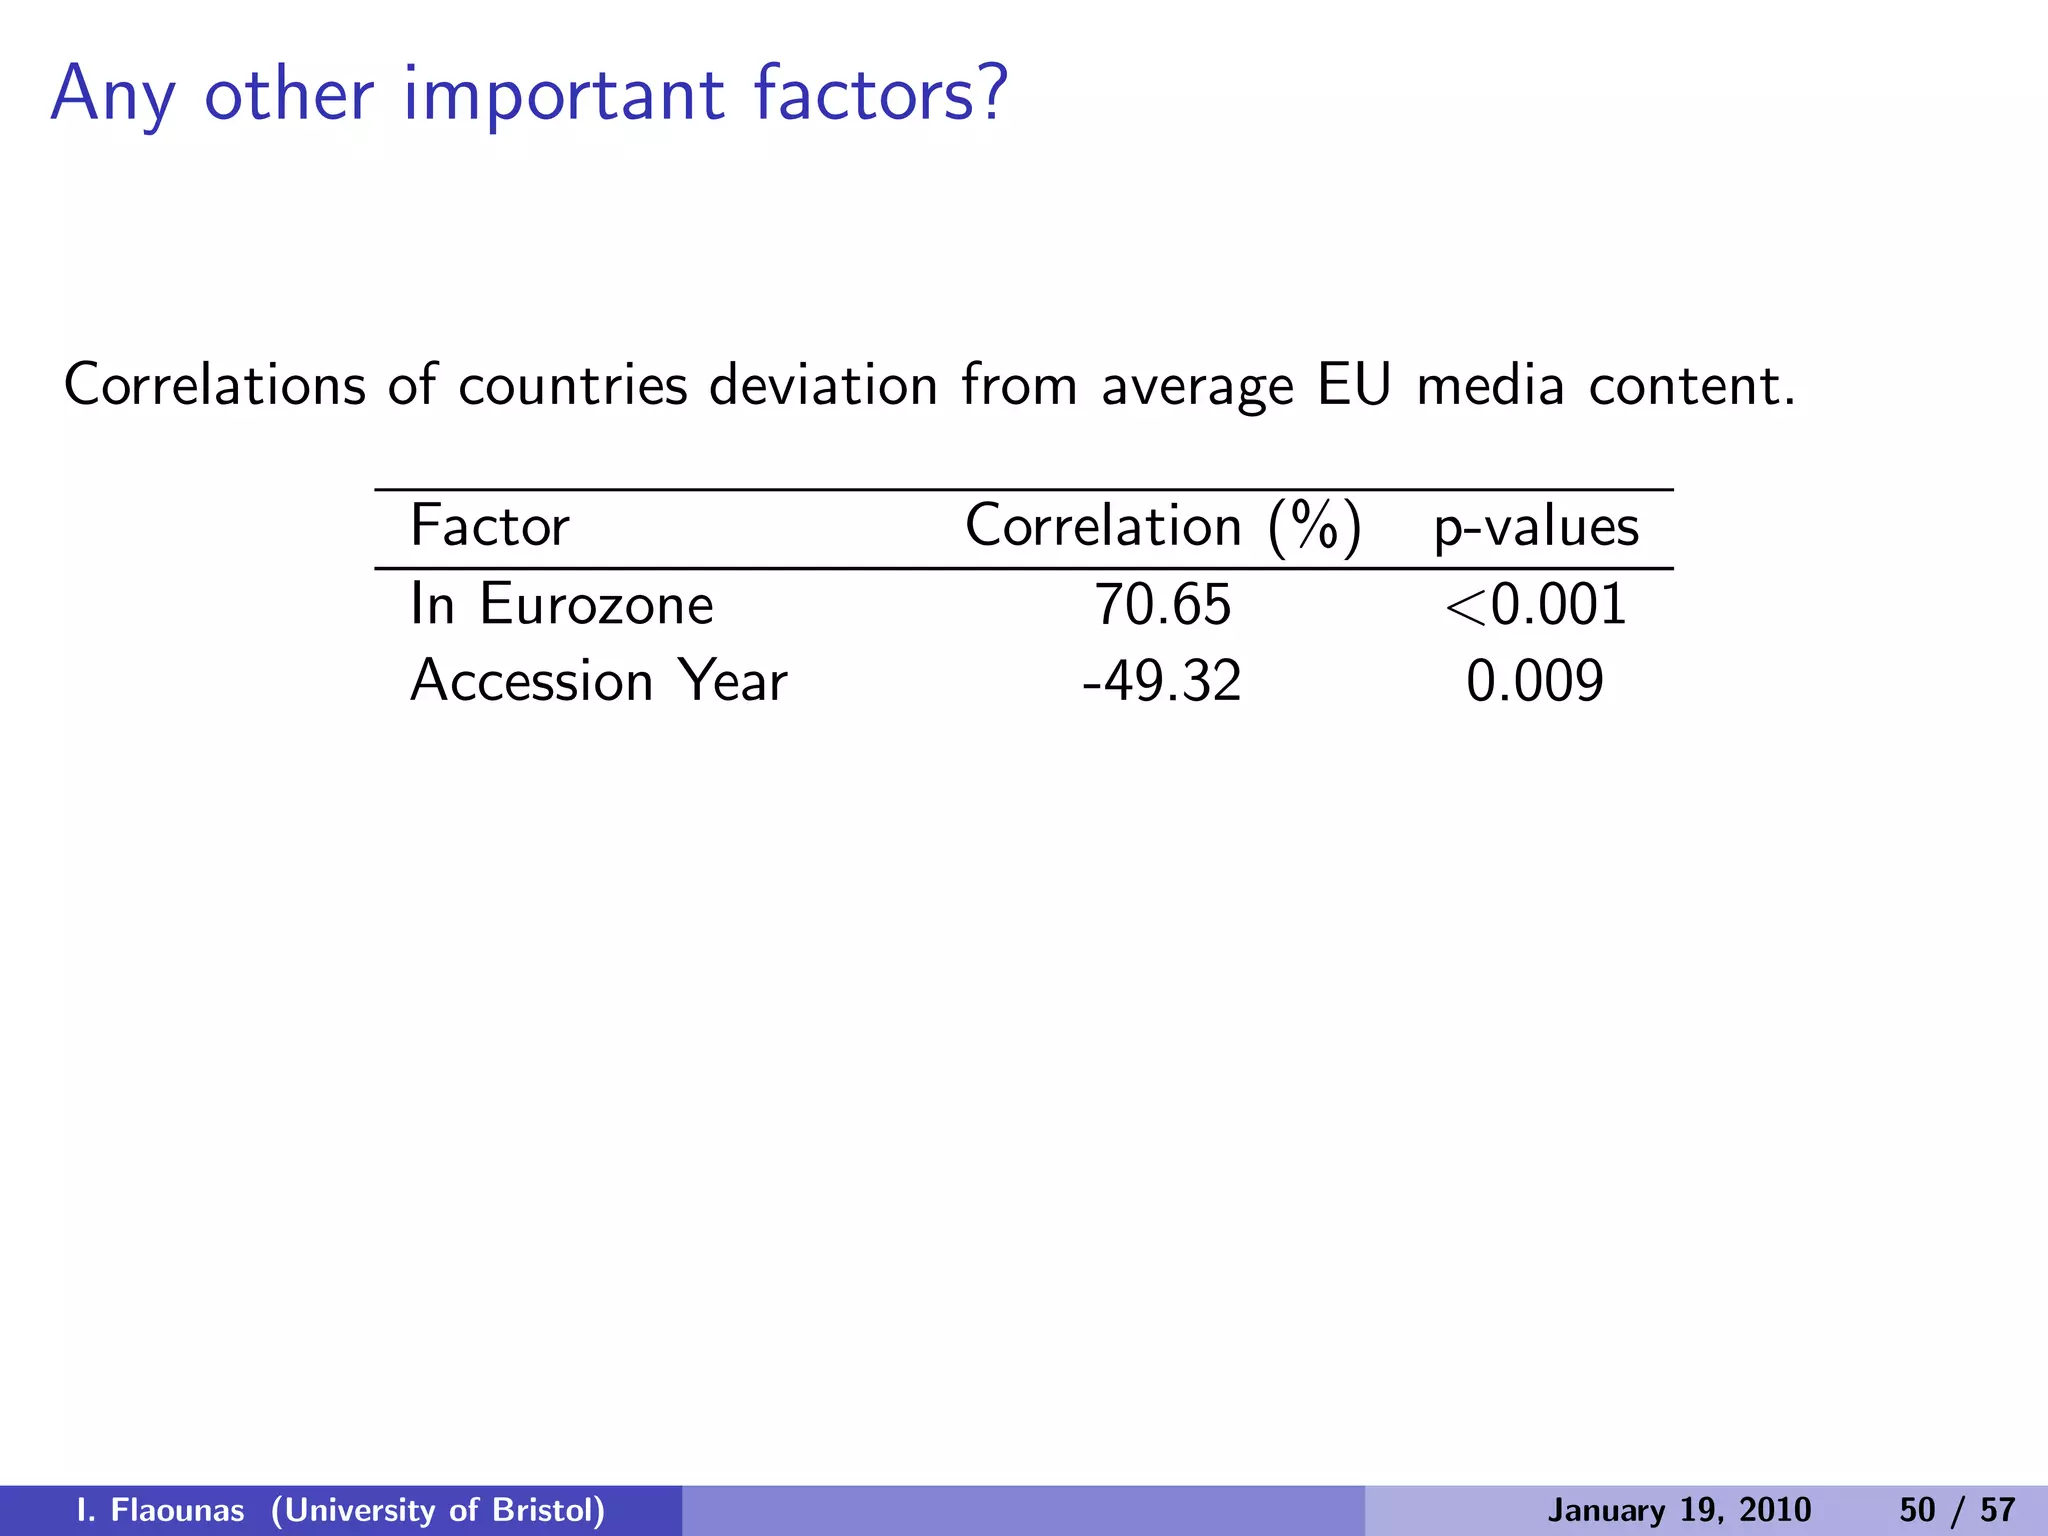
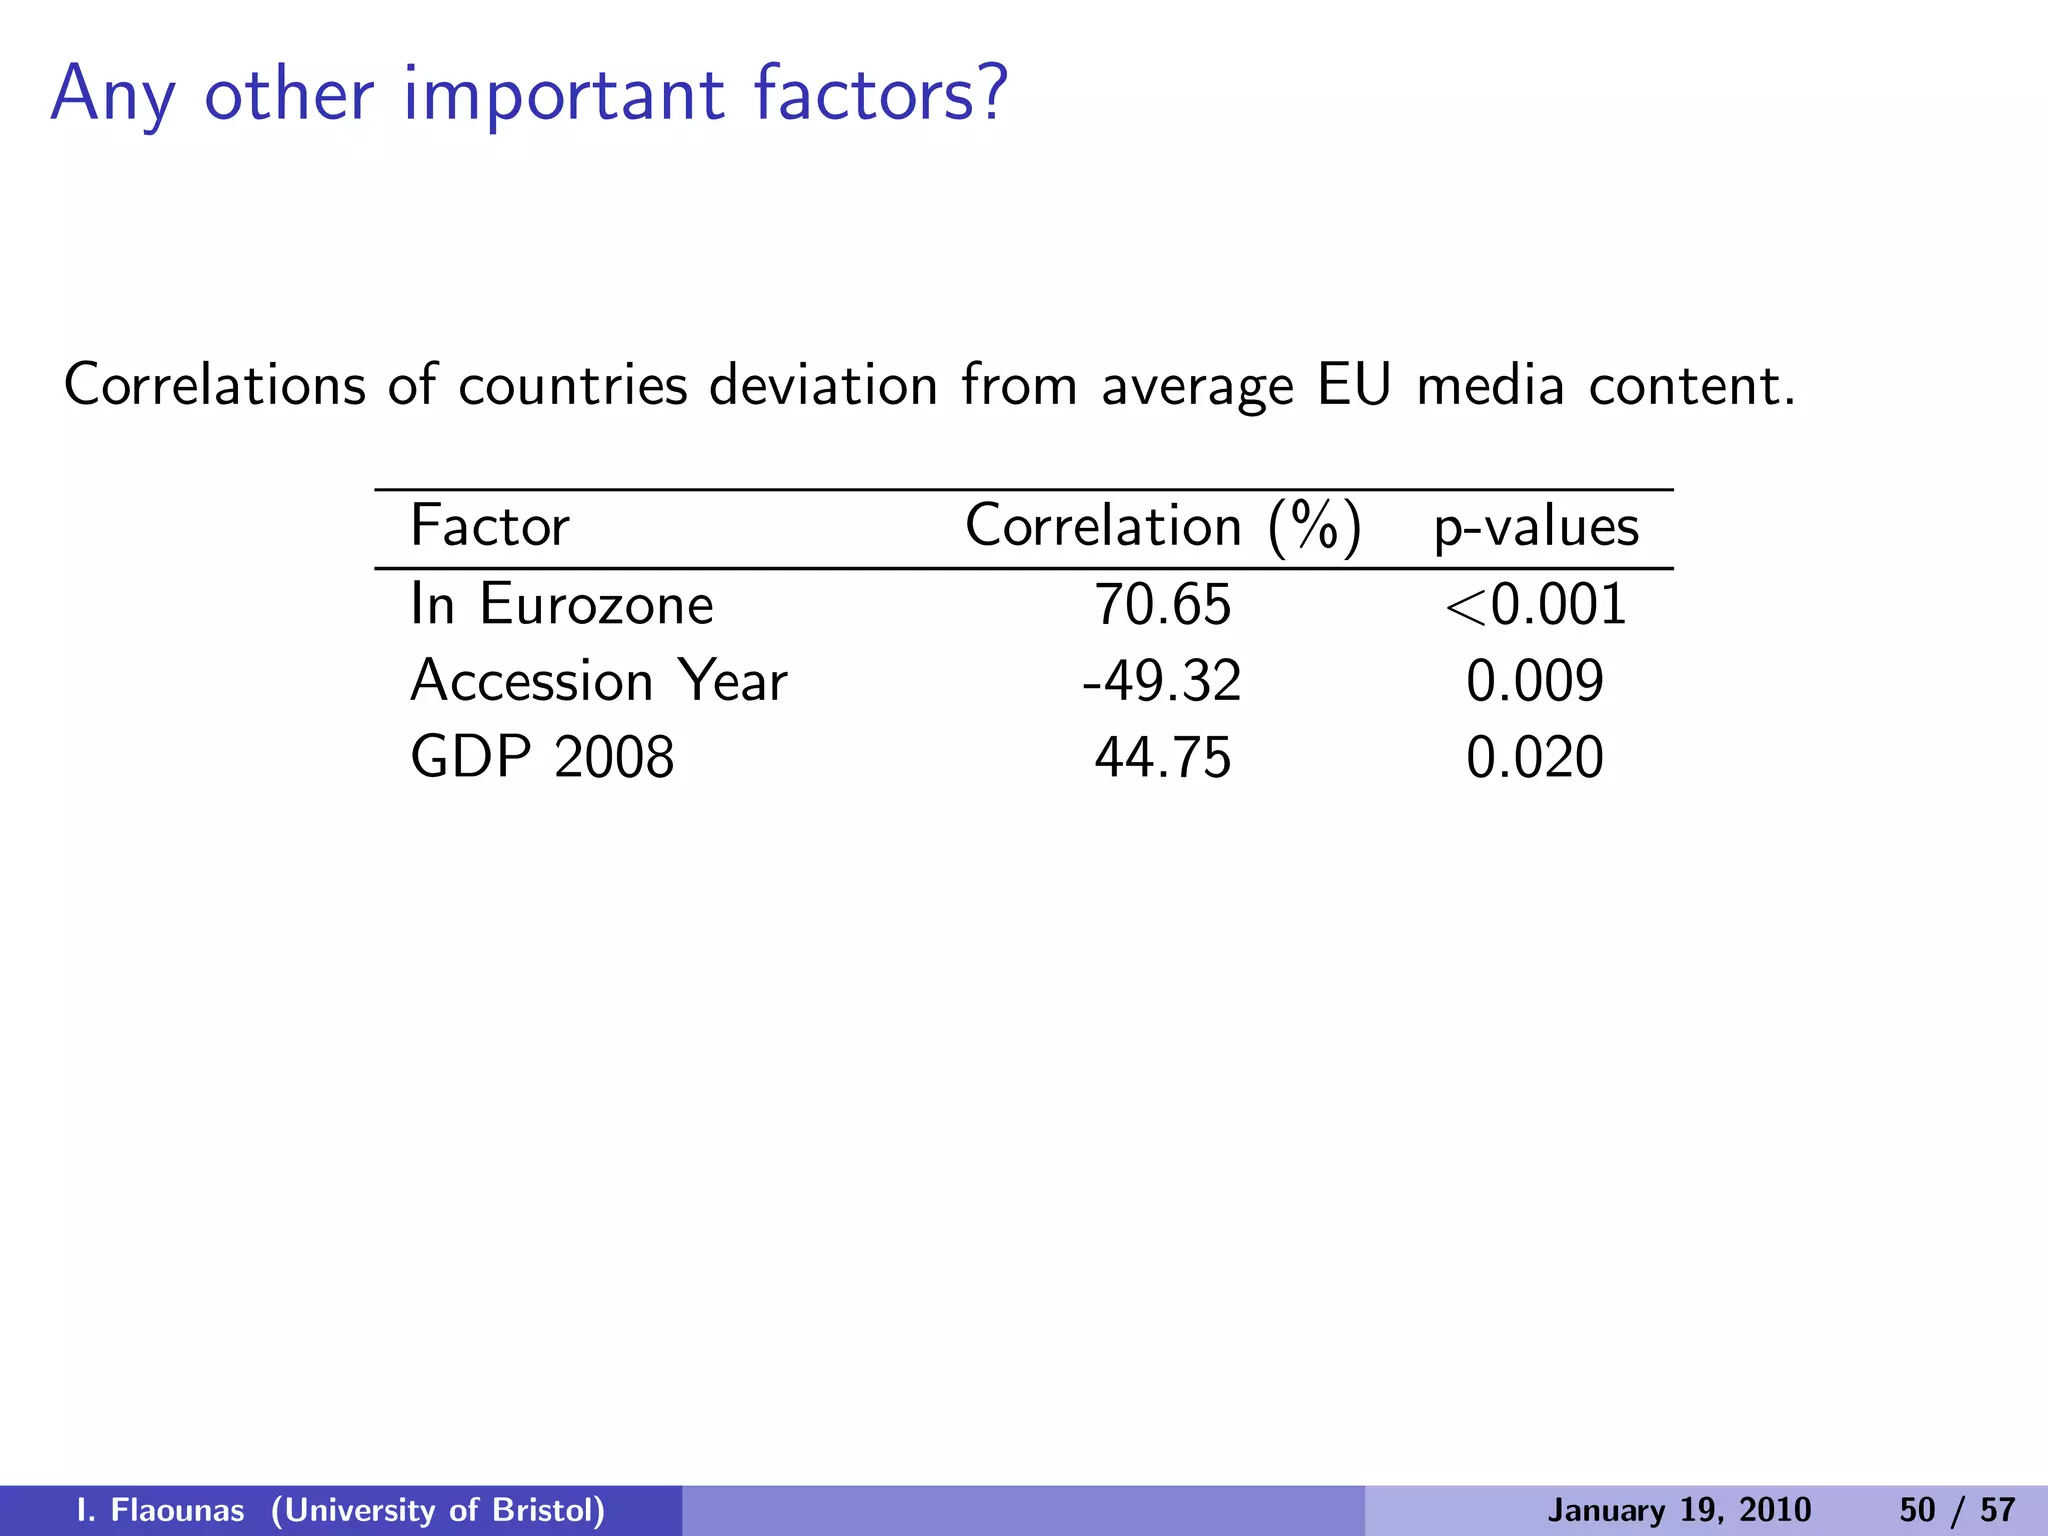
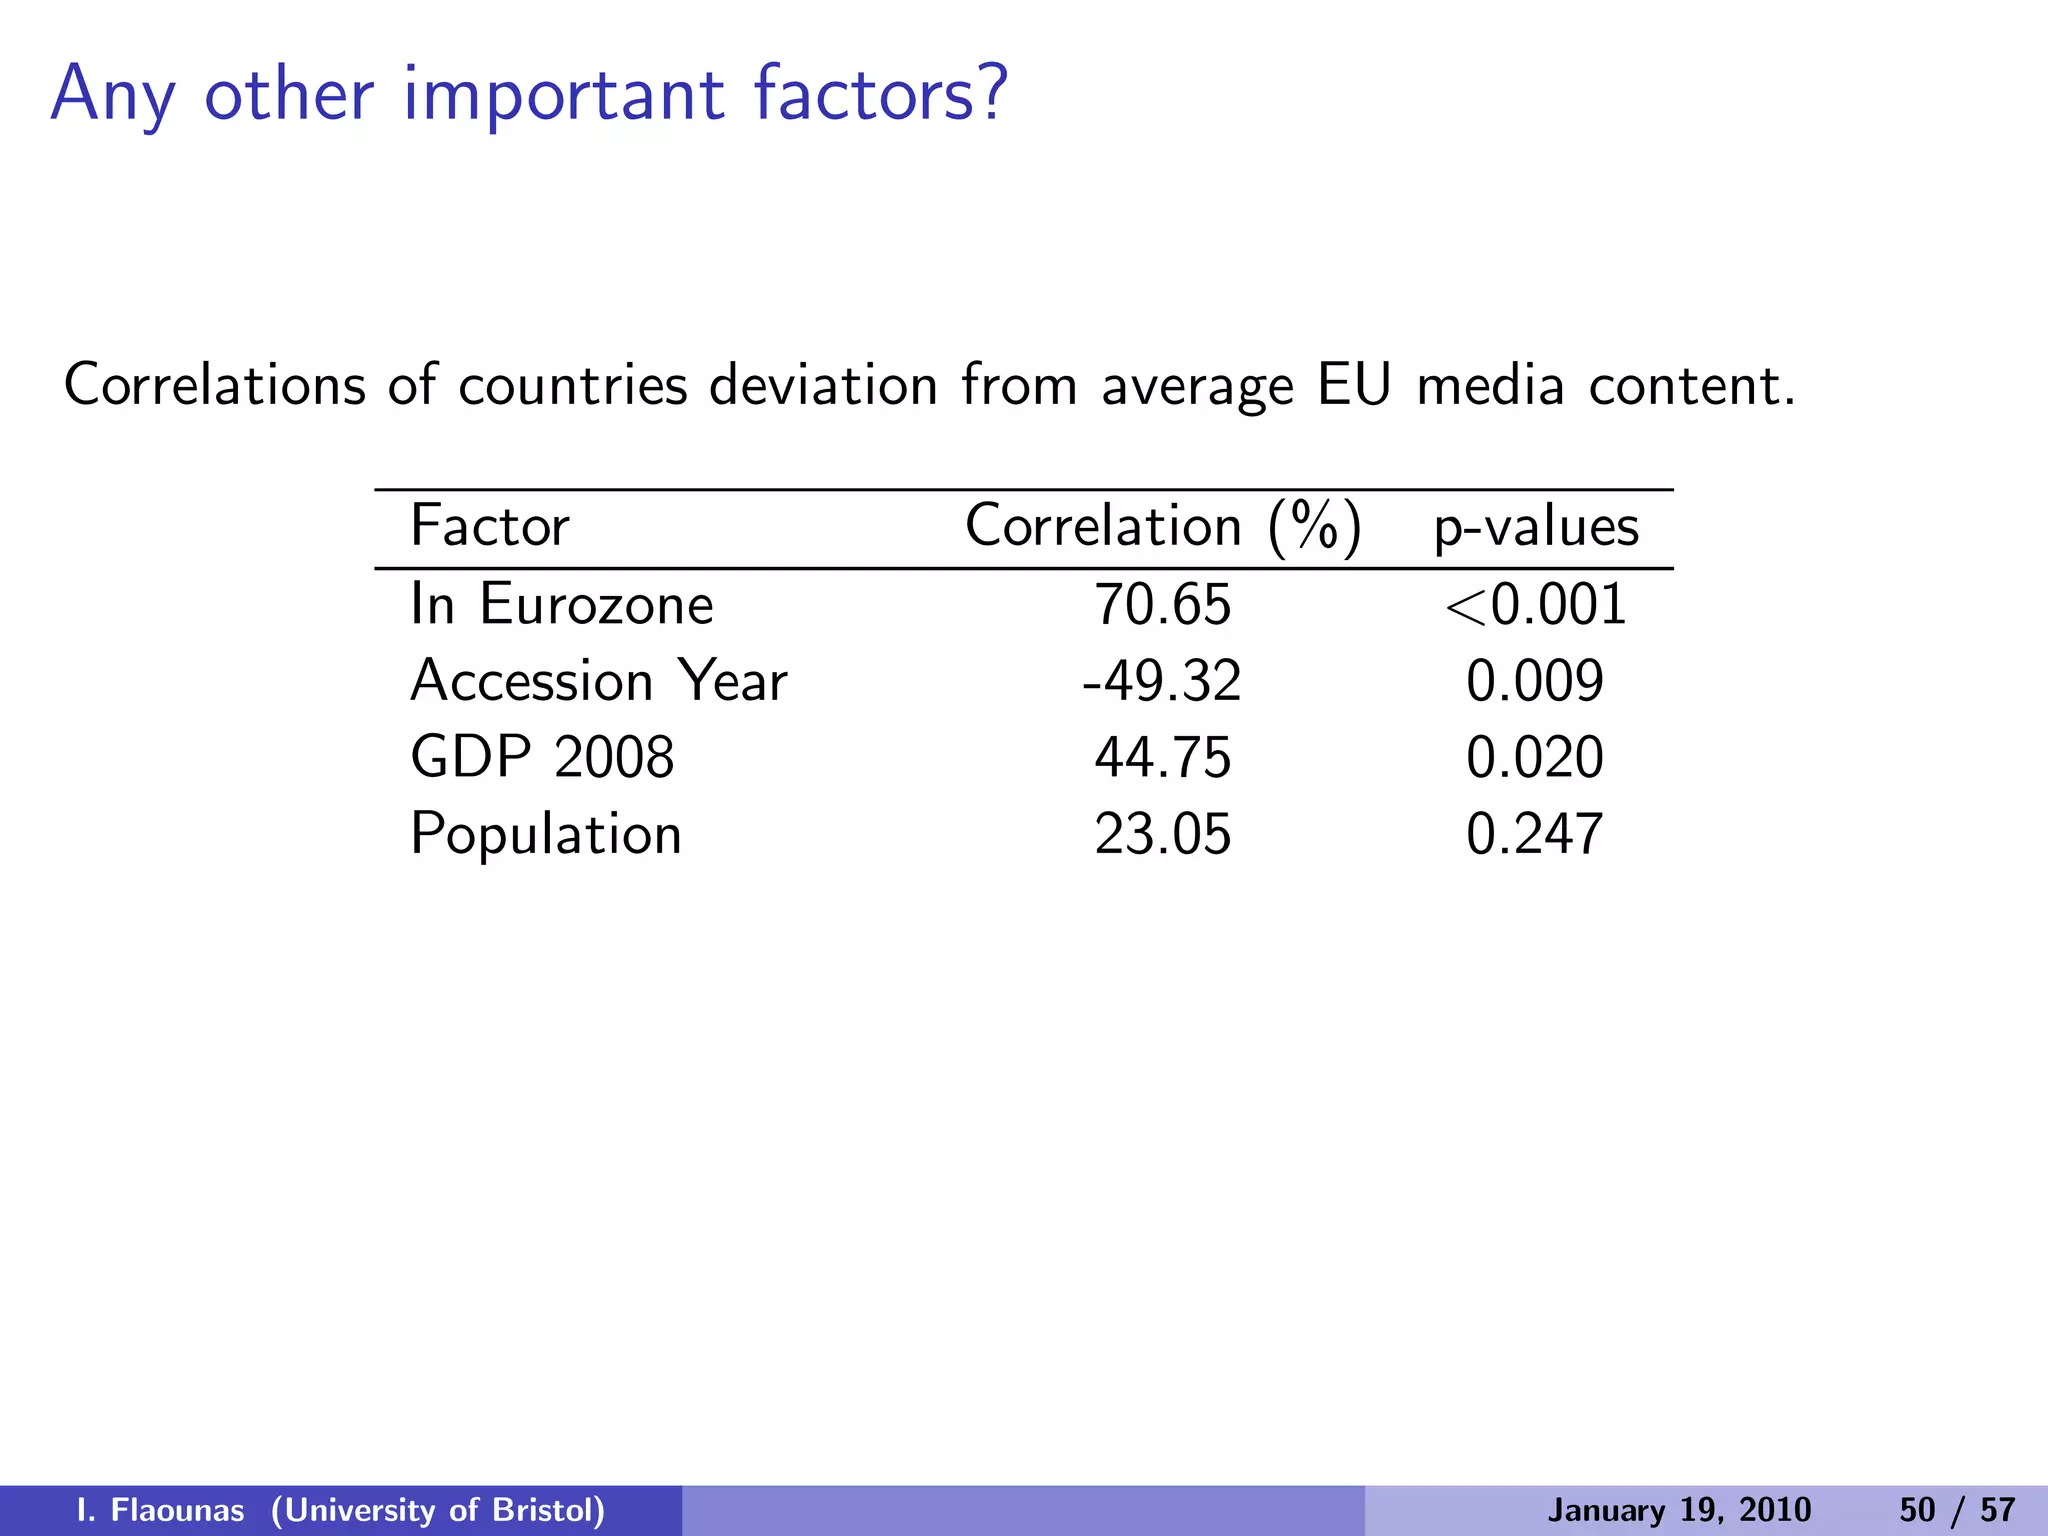
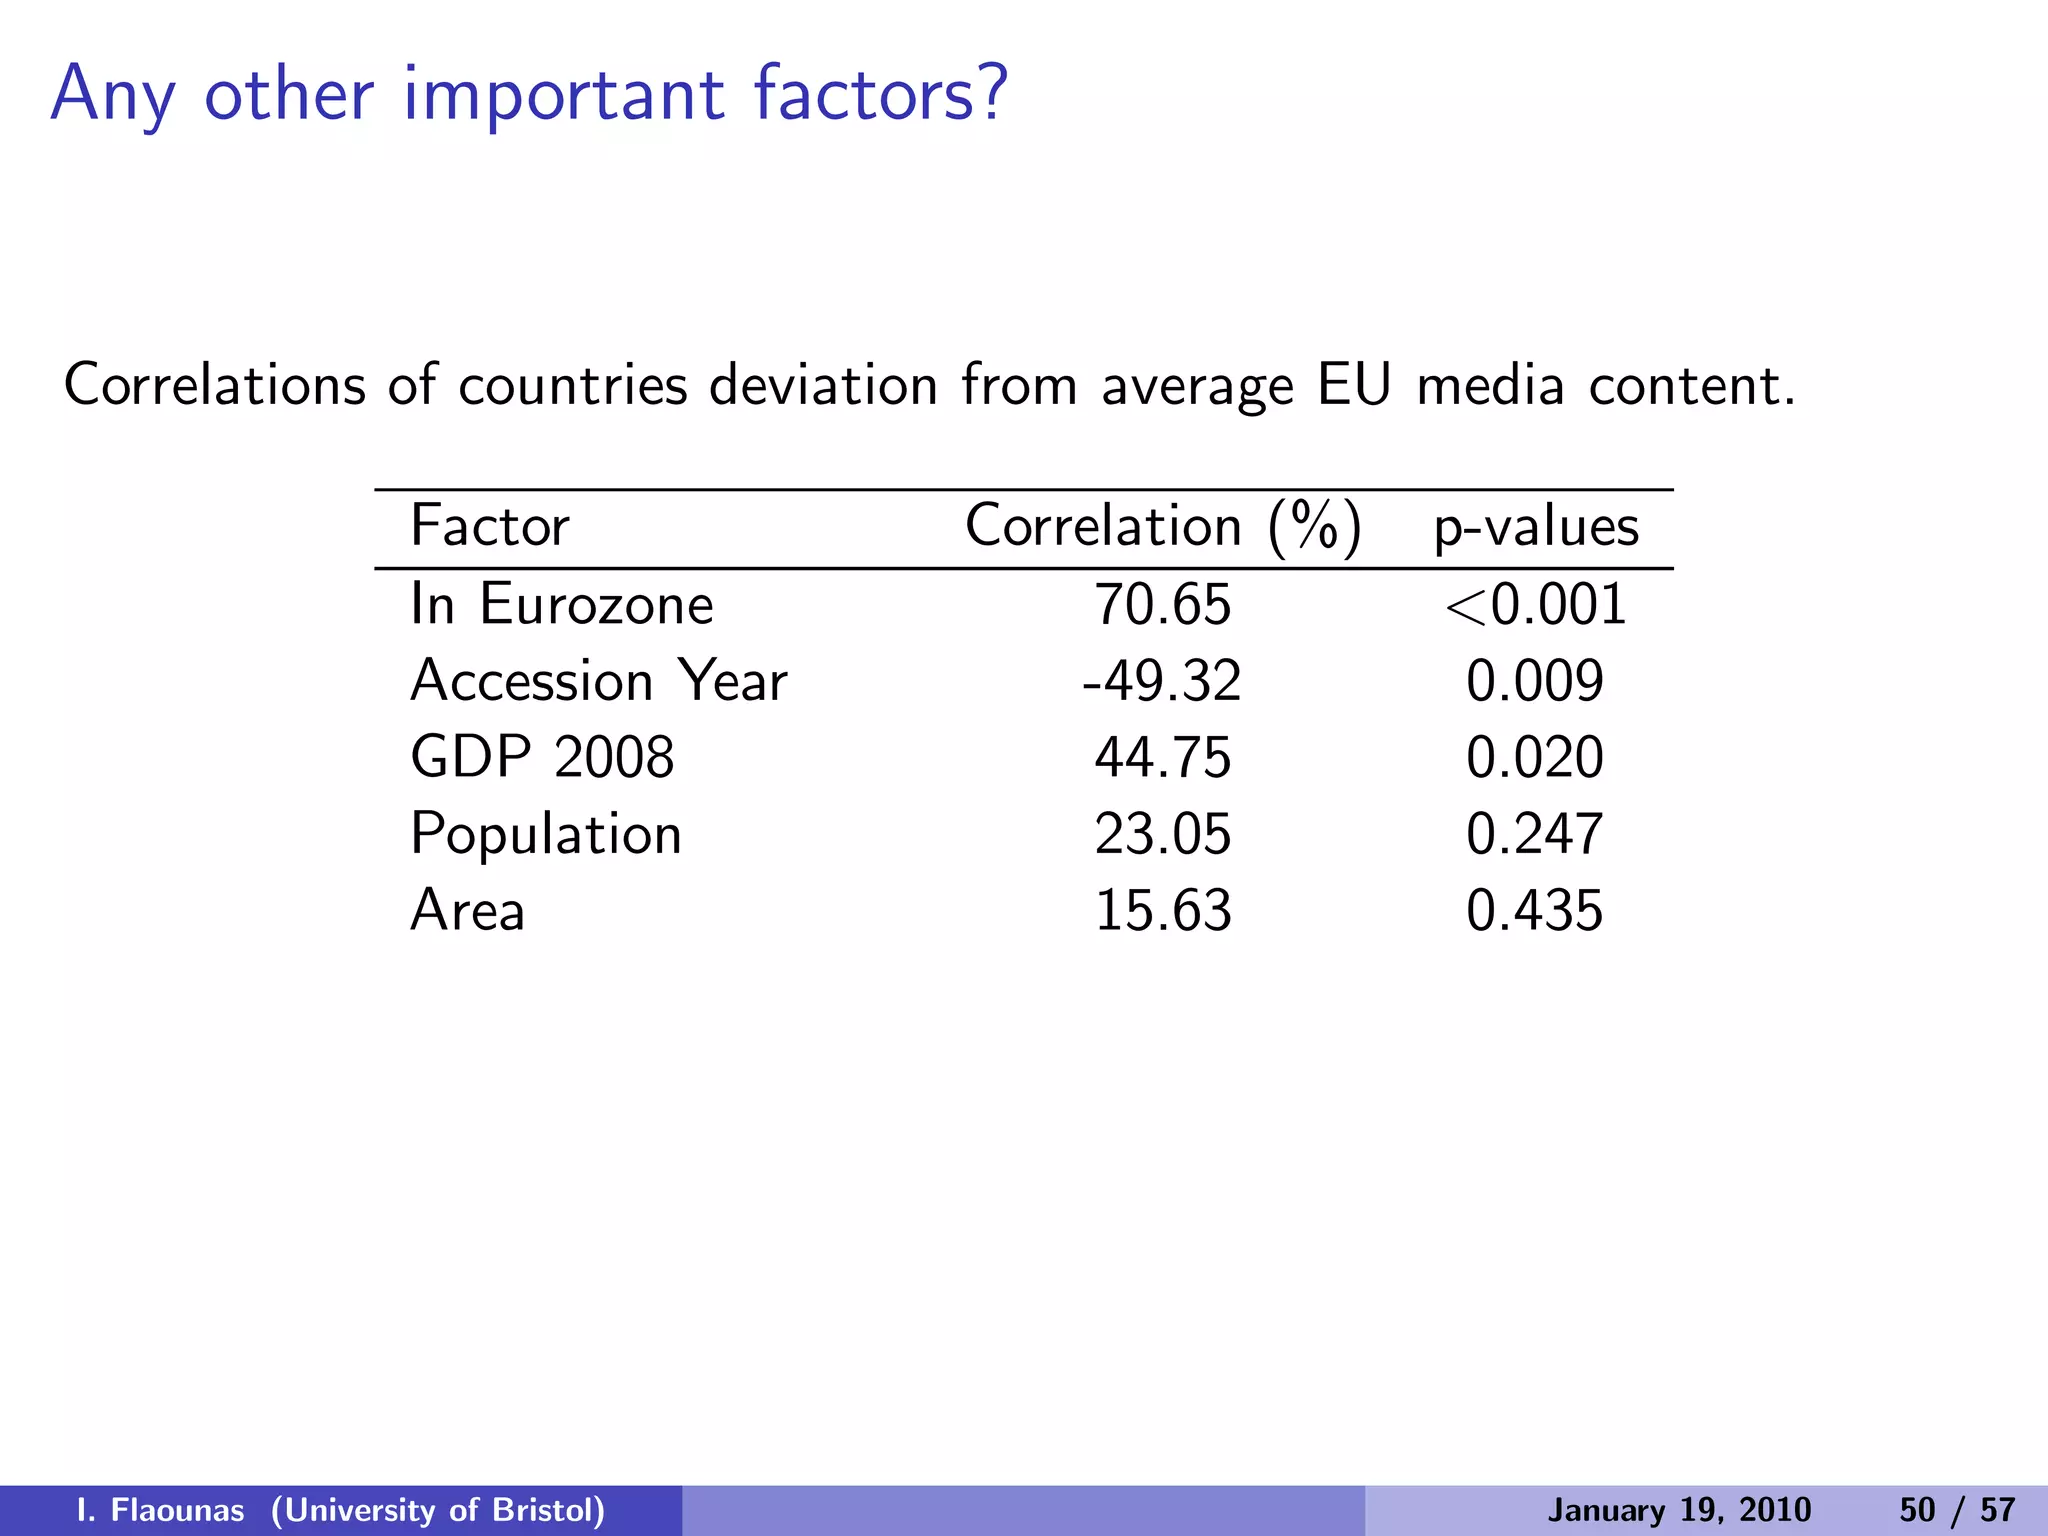
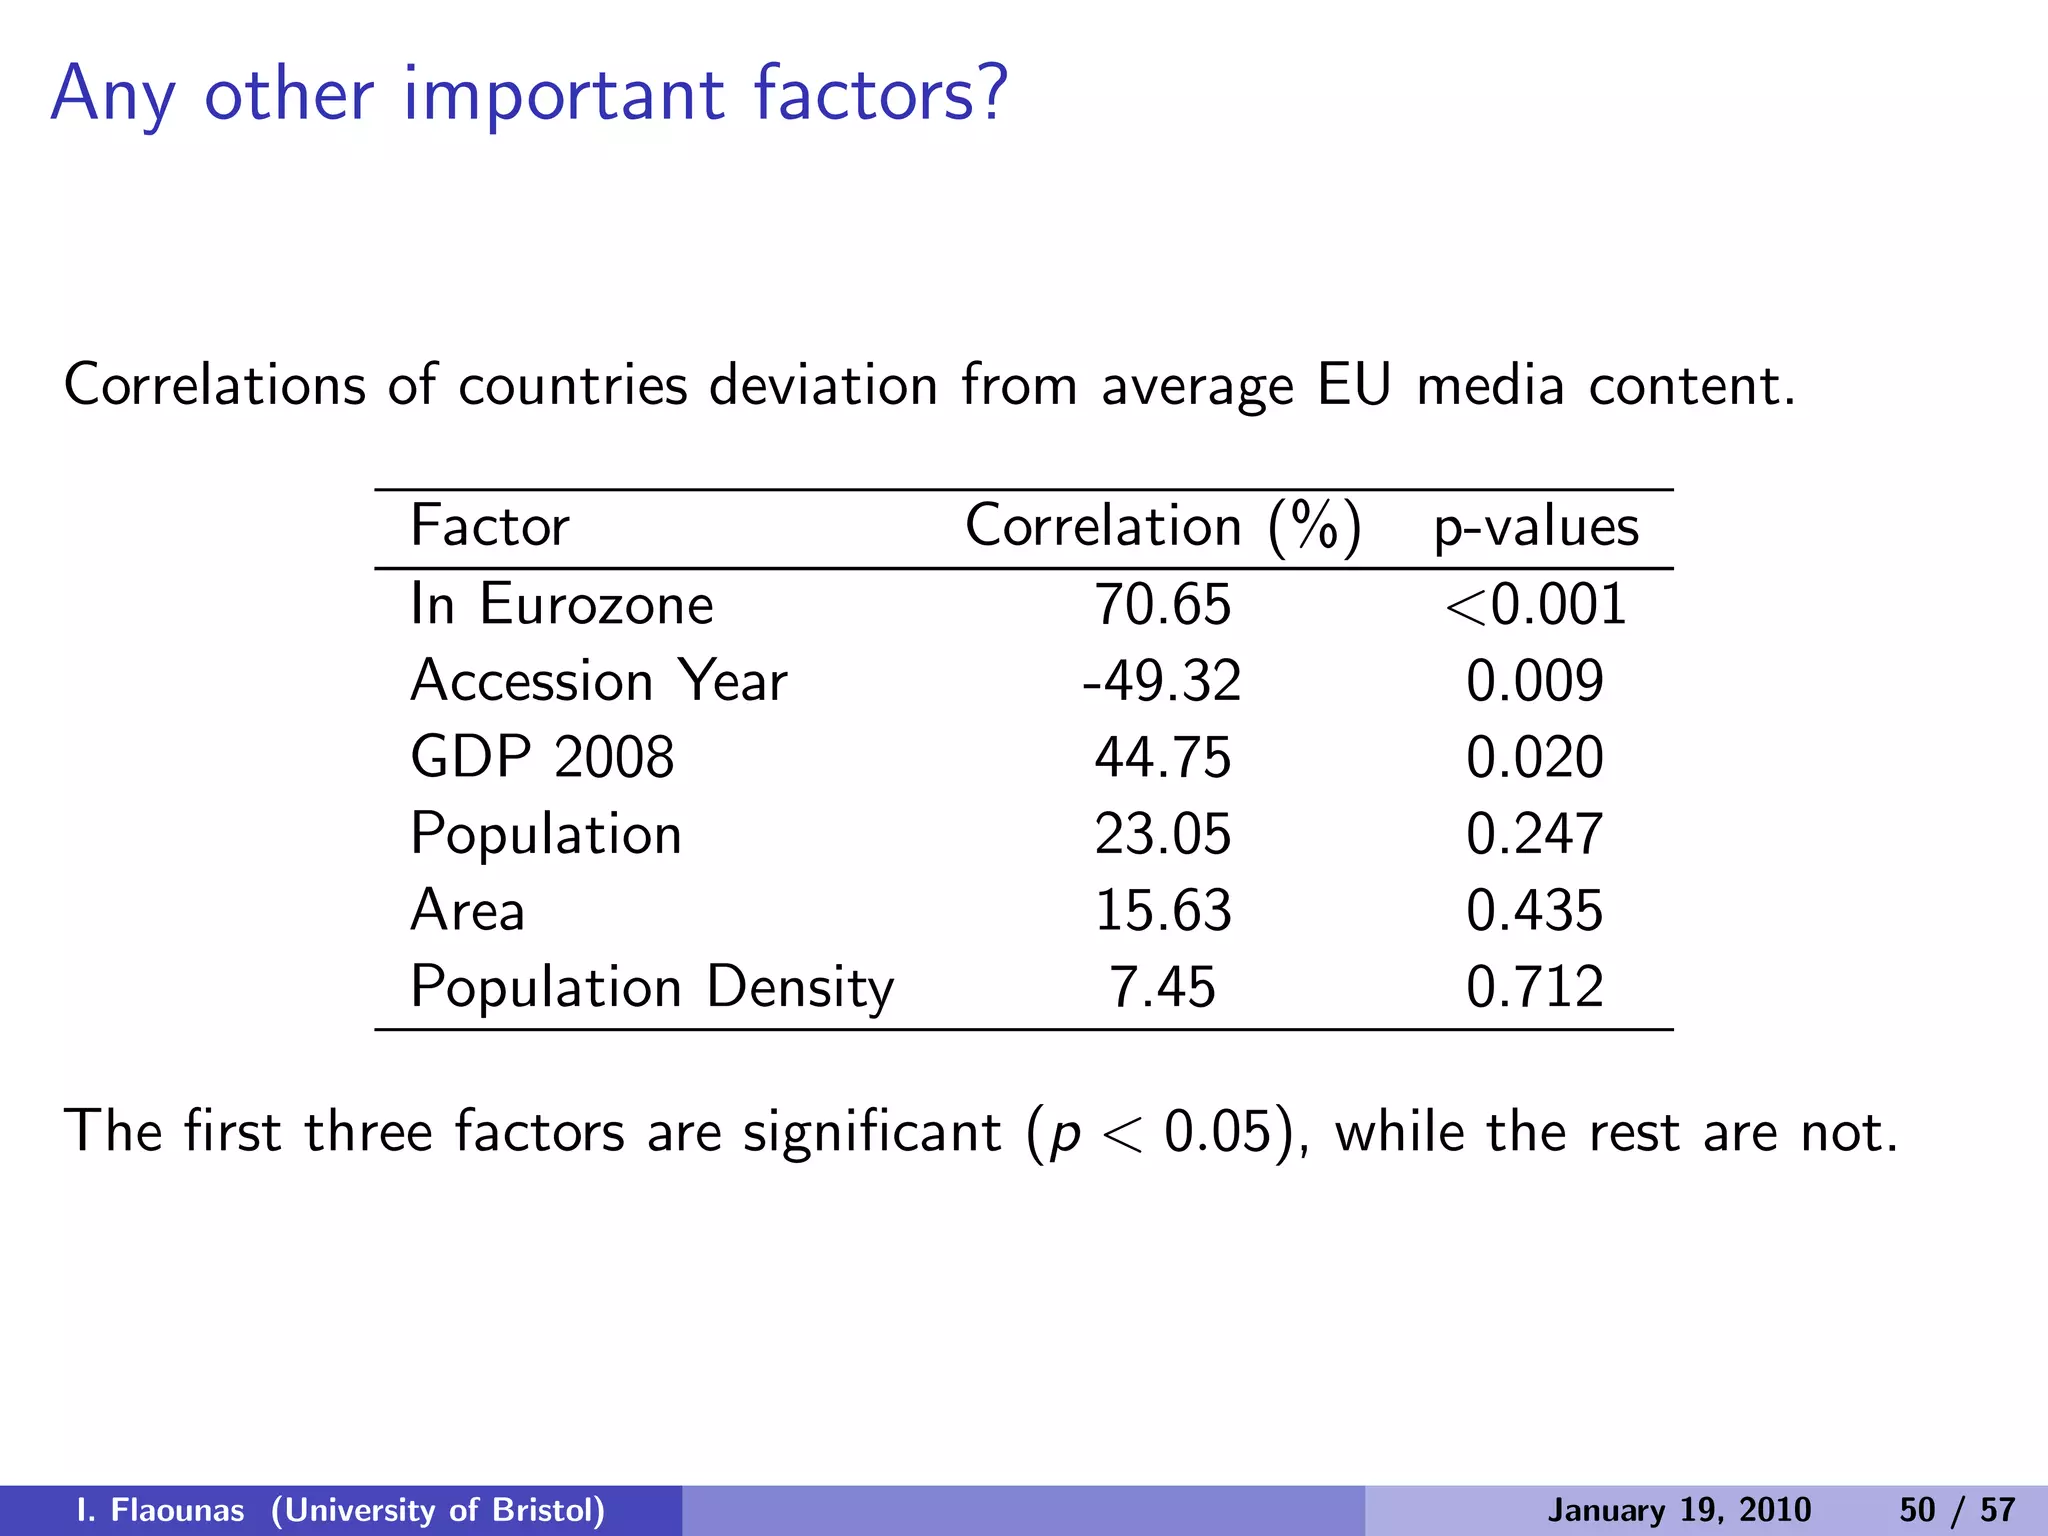
![Can we explain relations of countries?
We found significant (p < 0.001) correlation of countries’ media-content
similarity to their:
Geographical proximity — based on sharing of borders 33.86%
Economical proximity — based on trade volume 31.03%
Cultural proximity — based on song contest votting patterns 32.05%
UK Metro, Dec. 8, 2010: Countries that always vote for each other in the
Eurovision song contest, have a shared interest in news content, as well as
terrible music, a study has shown [...]
I. Flaounas (University of Bristol) January 19, 2010 46 / 57](https://image.slidesharecdn.com/mediapatternsdemokritos-150524075422-lva1-app6891/75/Detecting-Patterns-in-News-Media-Content-69-2048.jpg)

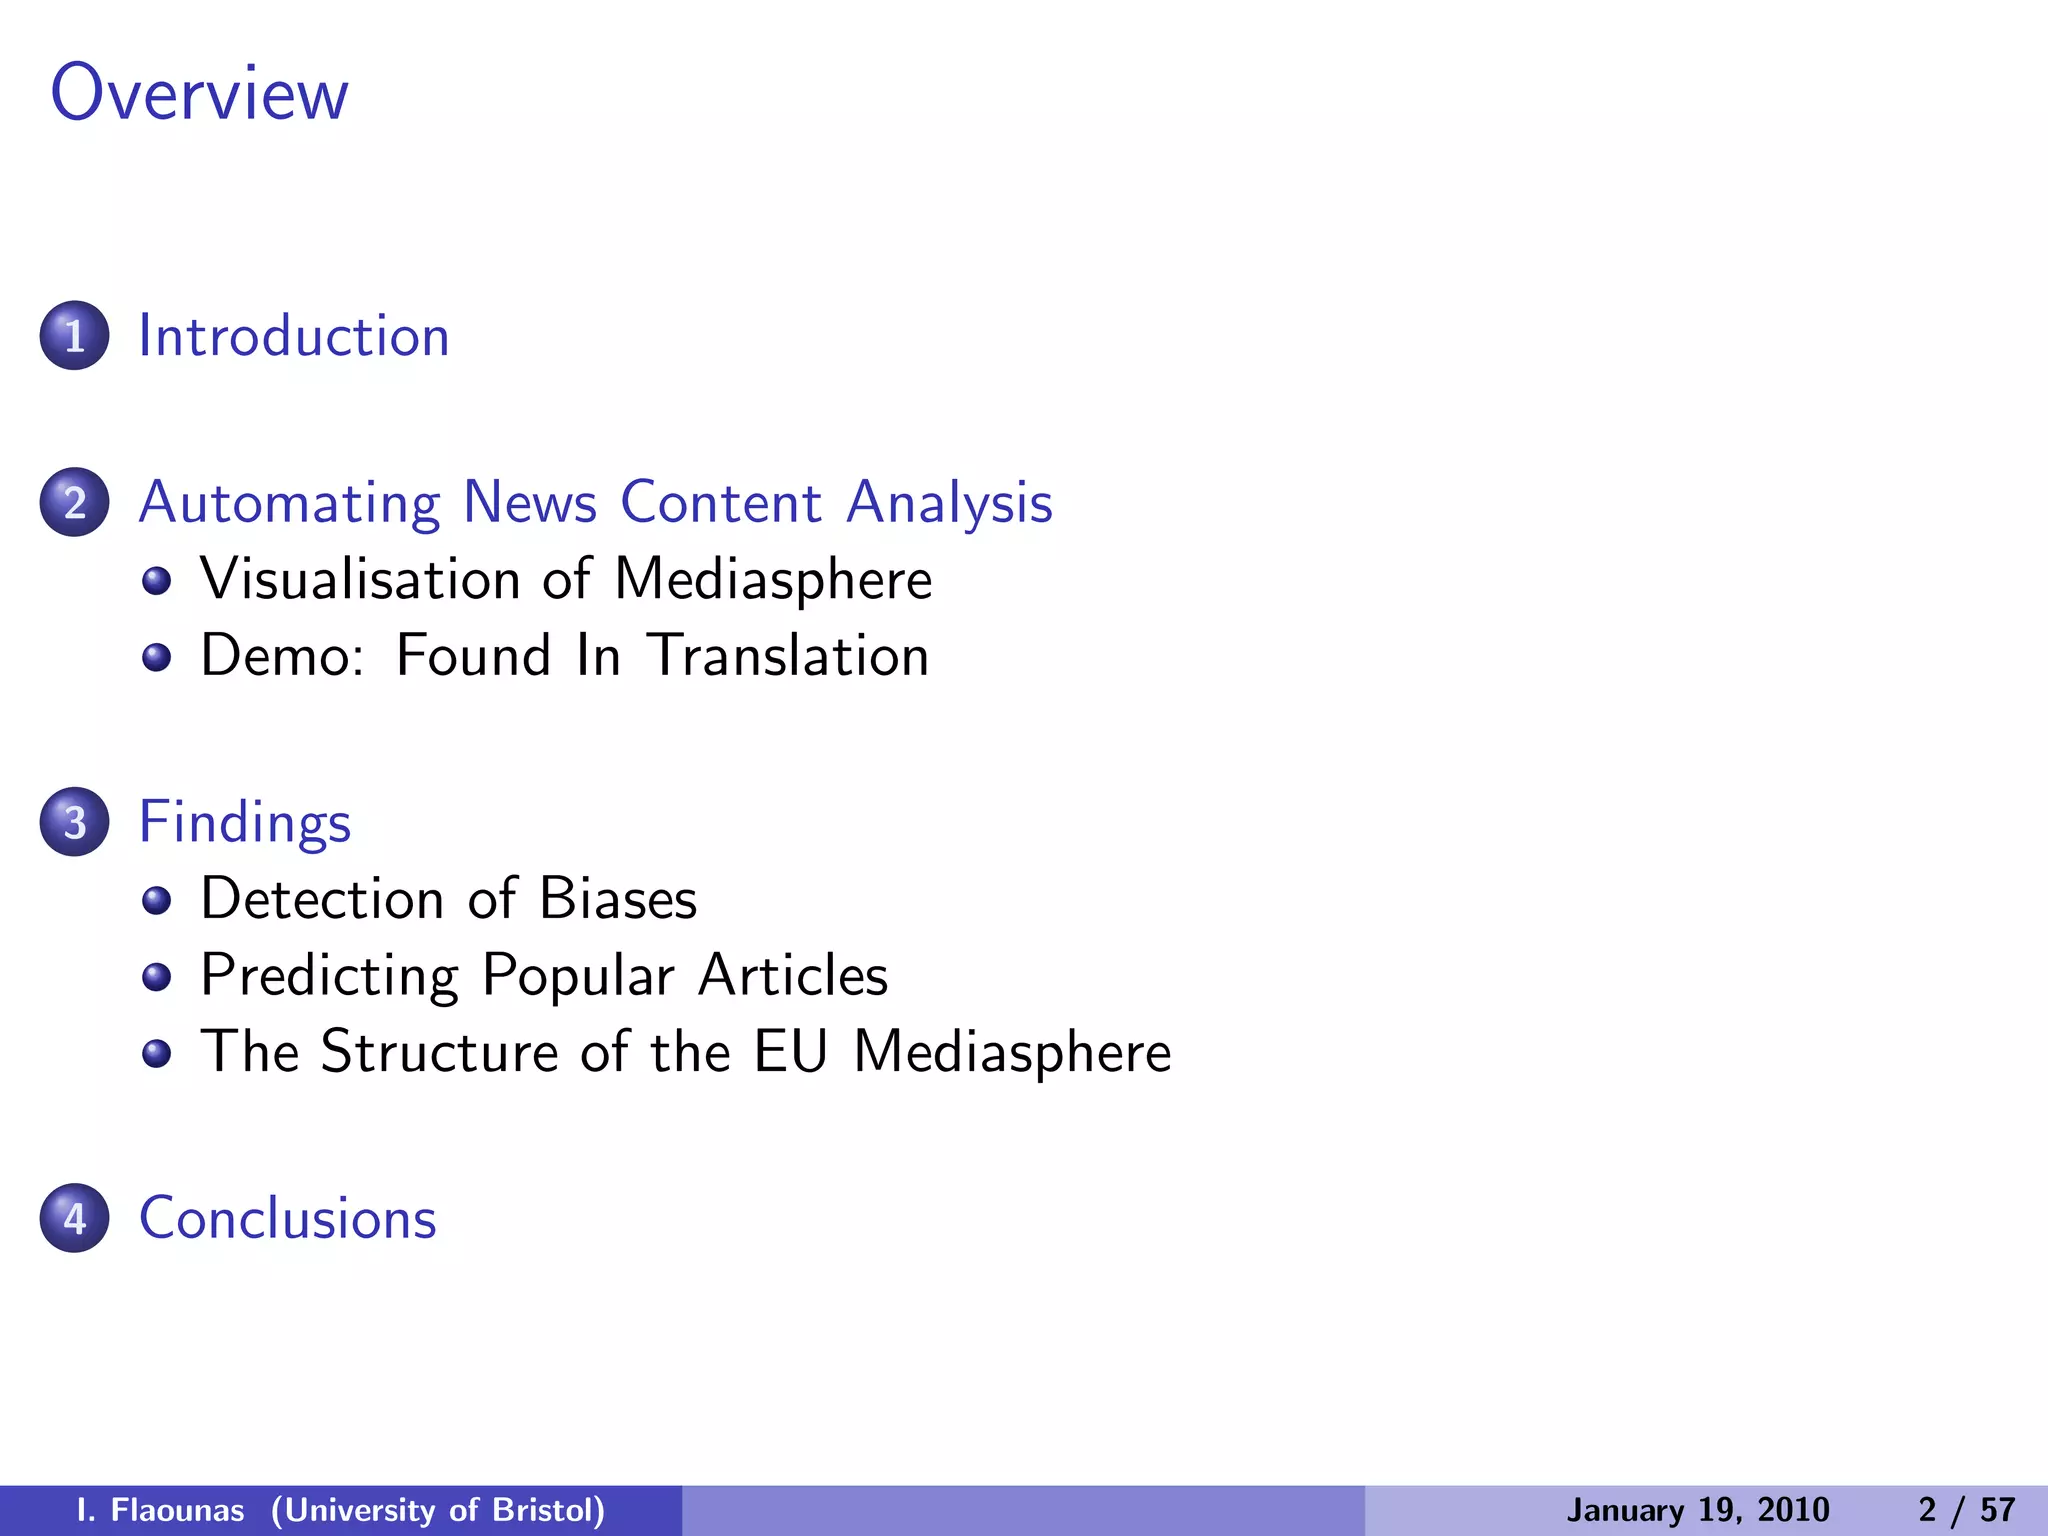
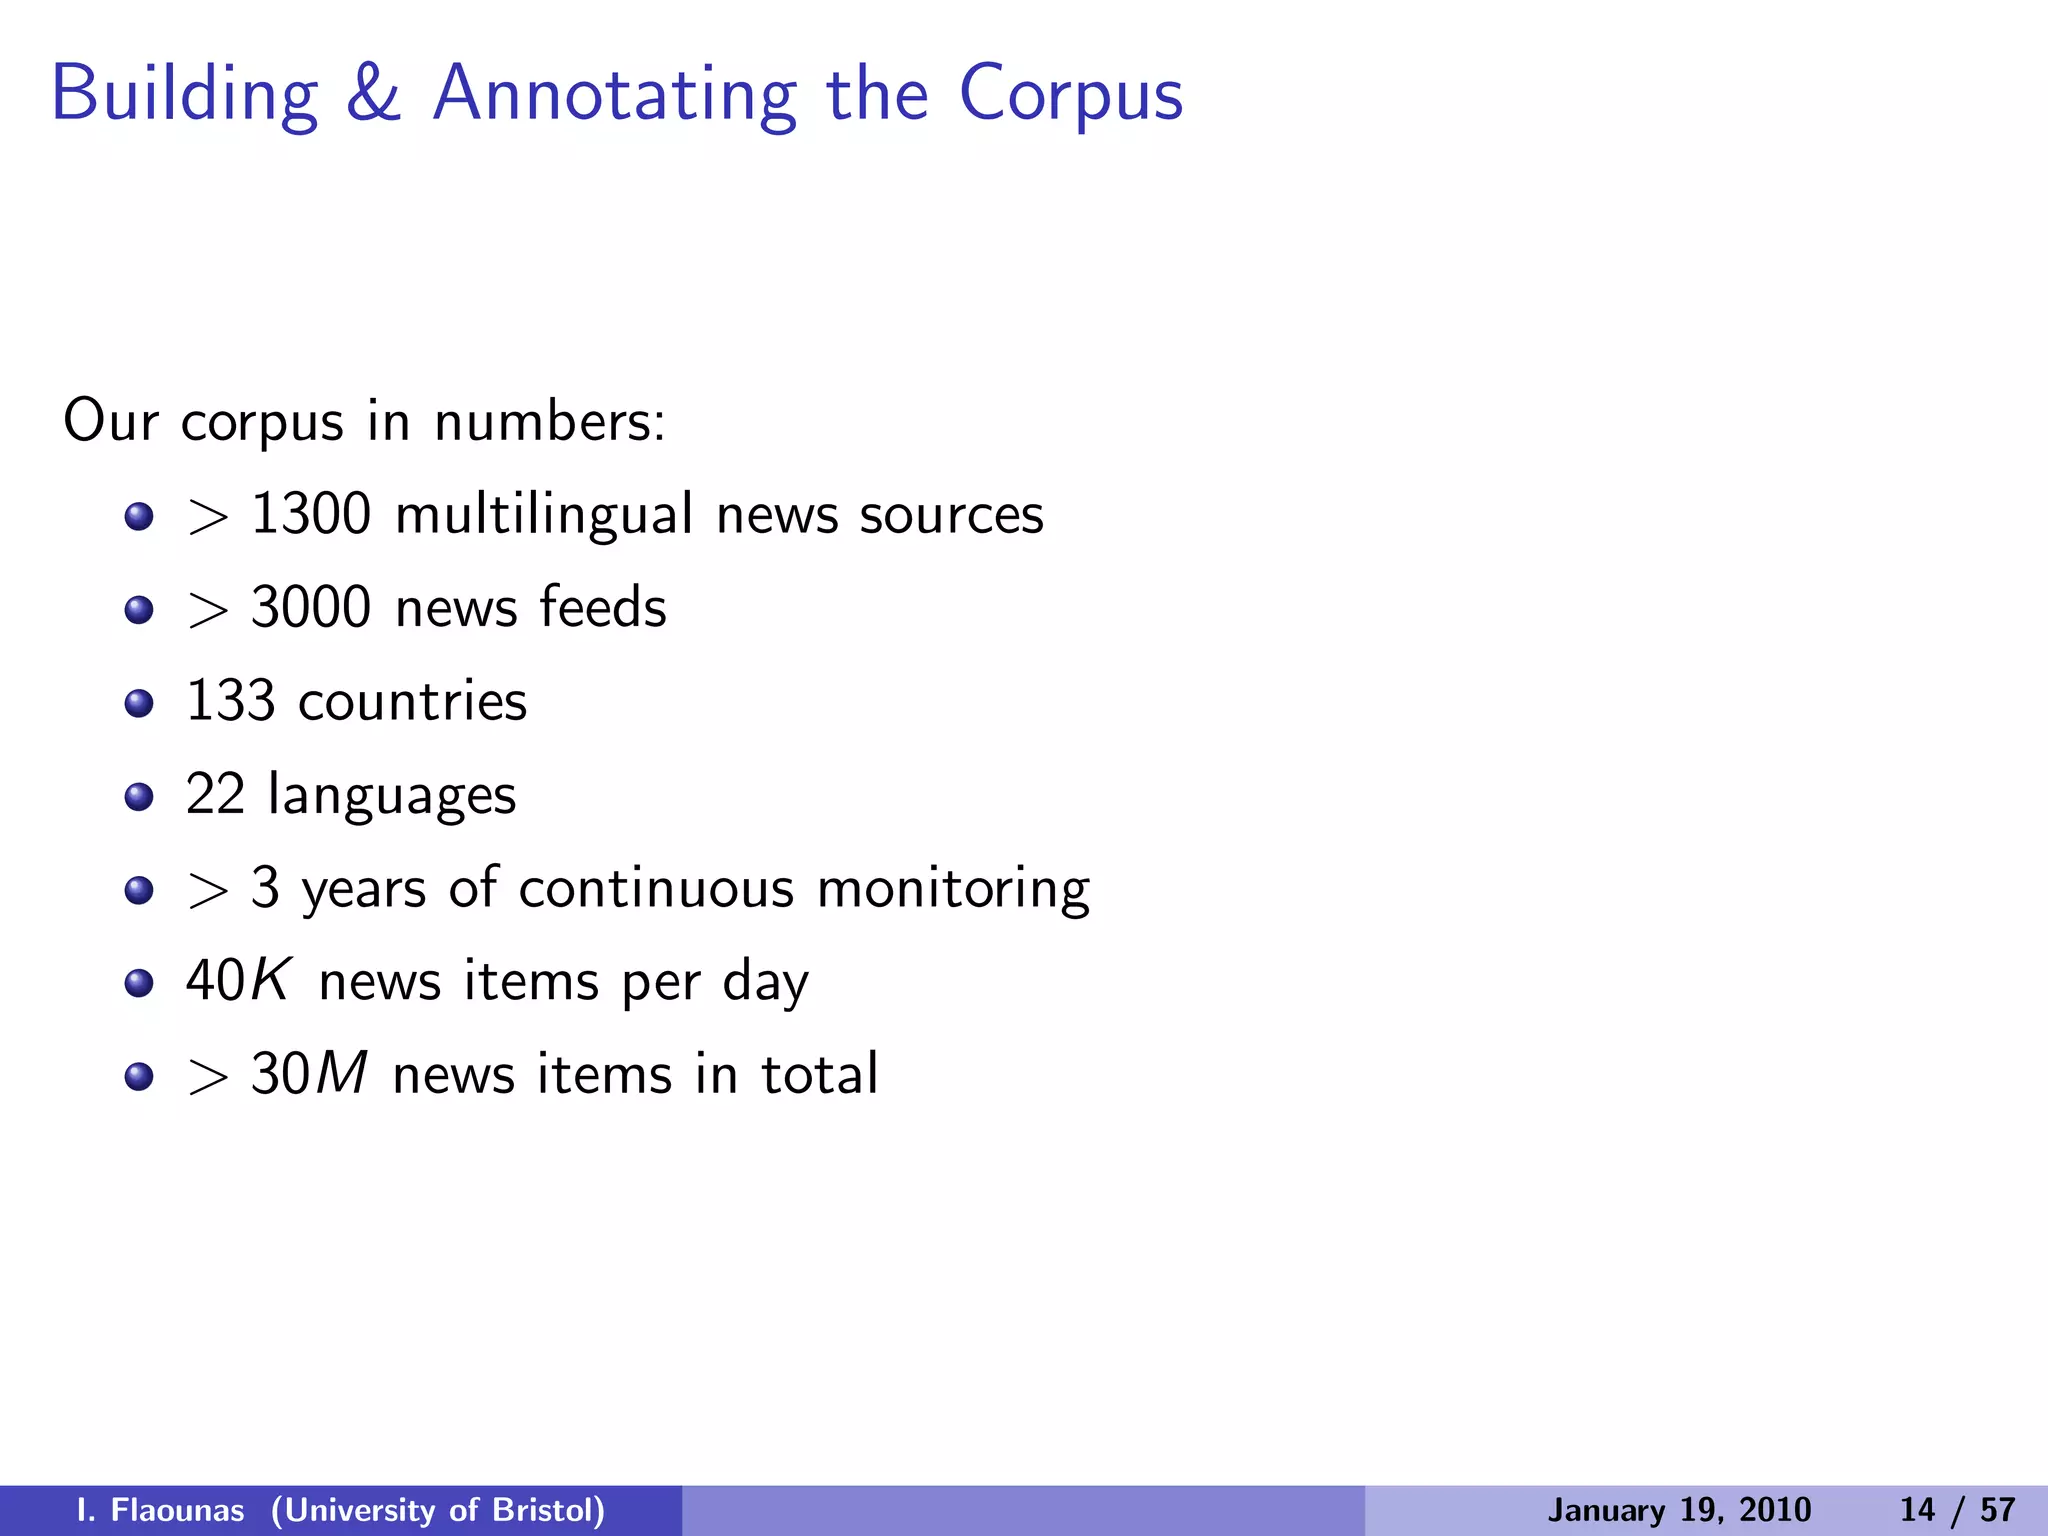
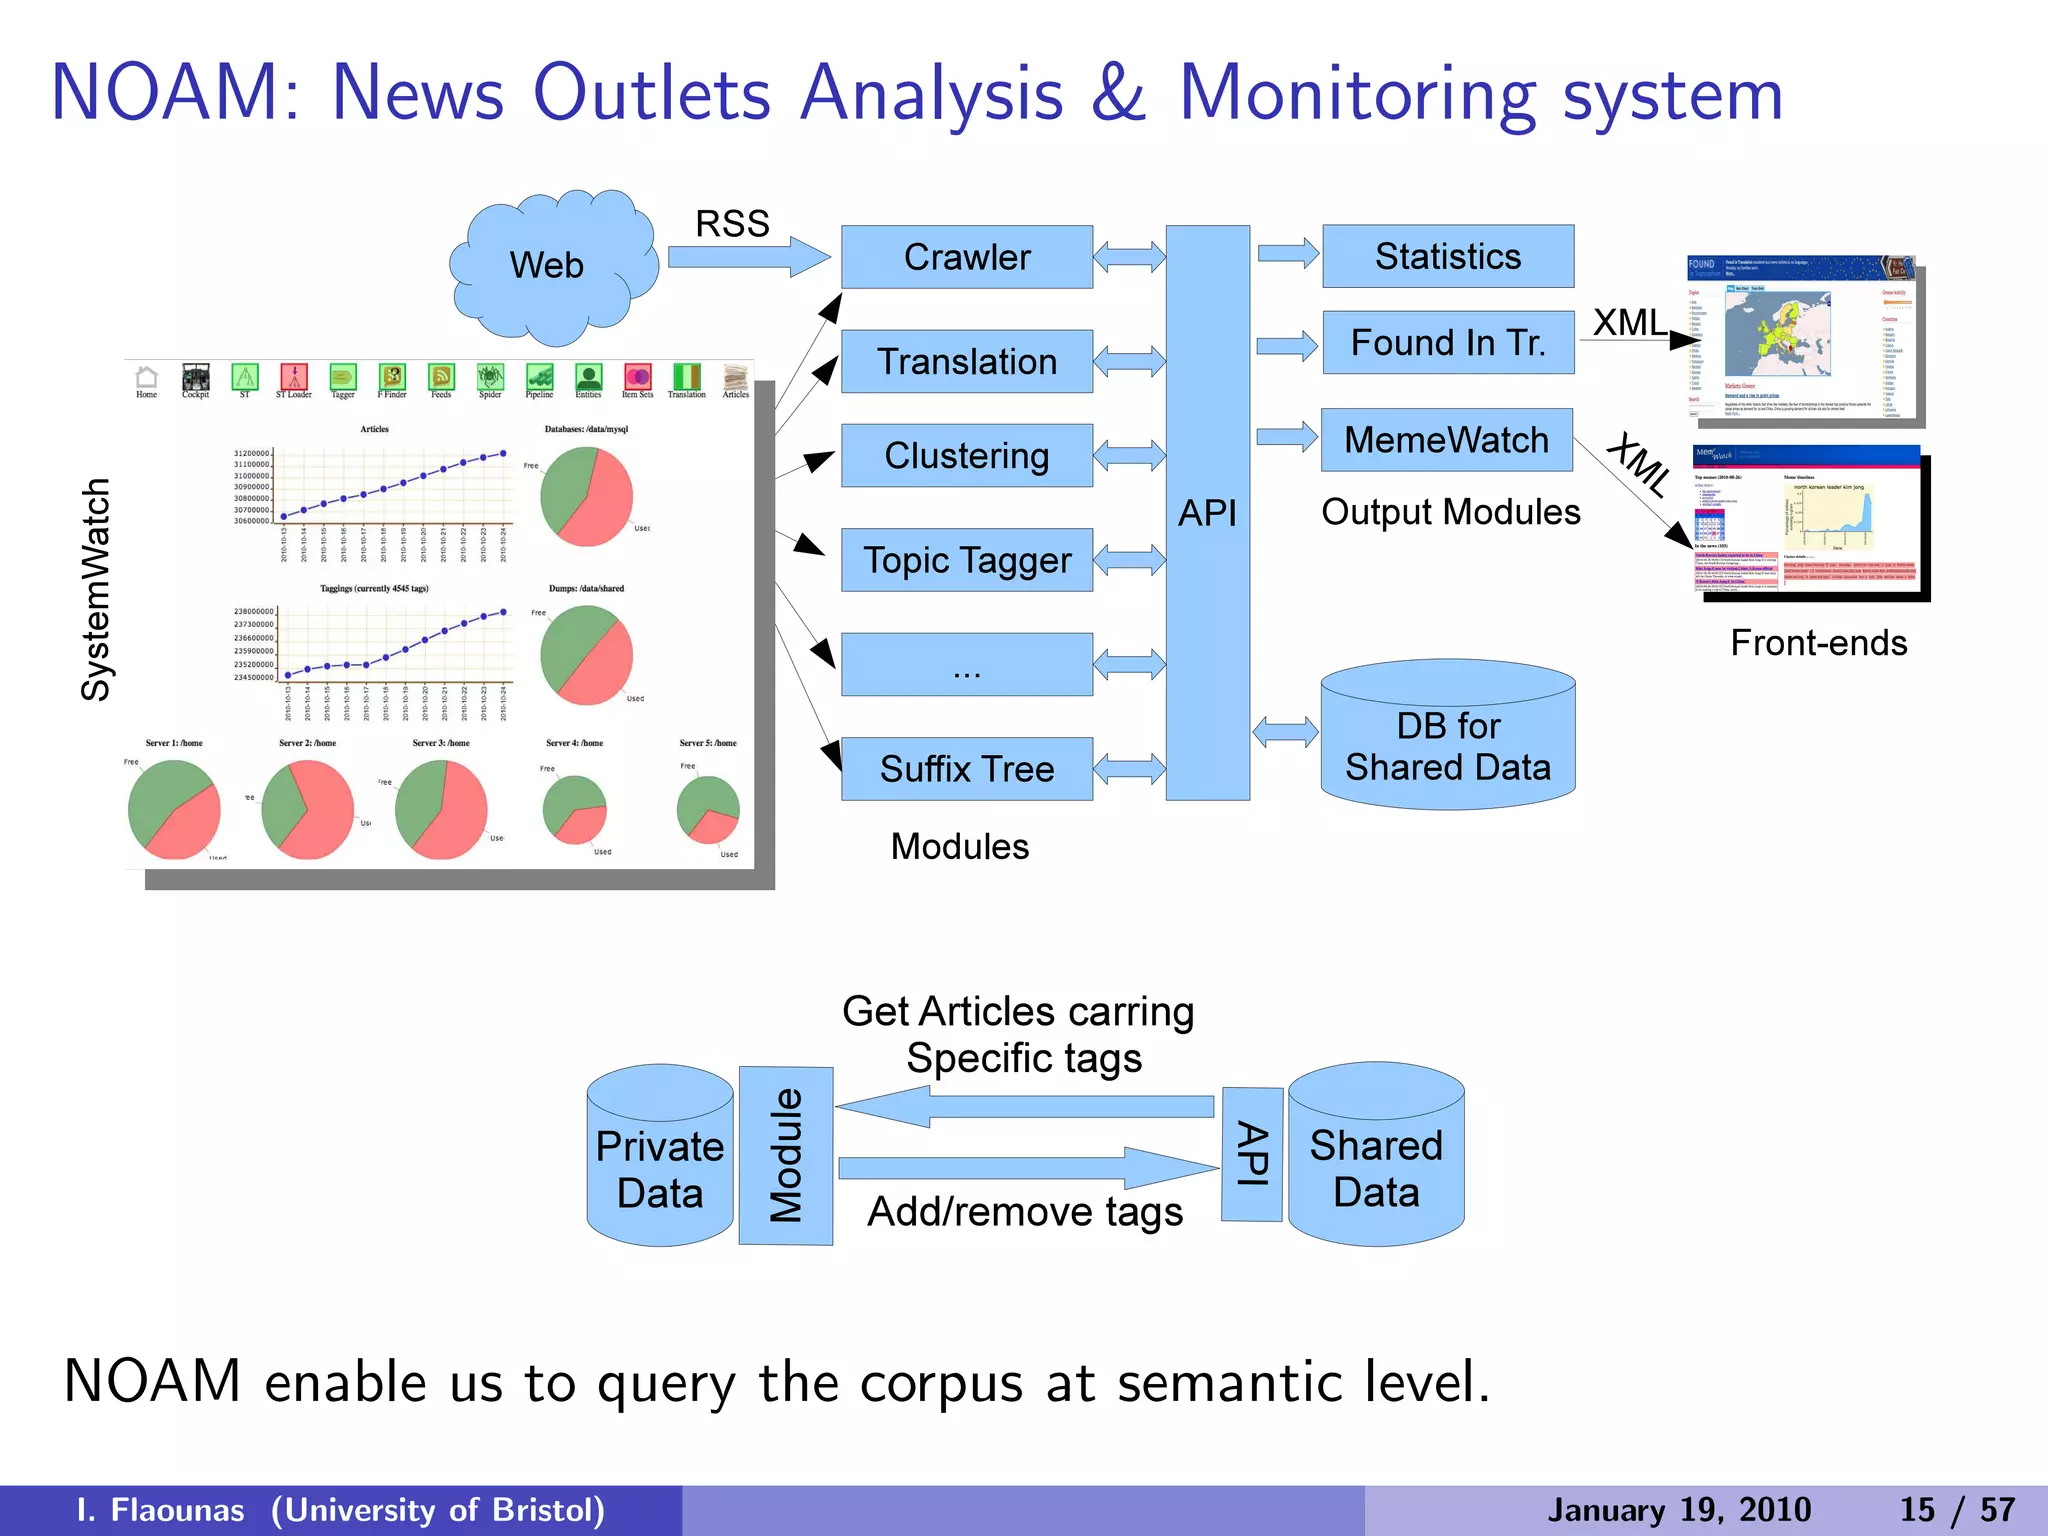
The document discusses detecting patterns in news media content through automated analysis. It describes building a corpus of over 30 million news items from more than 1,300 global media sources and applying techniques like machine learning, natural language processing and statistical machine translation to analyze the data at scale. The goal is to answer previously intractable questions about the global mediasphere and media systems.


![[0211]hwiyeon](https://cdn.slidesharecdn.com/ss_thumbnails/0211hwiyeon-200316024310-thumbnail.jpg?width=640&height=640&fit=bounds)