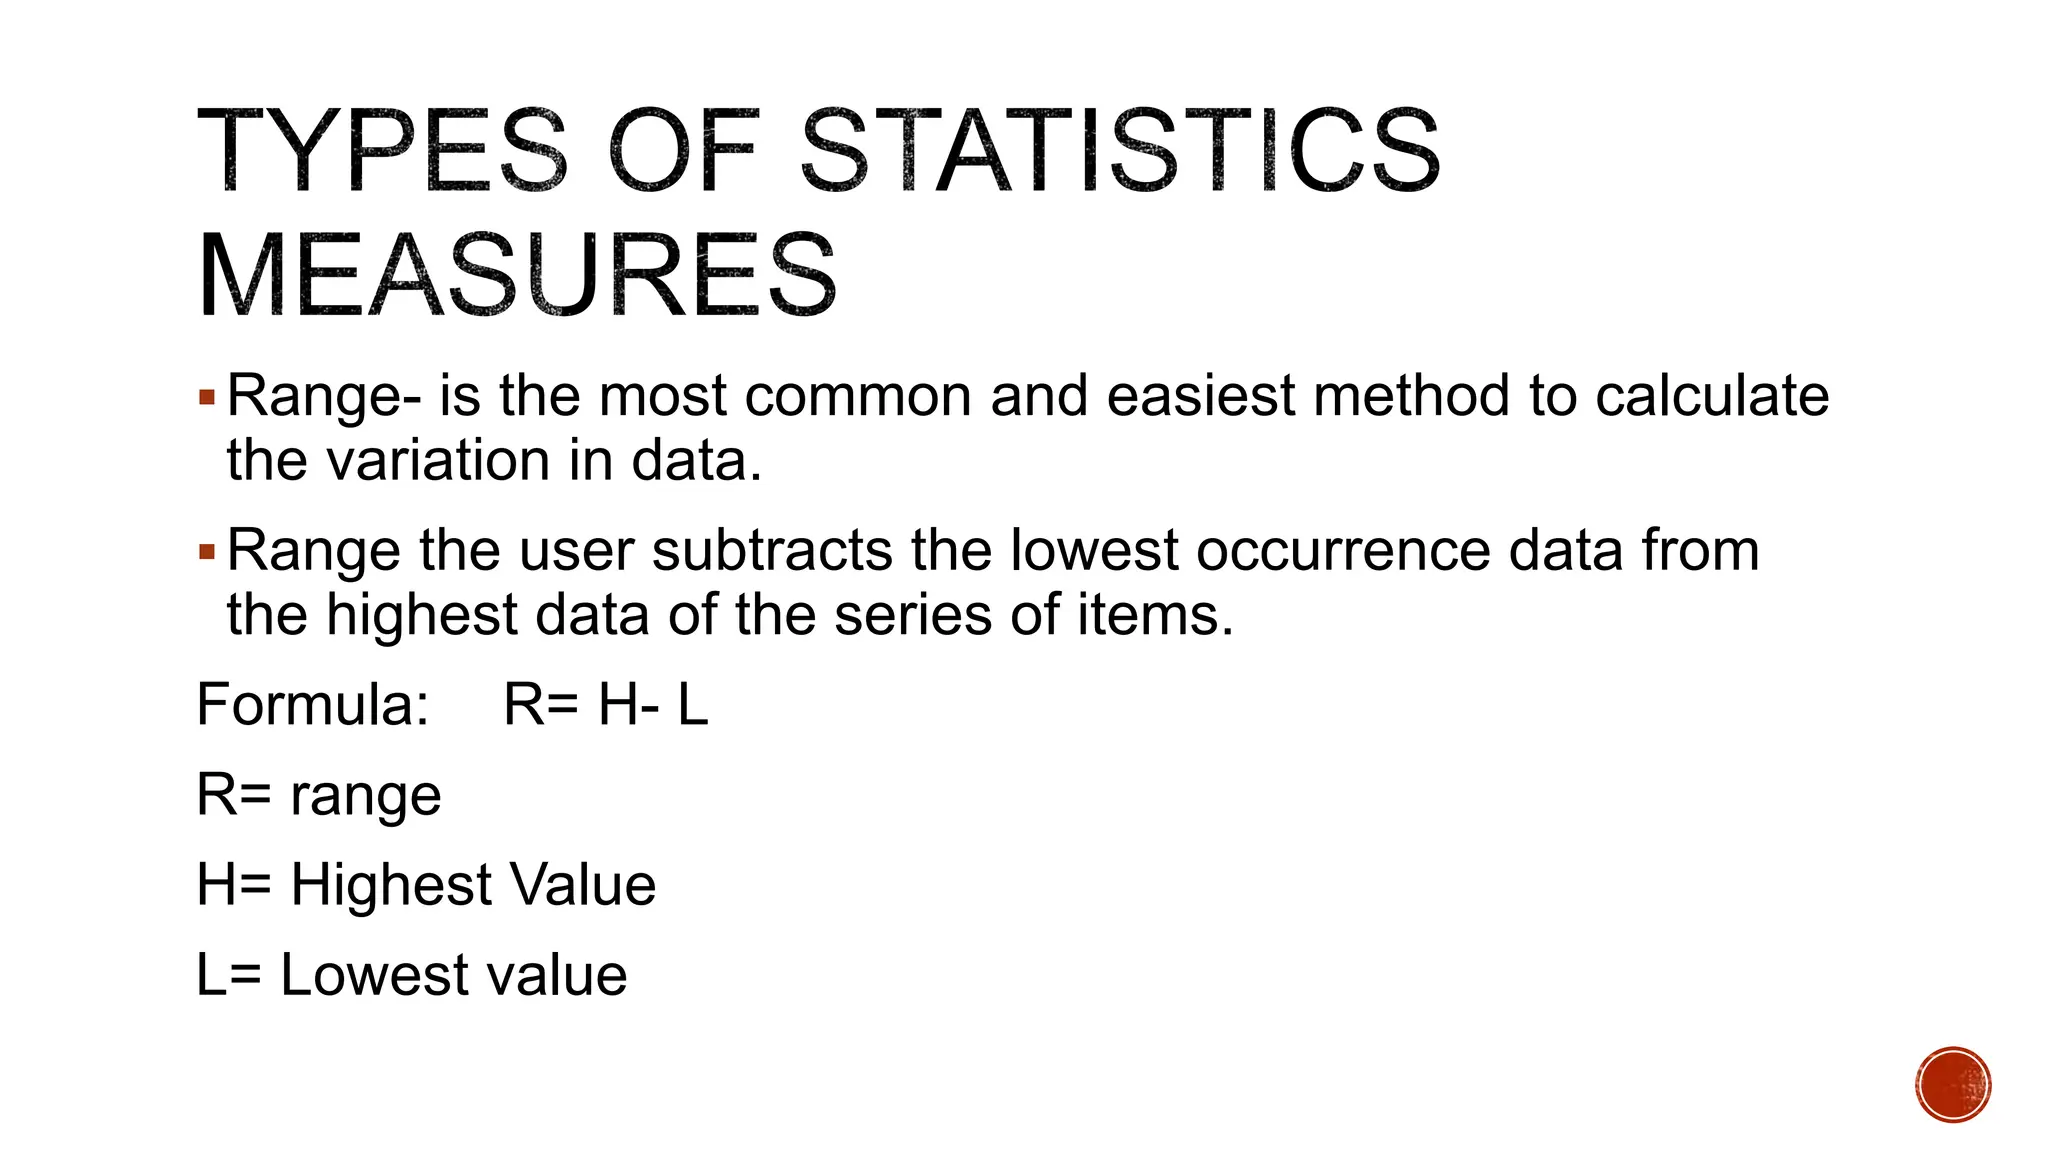
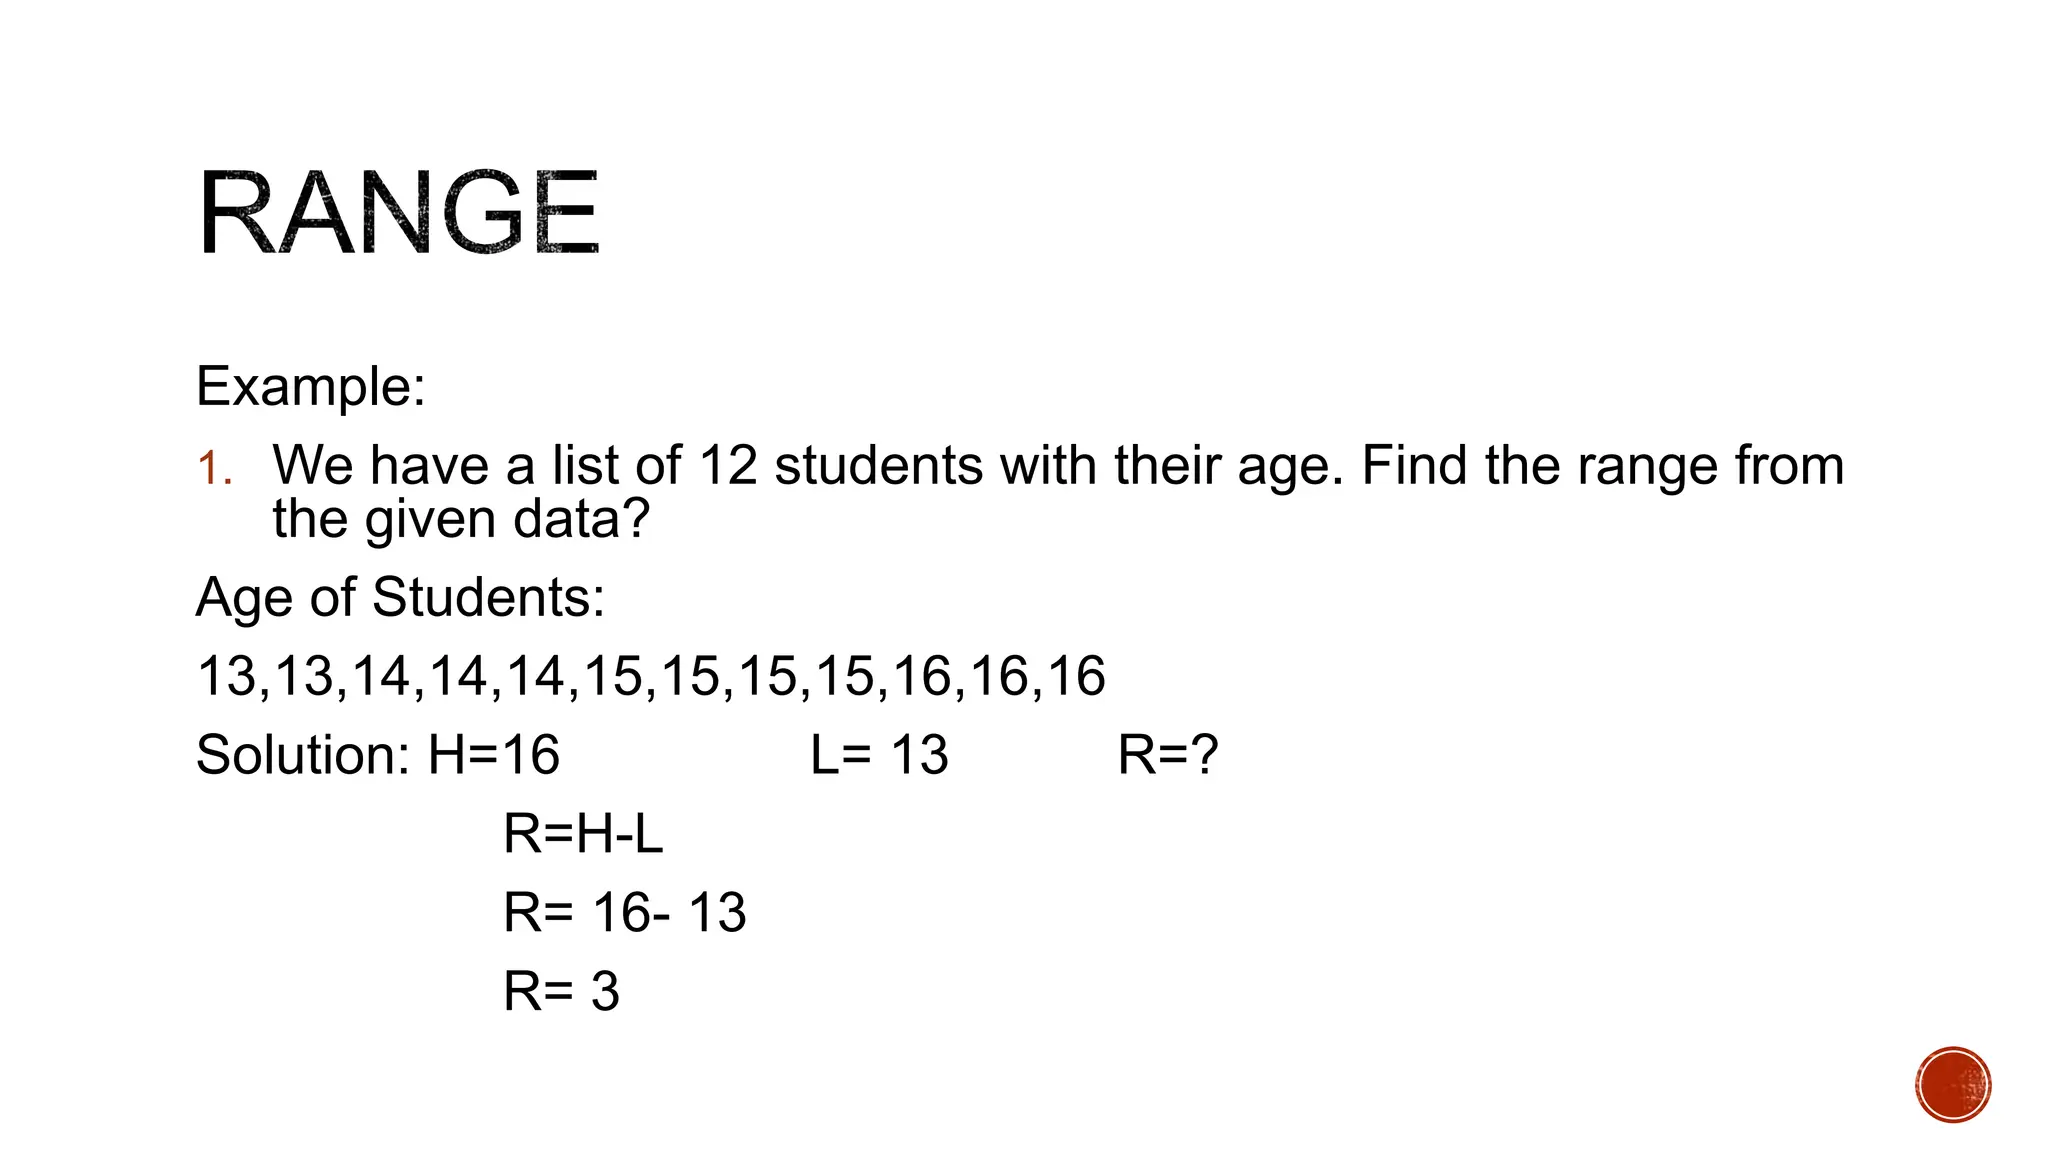
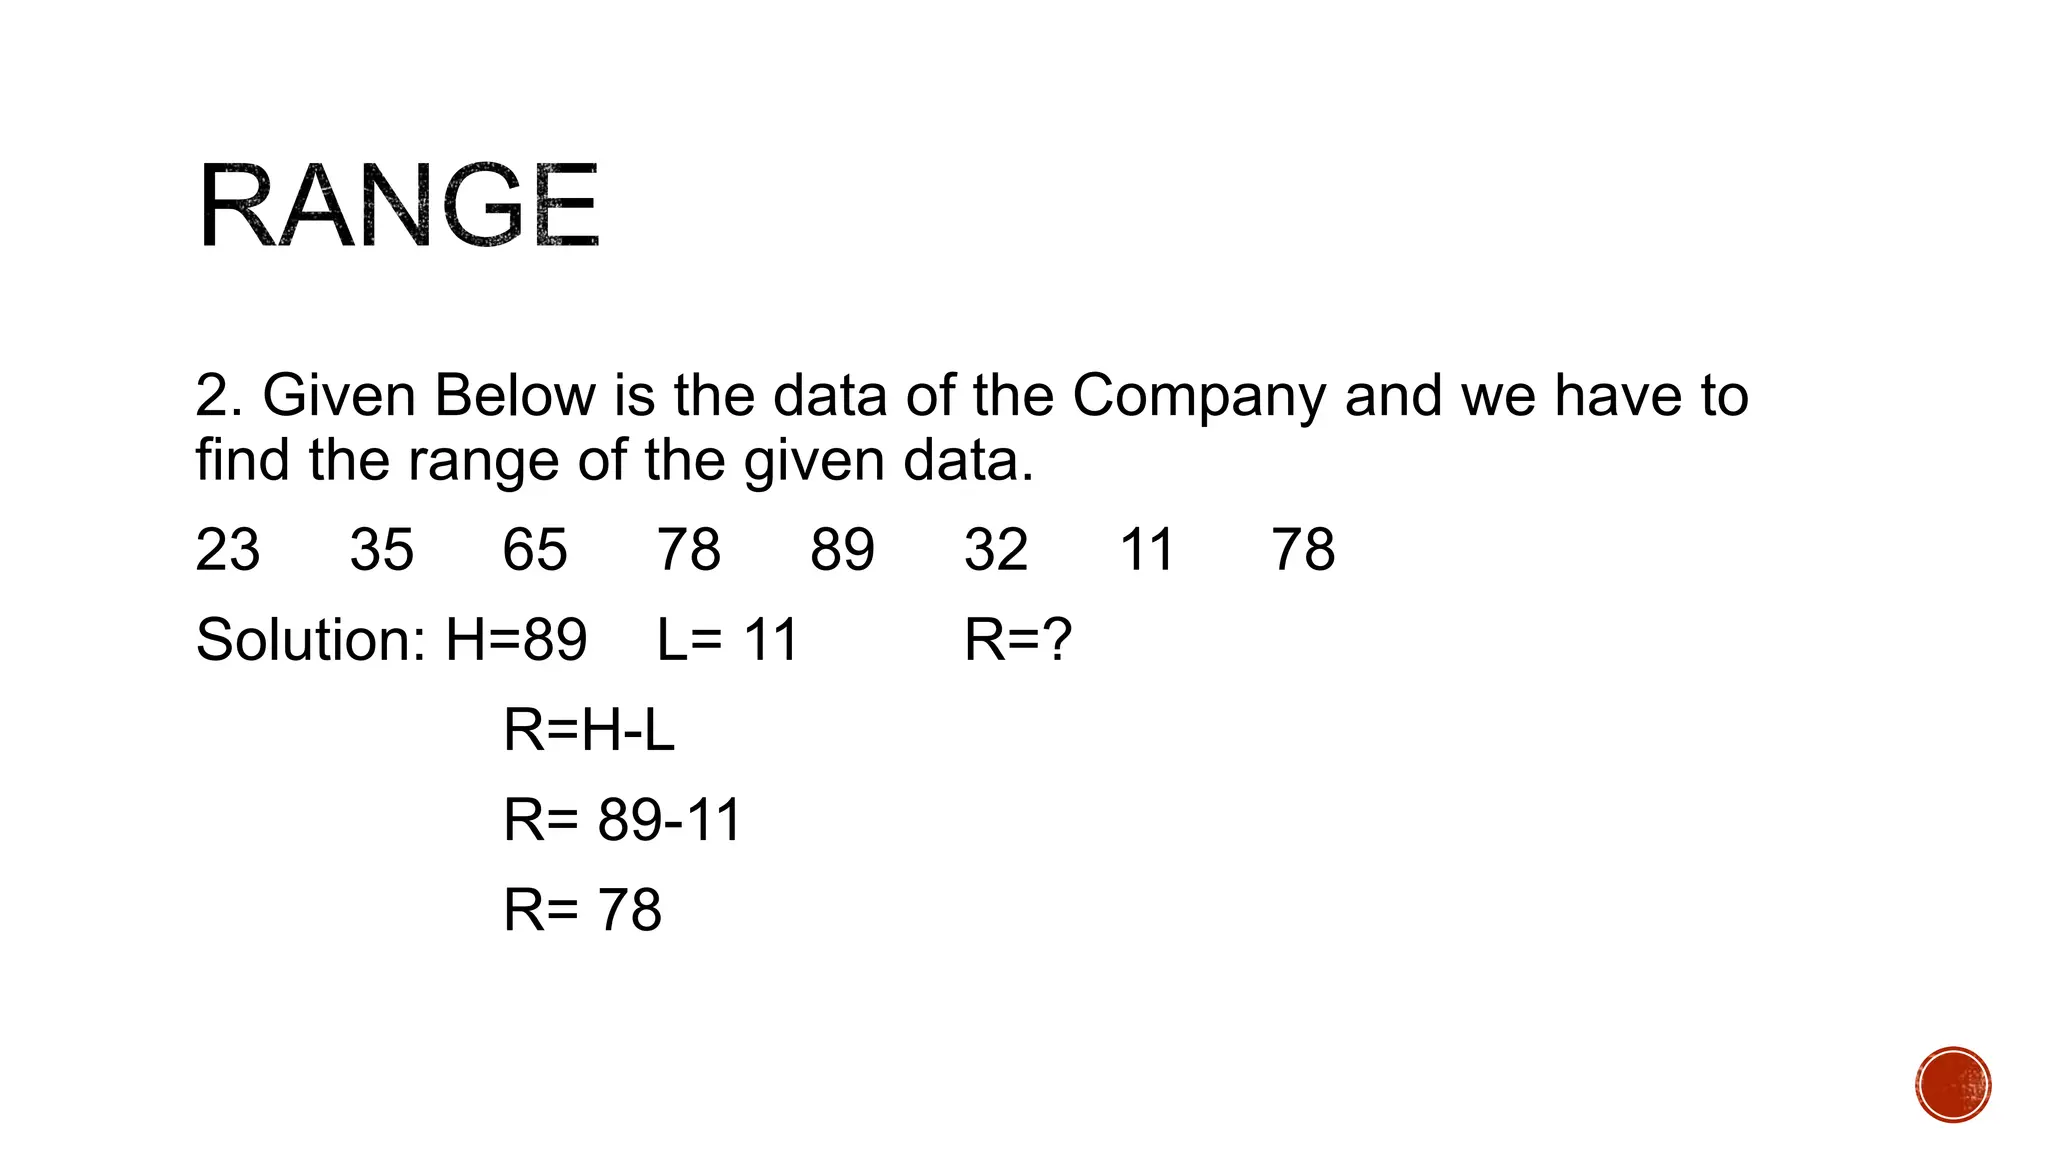
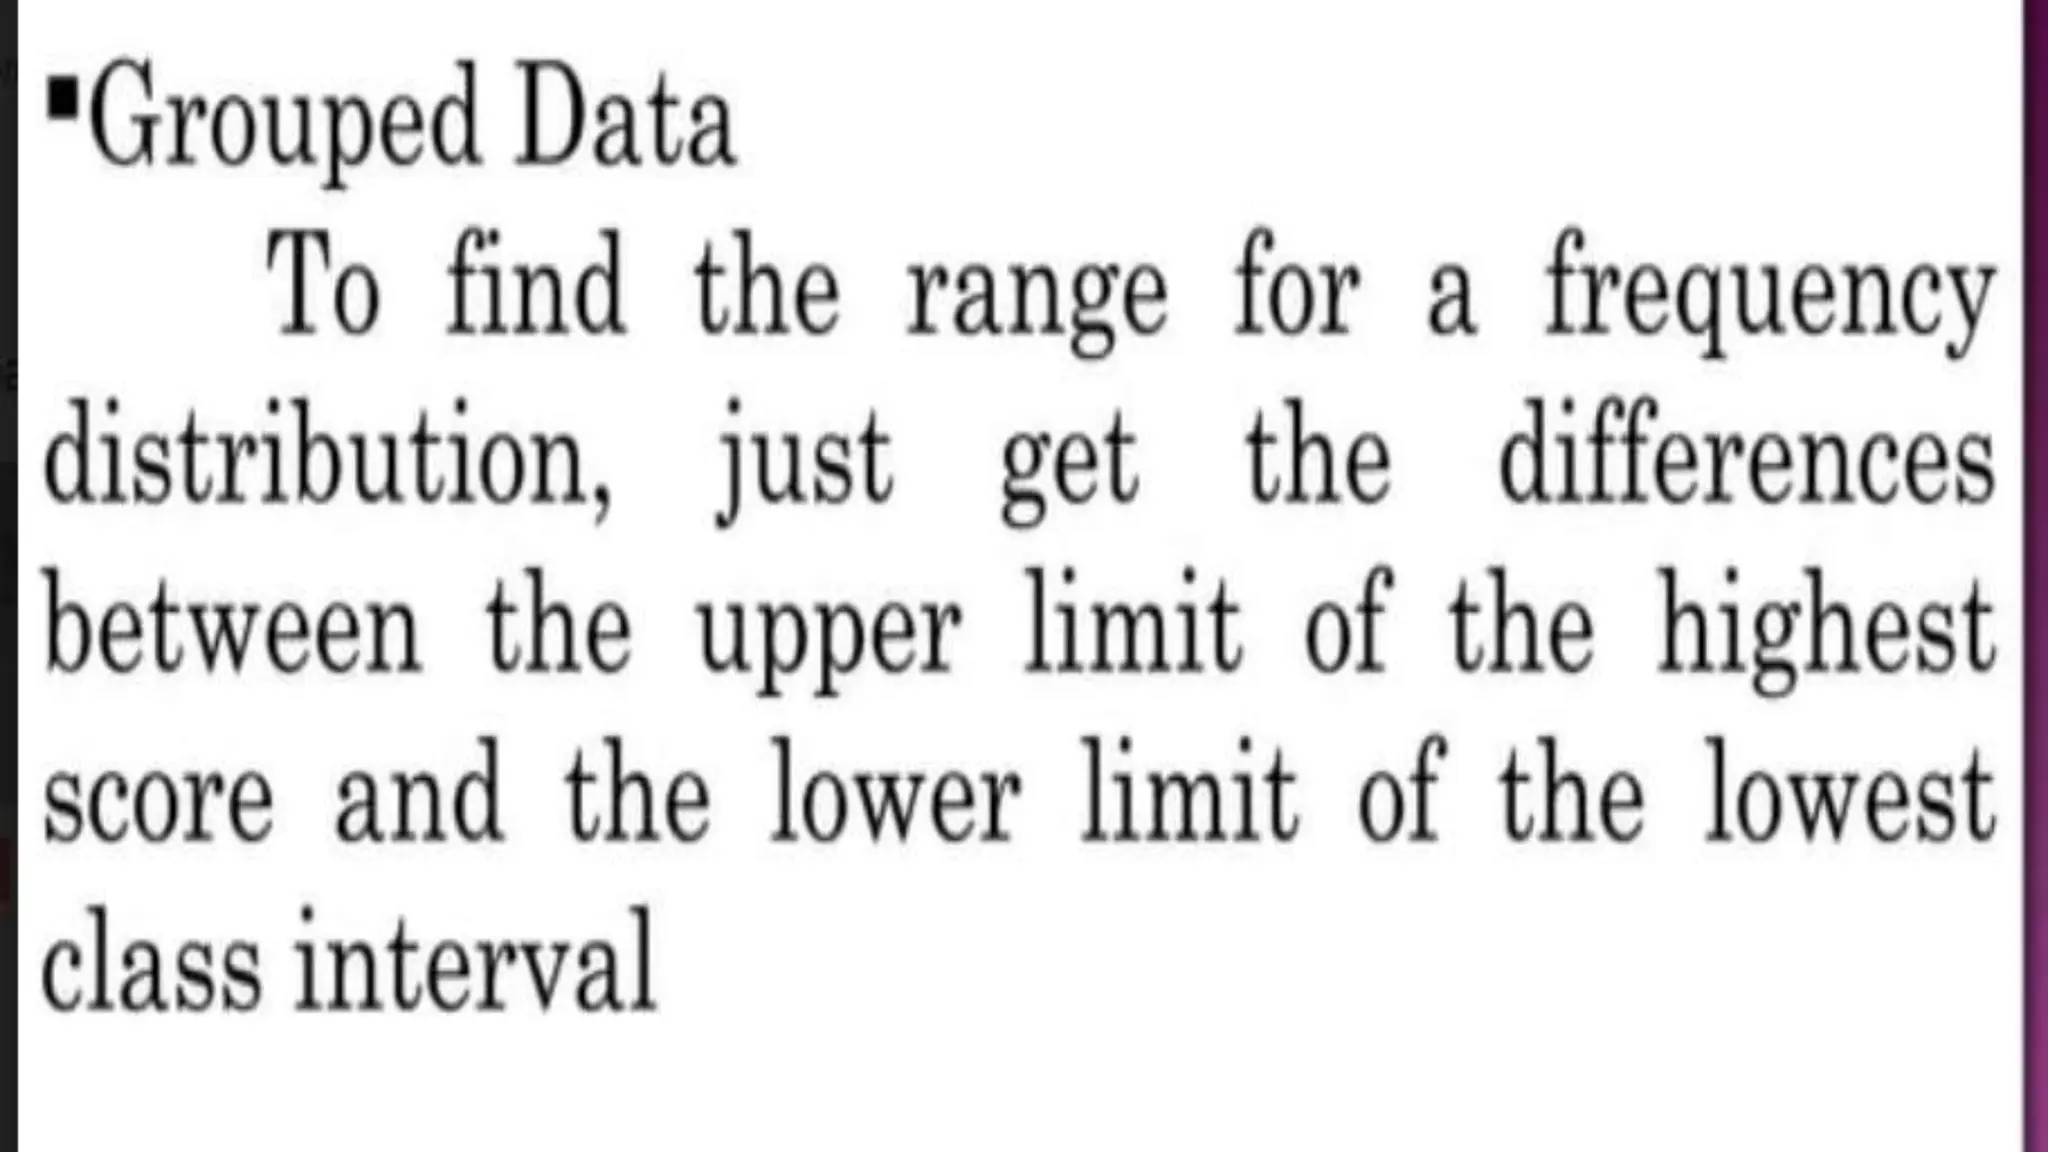
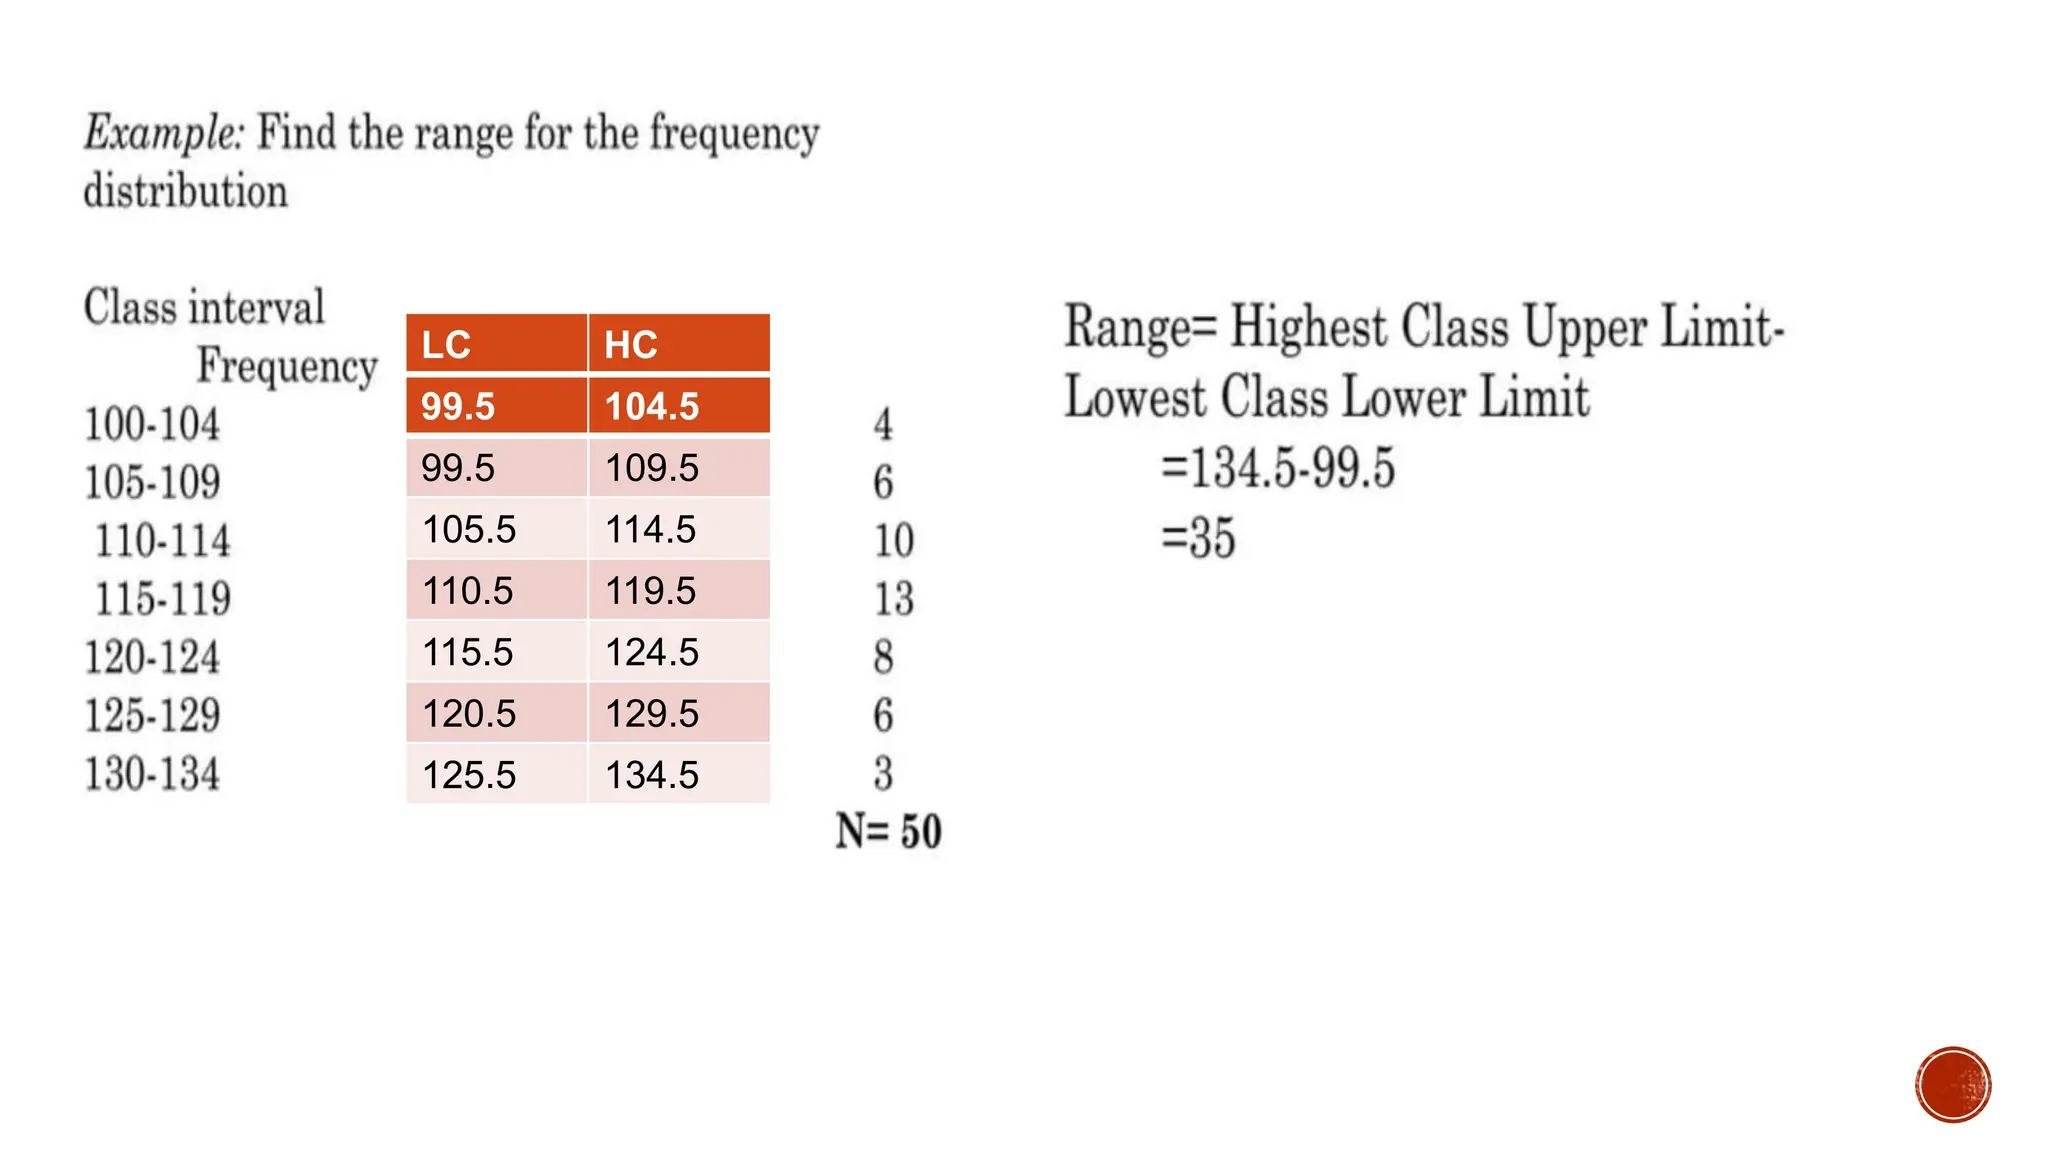
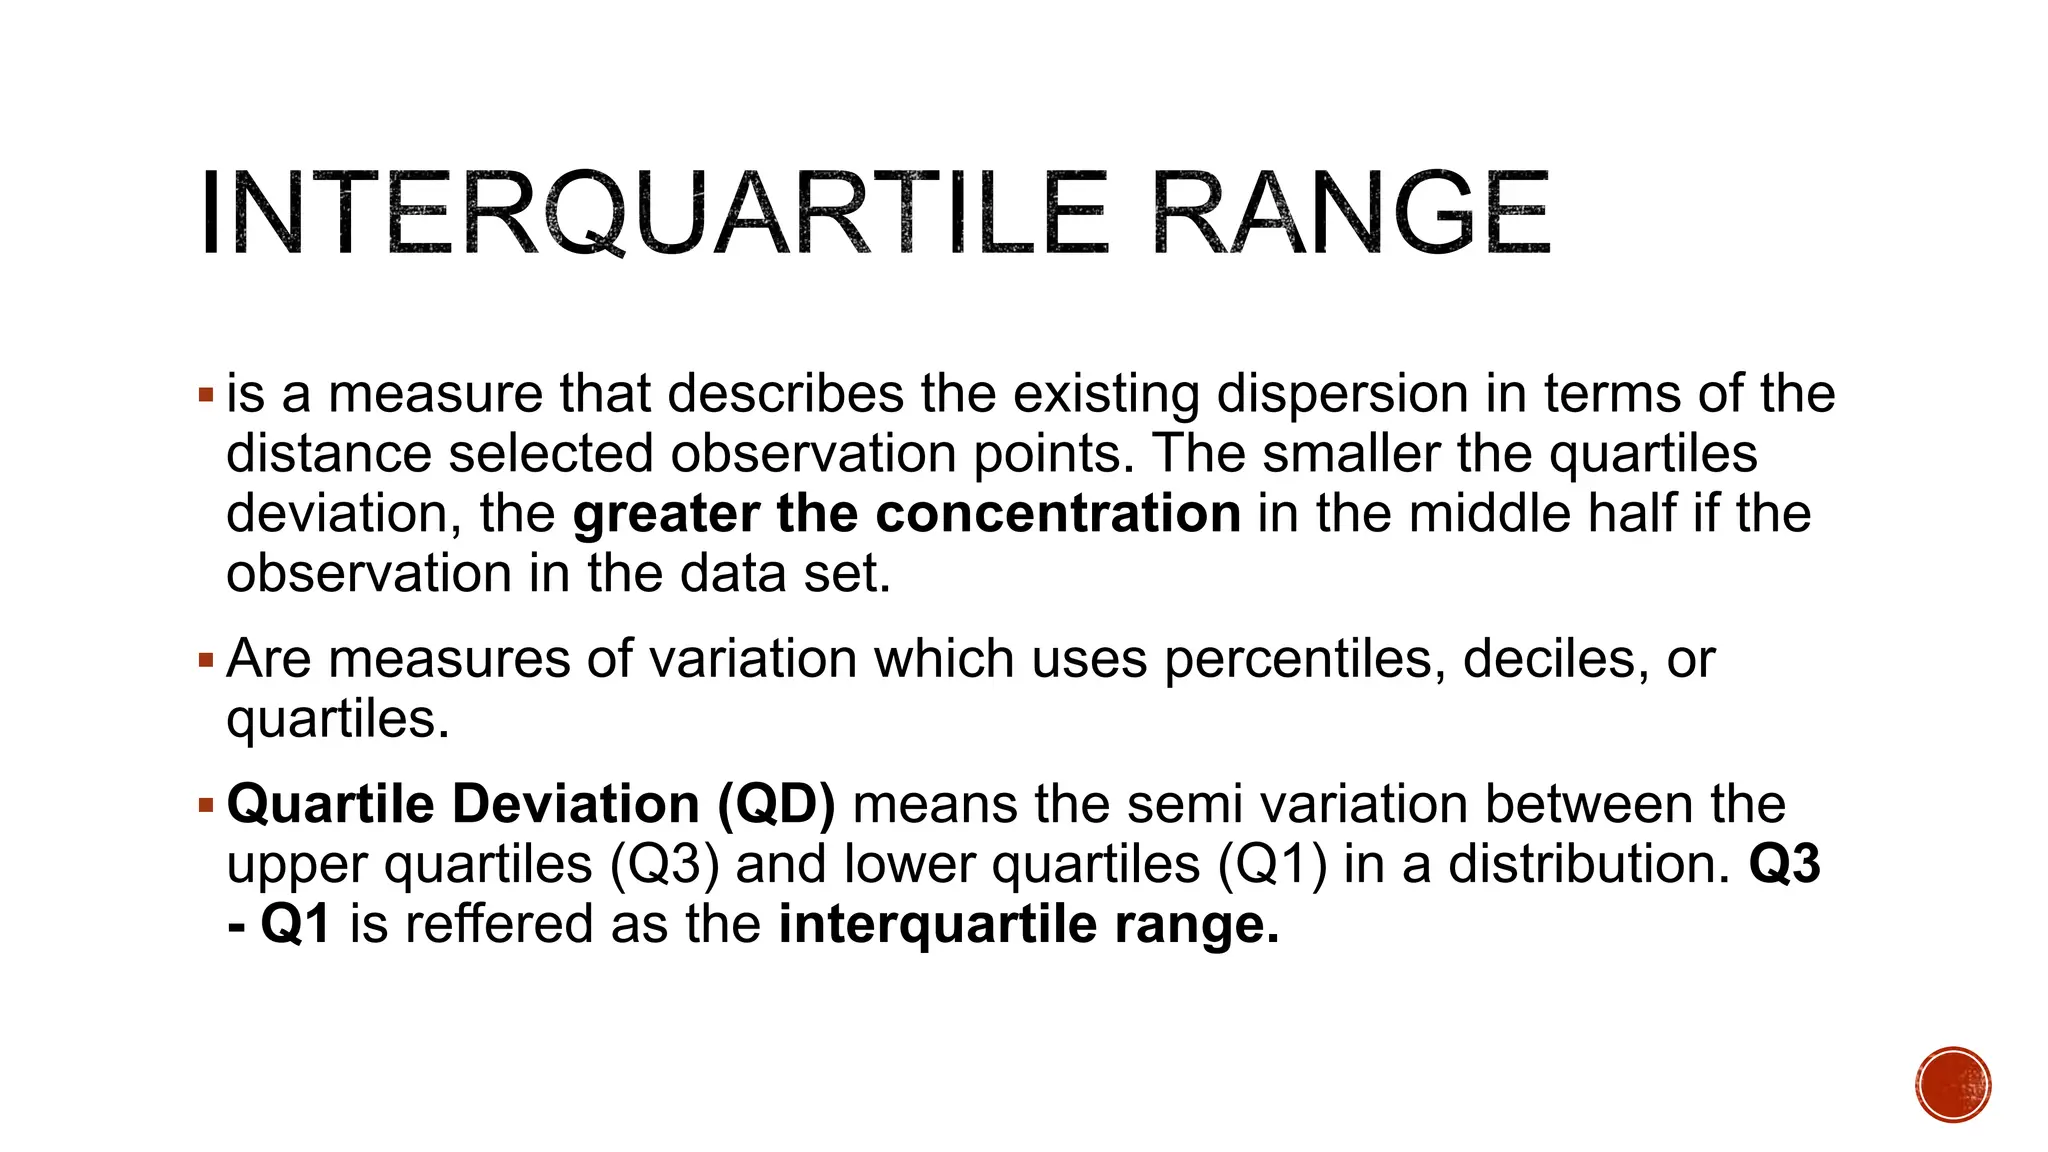
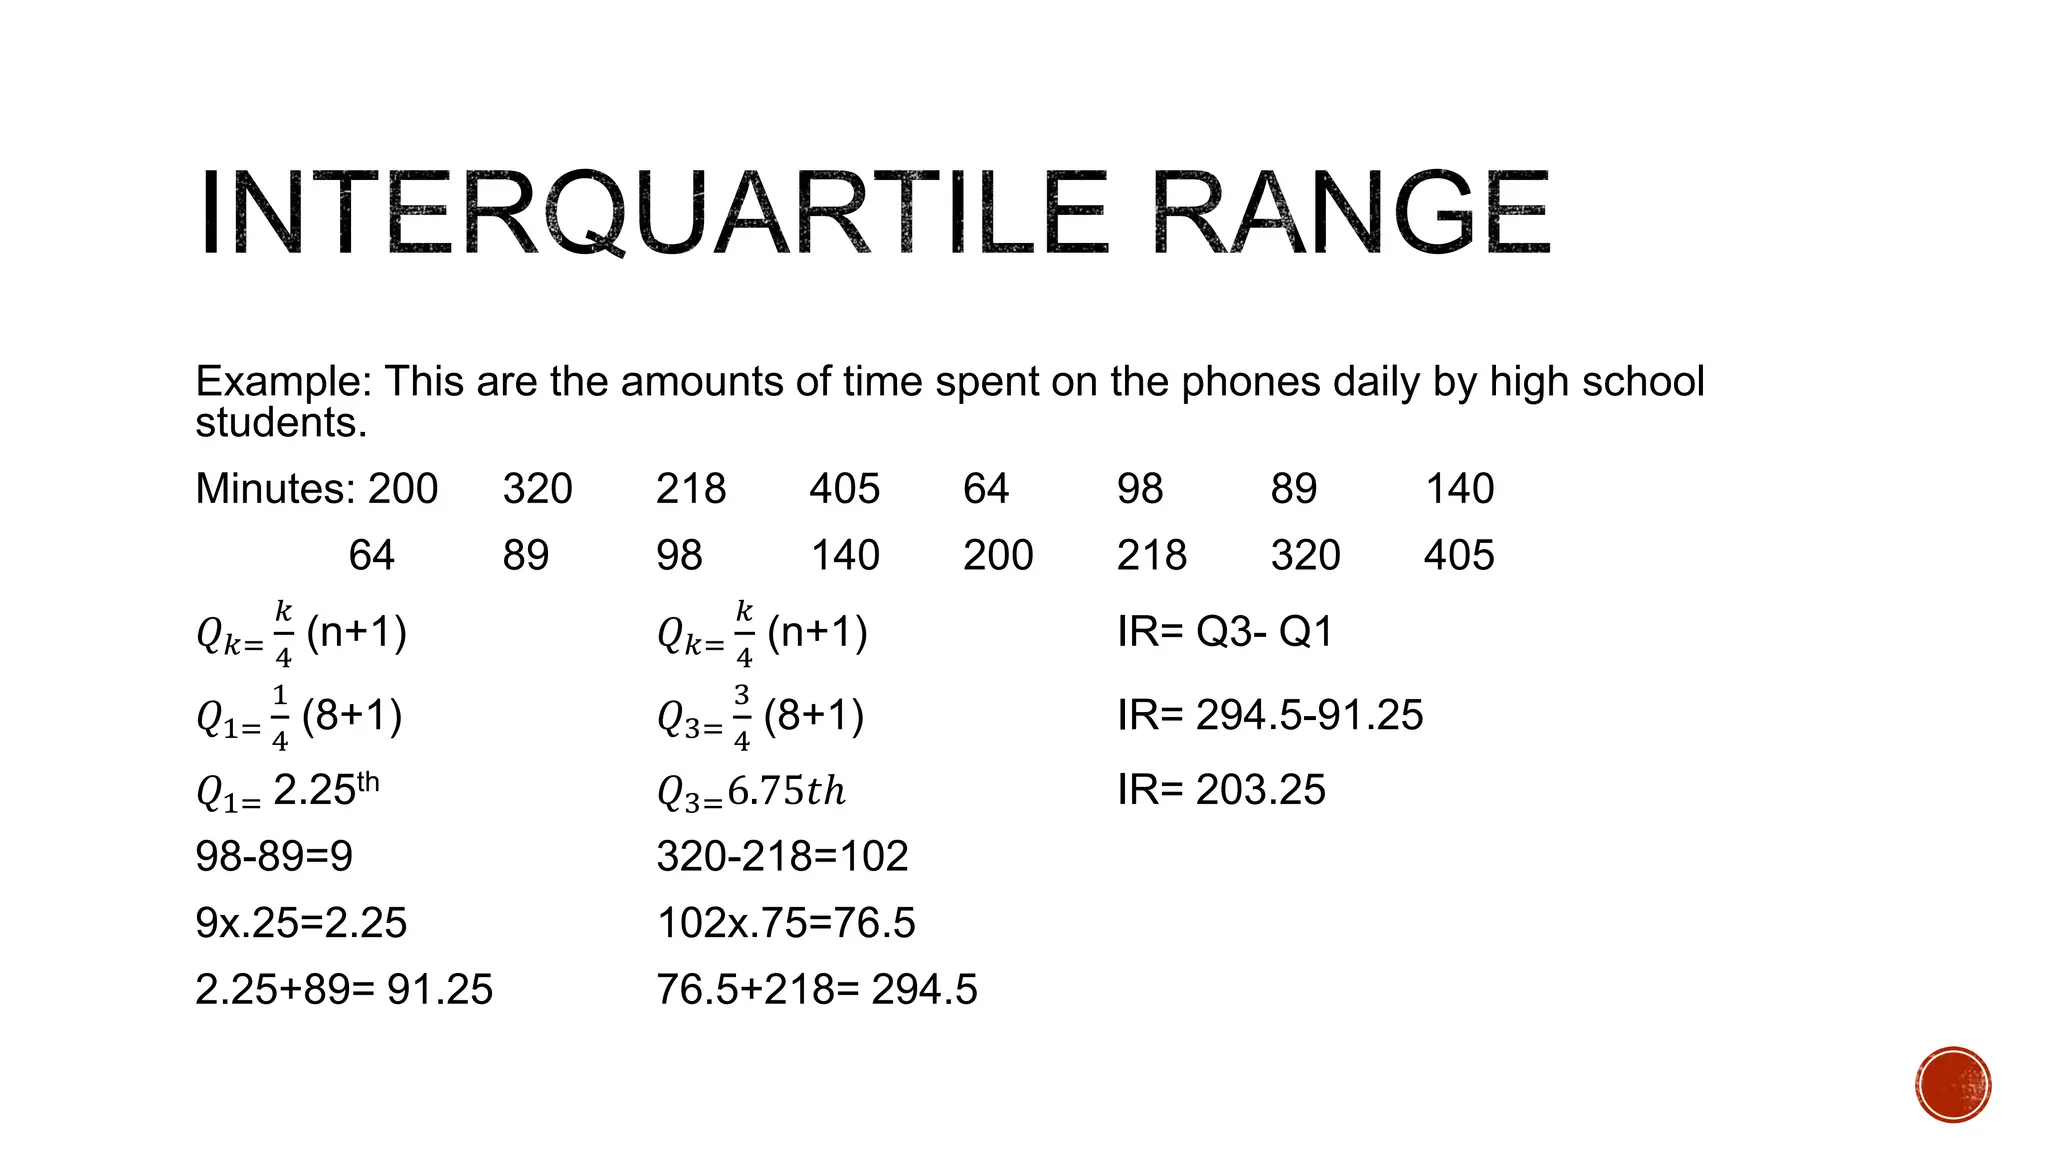
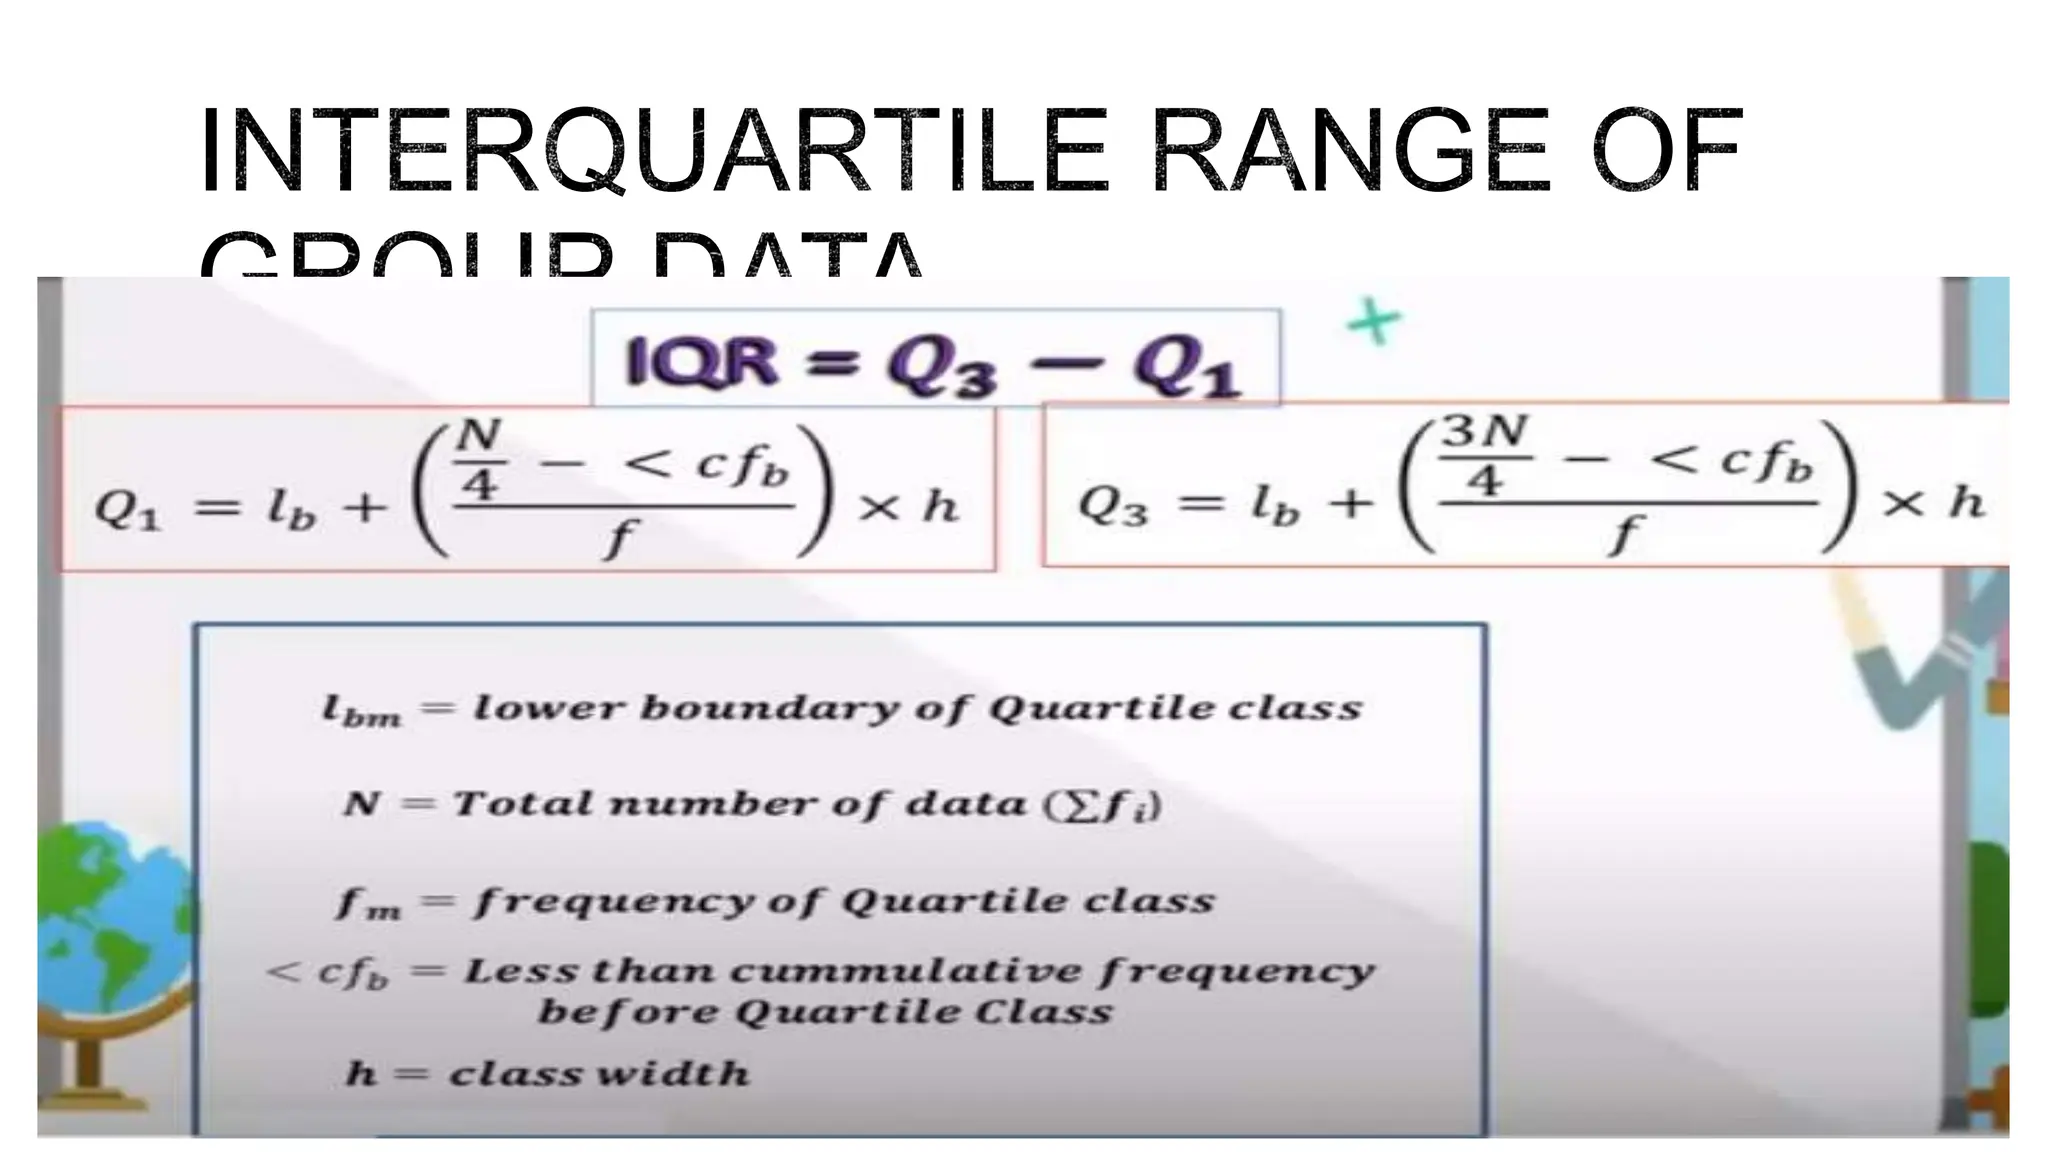
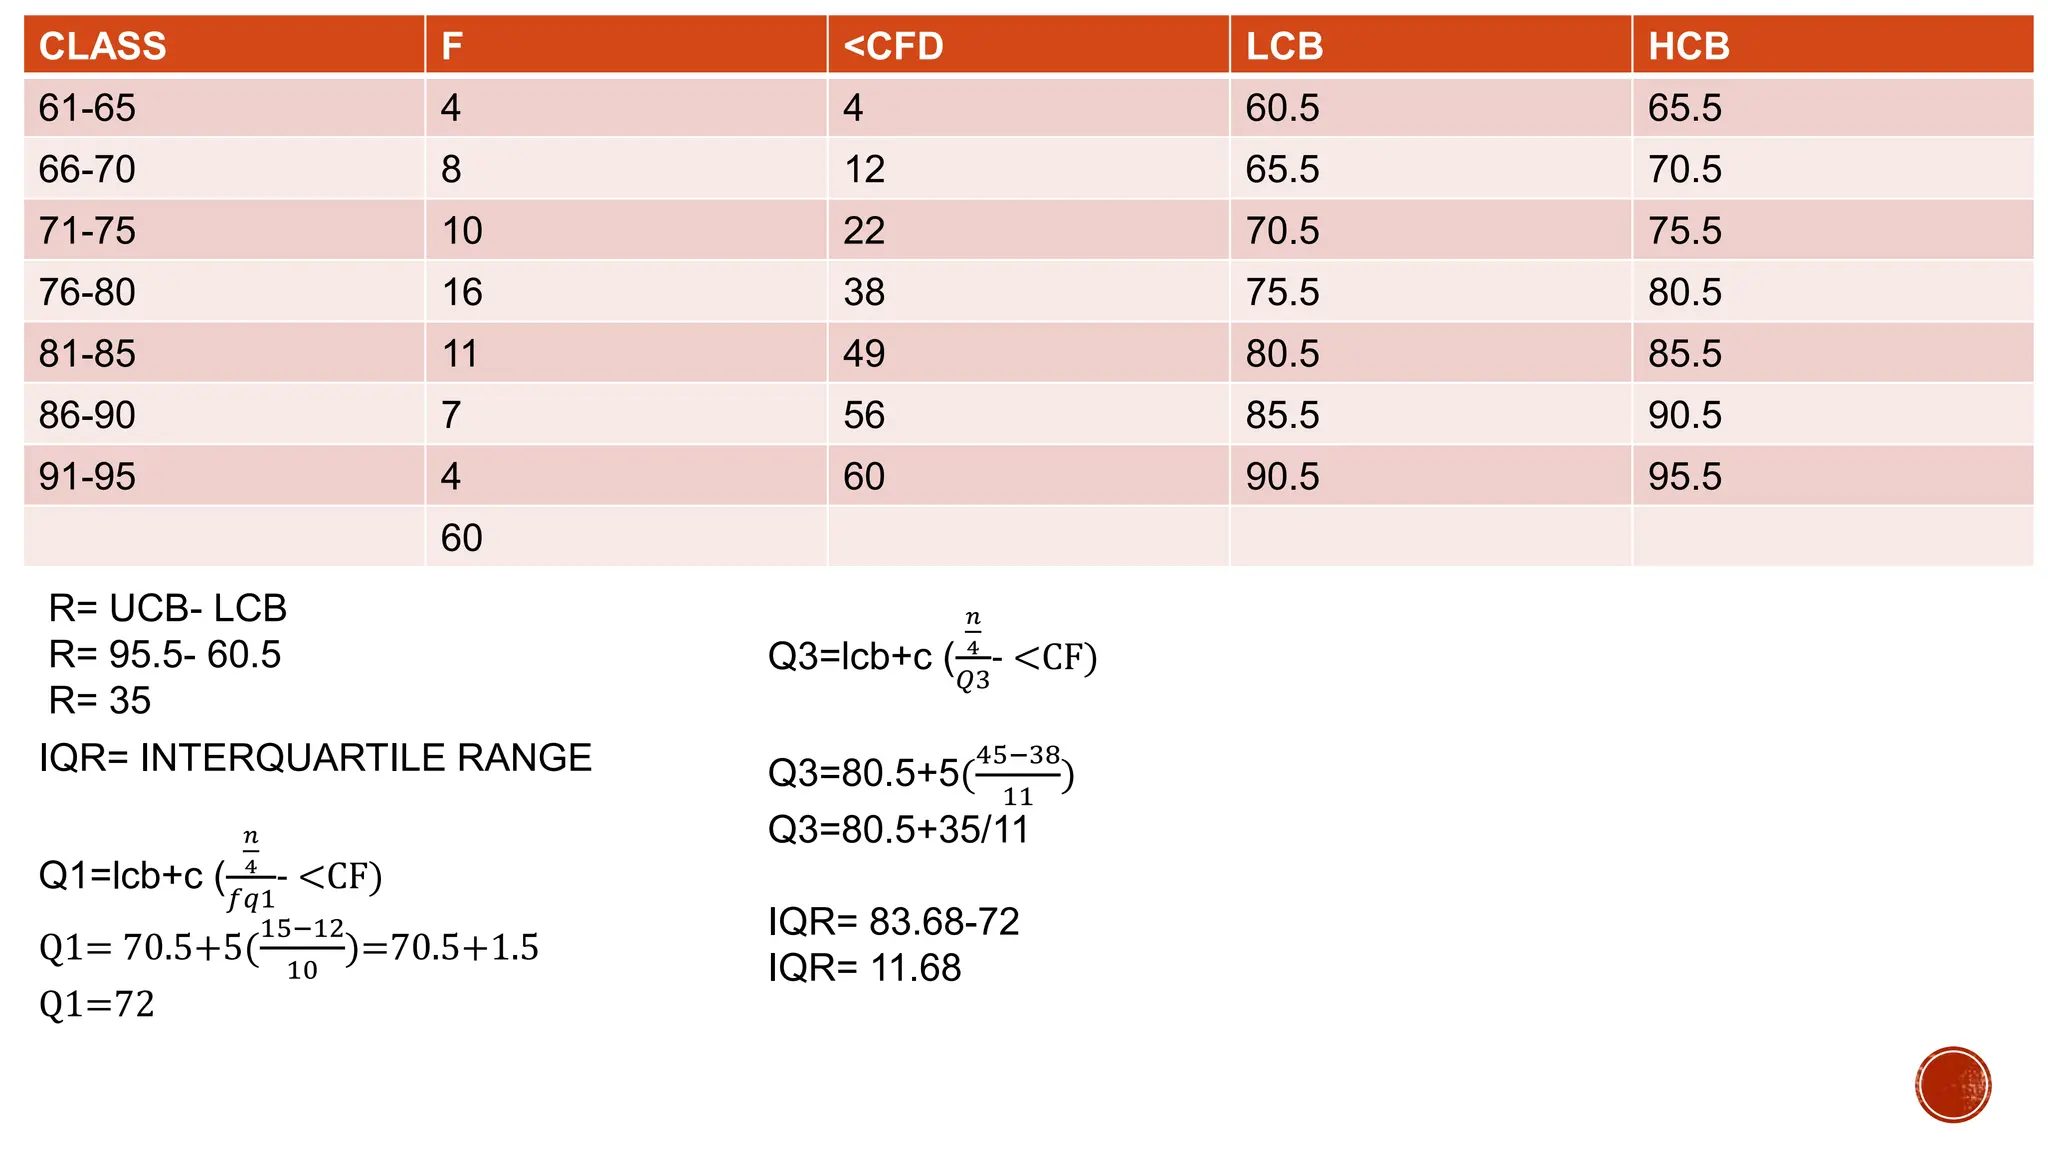
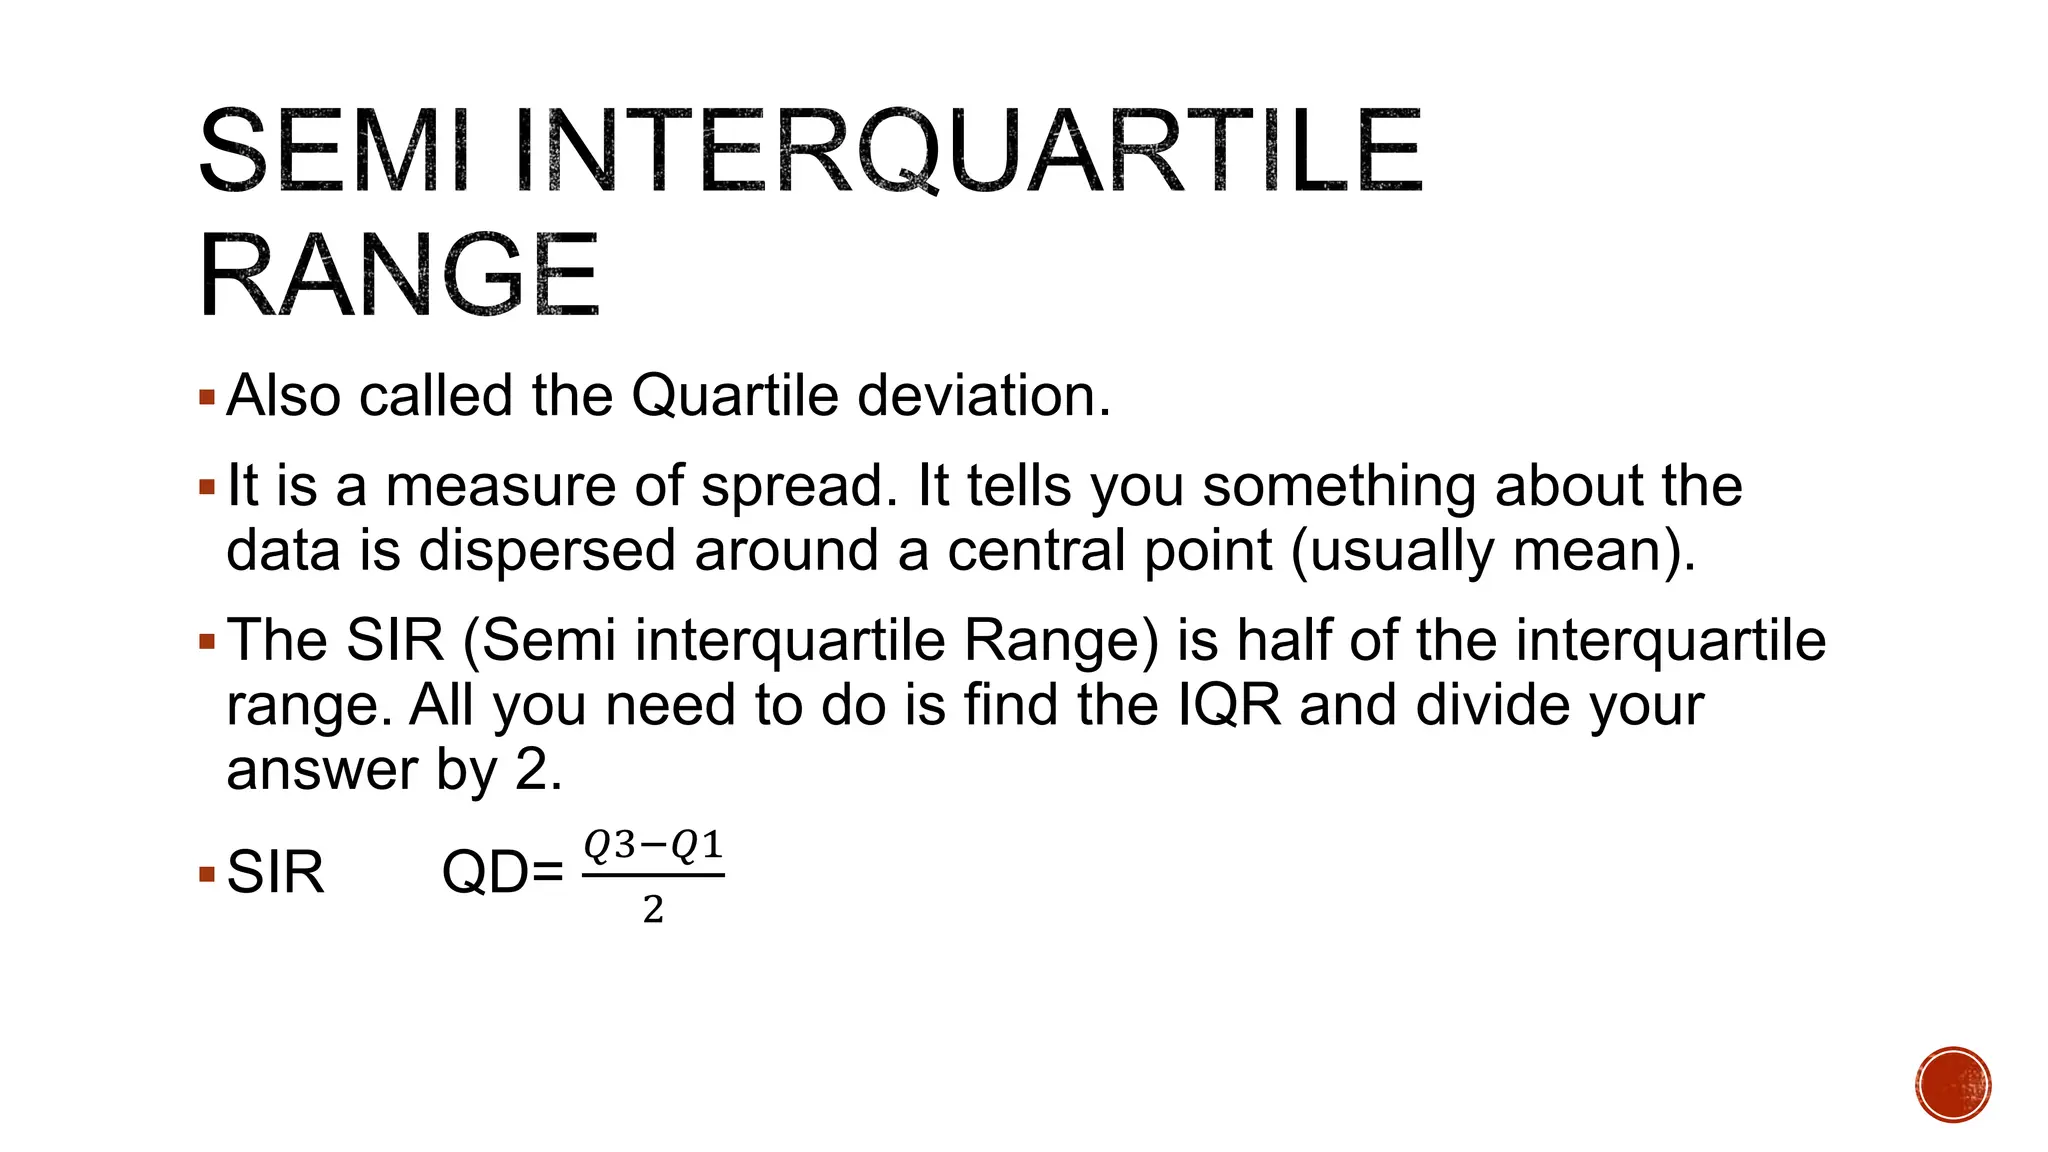
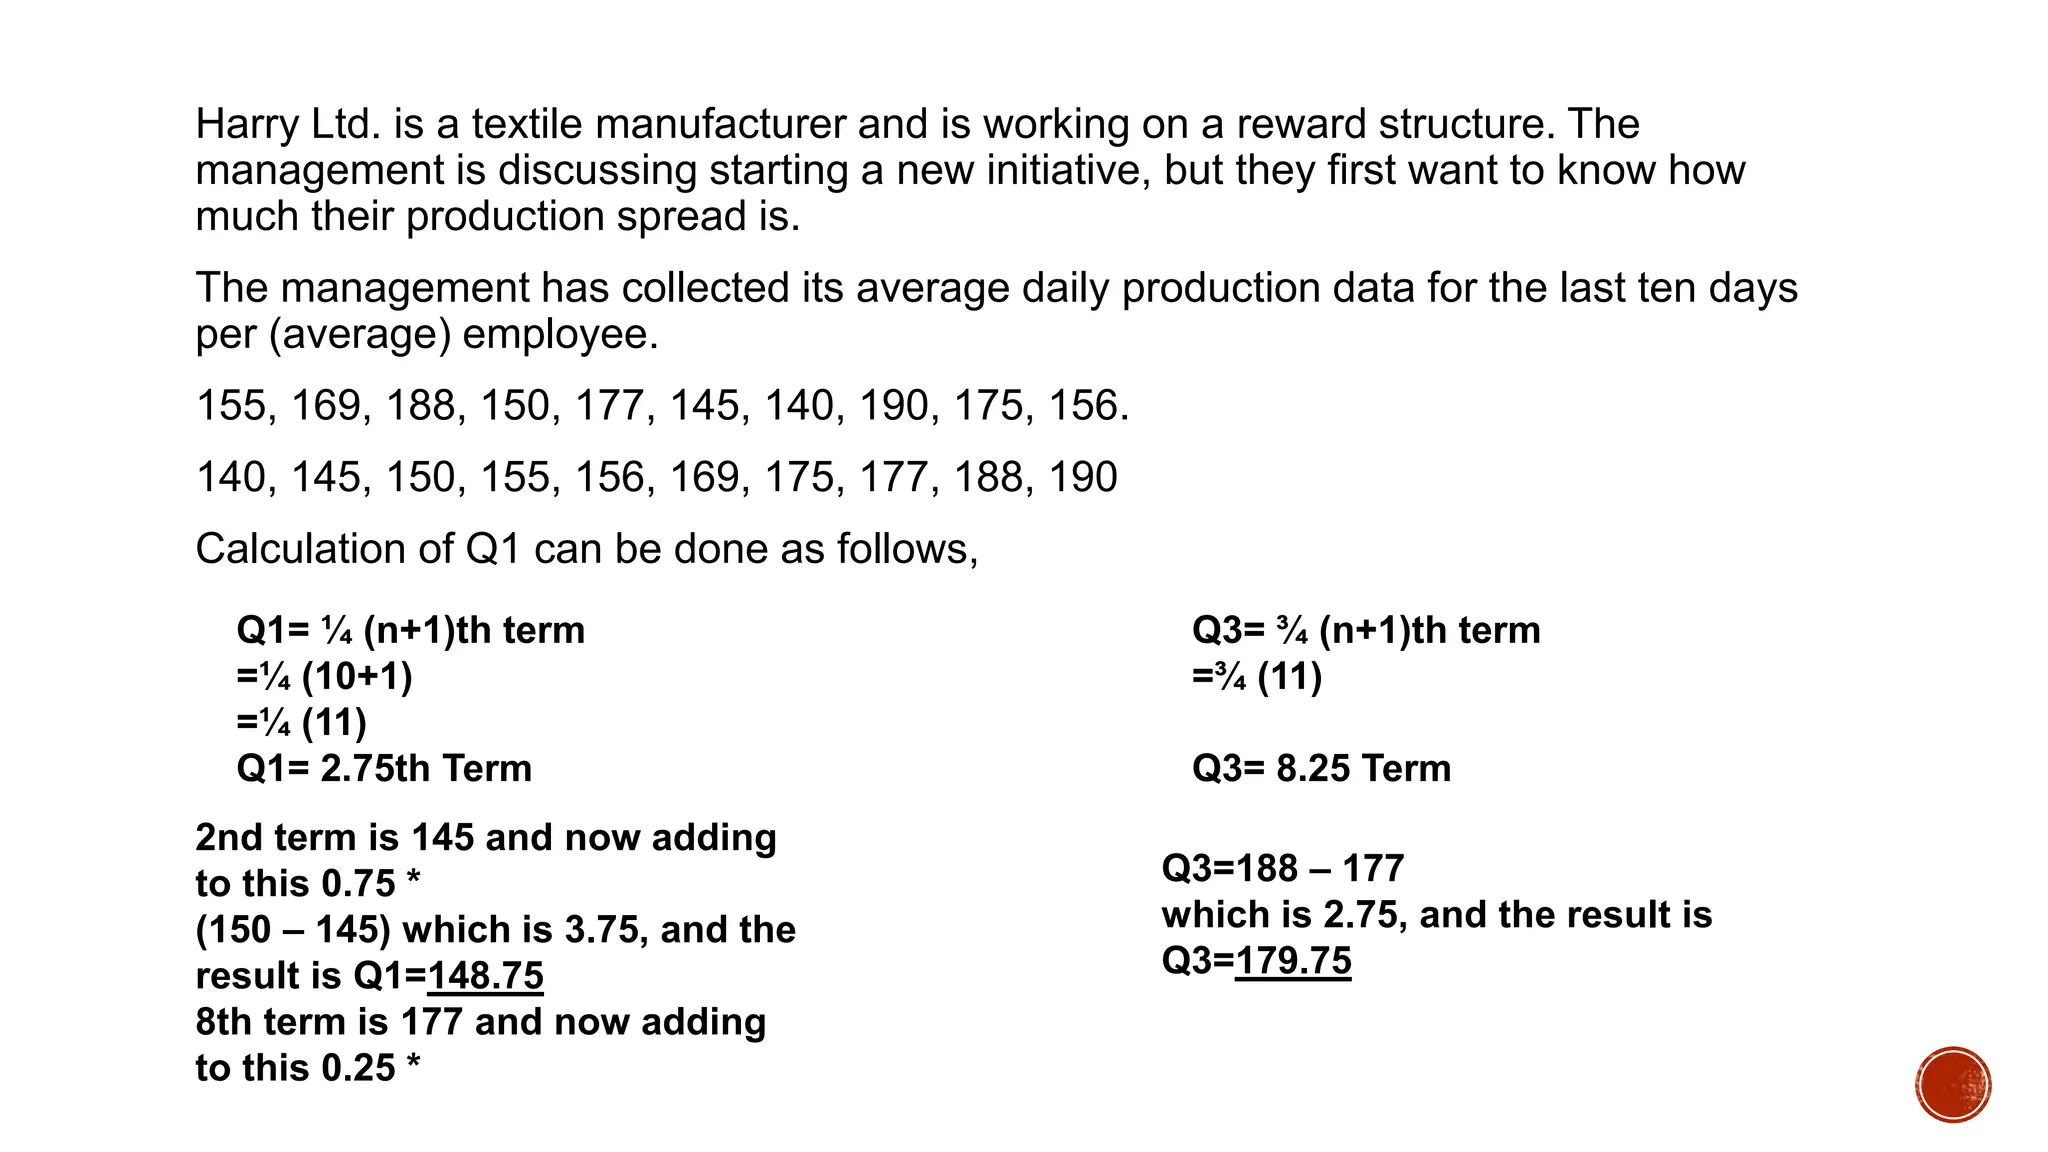
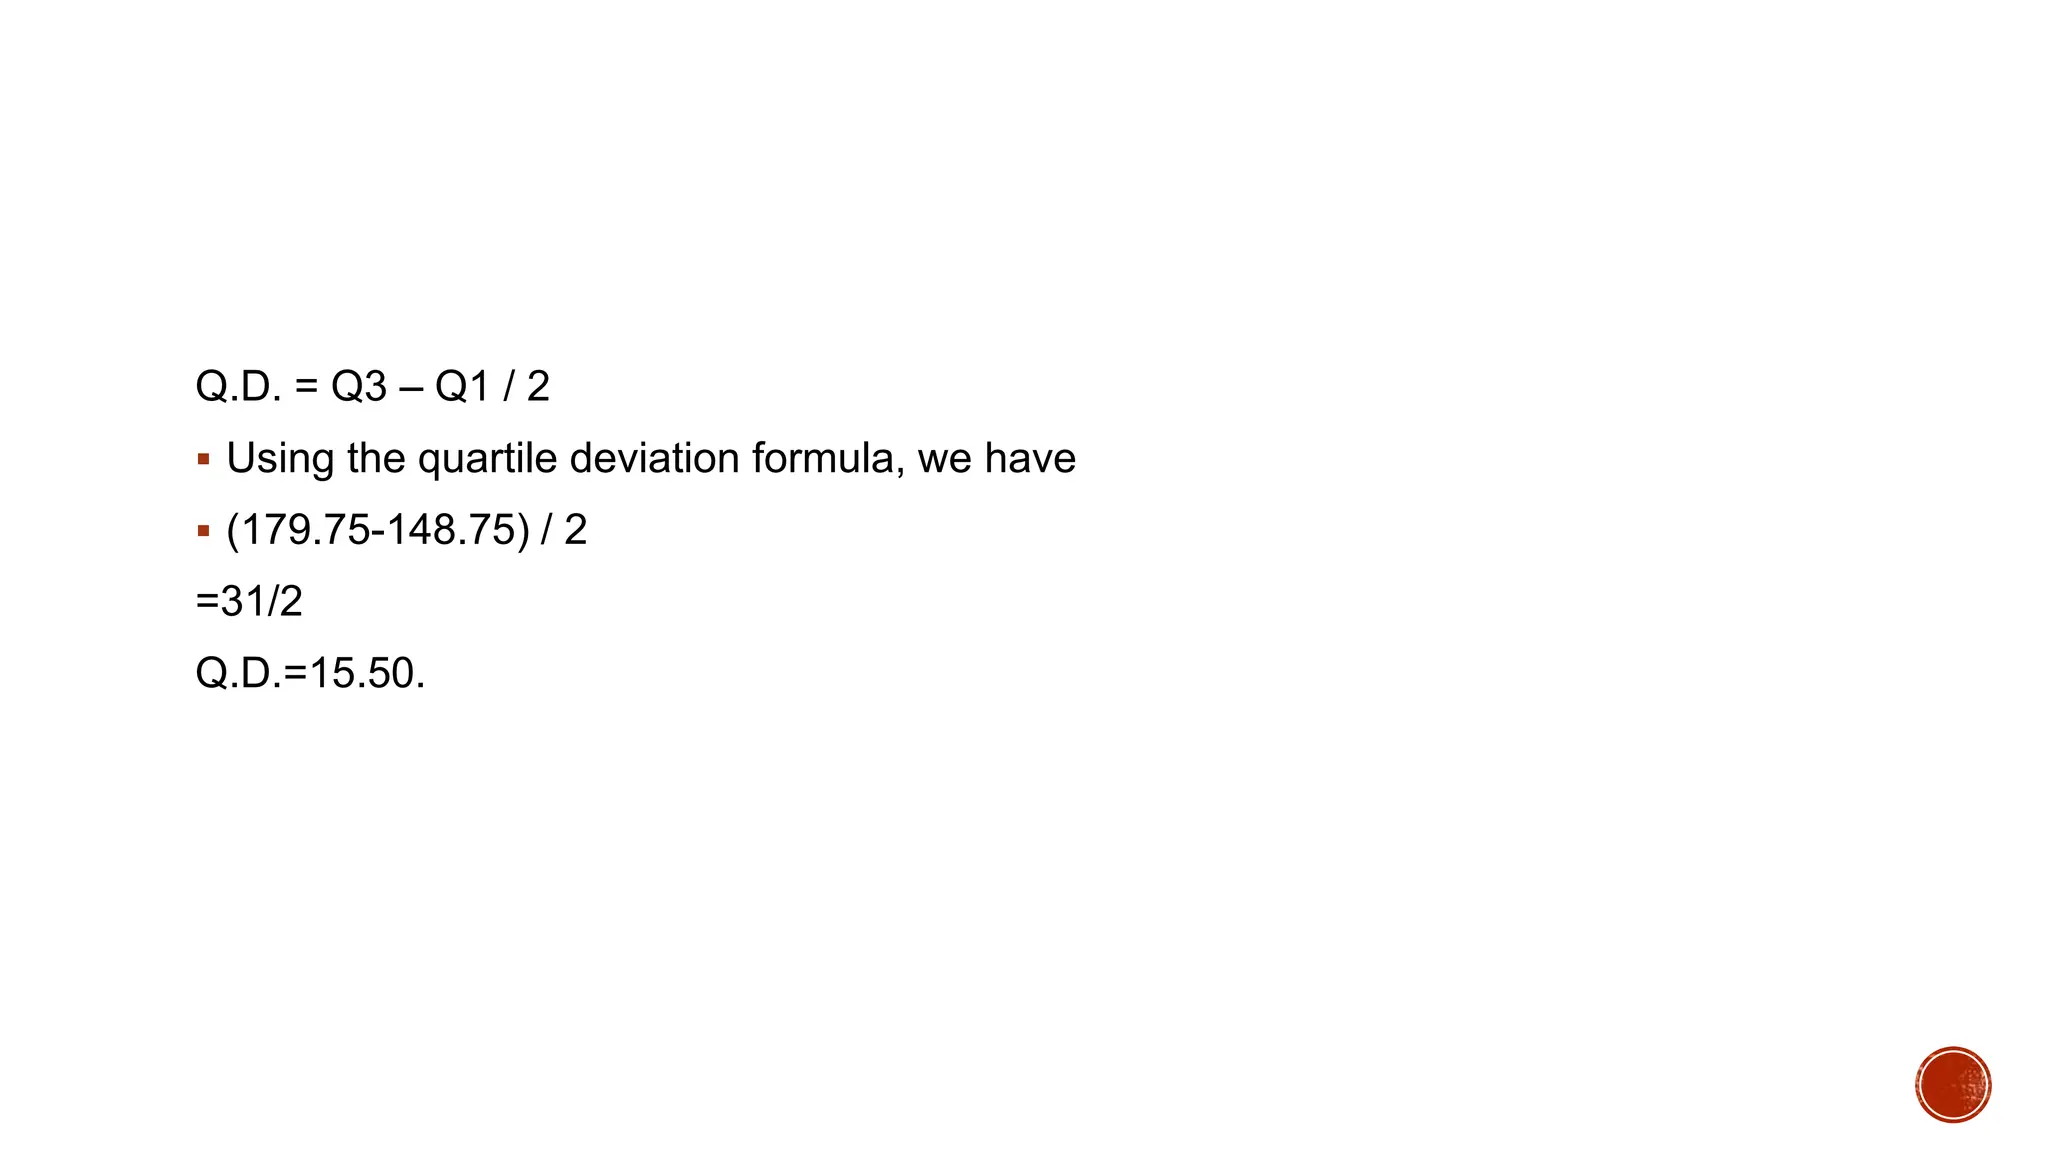
➥🔝 7737669865 🔝▻ bhavnagar Call-girls in Women Seeking Men 🔝bhavnagar🔝 Esc...
Measures-of-variation-report- advance stat
1.
2. Used to determine the scatter of values in a distribution.
are ways to describe the distribution or dispersion of data. It
shows how far apart data points are from one another.
Statisticians use measures of variation to summarize their
data. You can draw many conclusions by using measures of
variation, such as high and low variability.
3. Describes how far points in the distribution or data collection
are from each other and from the center of data items. Some
terms for variability are spread, scatter and dispersion.
A Low Dispersion indicates that the data points tend to be
clustered tightly around the center.
High Dispersion signifies that they tend to fall further away
4. Range- is the most common and easiest method to calculate
the variation in data.
Range the user subtracts the lowest occurrence data from
the highest data of the series of items.
Formula: R= H- L
R= range
H= Highest Value
L= Lowest value
5. Example:
1. We have a list of 12 students with their age. Find the range from
the given data?
Age of Students:
13,13,14,14,14,15,15,15,15,16,16,16
Solution: H=16 L= 13 R=?
R=H-L
R= 16- 13
R= 3
6. 2. Given Below is the data of the Company and we have to
find the range of the given data.
23 35 65 78 89 32 11 78
Solution: H=89 L= 11 R=?
R=H-L
R= 89-11
R= 78
9. is a measure that describes the existing dispersion in terms of the
distance selected observation points. The smaller the quartiles
deviation, the greater the concentration in the middle half if the
observation in the data set.
Are measures of variation which uses percentiles, deciles, or
quartiles.
Quartile Deviation (QD) means the semi variation between the
upper quartiles (Q3) and lower quartiles (Q1) in a distribution. Q3
- Q1 is reffered as the interquartile range.
10. Example: This are the amounts of time spent on the phones daily by high school
students.
Minutes: 200 320 218 405 64 98 89 140
64 89 98 140 200 218 320 405
𝑄𝑘=
𝑘
4
(n+1) 𝑄𝑘=
𝑘
4
(n+1) IR= Q3- Q1
𝑄1=
1
4
(8+1) 𝑄3=
3
4
(8+1) IR= 294.5-91.25
𝑄1= 2.25th 𝑄3=6.75𝑡ℎ IR= 203.25
98-89=9 320-218=102
9x.25=2.25 102x.75=76.5
2.25+89= 91.25 76.5+218= 294.5
13. Also called the Quartile deviation.
It is a measure of spread. It tells you something about the
data is dispersed around a central point (usually mean).
The SIR (Semi interquartile Range) is half of the interquartile
range. All you need to do is find the IQR and divide your
answer by 2.
SIR QD=
𝑄3−𝑄1
2
14. Harry Ltd. is a textile manufacturer and is working on a reward structure. The
management is discussing starting a new initiative, but they first want to know how
much their production spread is.
The management has collected its average daily production data for the last ten days
per (average) employee.
155, 169, 188, 150, 177, 145, 140, 190, 175, 156.
140, 145, 150, 155, 156, 169, 175, 177, 188, 190
Calculation of Q1 can be done as follows,
Q1= ¼ (n+1)th term
=¼ (10+1)
=¼ (11)
Q1= 2.75th Term
Q3= ¾ (n+1)th term
=¾ (11)
Q3= 8.25 Term
2nd term is 145 and now adding
to this 0.75 *
(150 – 145) which is 3.75, and the
result is Q1=148.75
8th term is 177 and now adding
to this 0.25 *
Q3=188 – 177
which is 2.75, and the result is
Q3=179.75
15. Q.D. = Q3 – Q1 / 2
Using the quartile deviation formula, we have
(179.75-148.75) / 2
=31/2
Q.D.=15.50.