Download to read offline

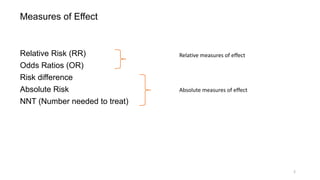


This document discusses various measures used to quantify the effect of exposures or treatments on health outcomes. It describes relative measures like relative risk (RR) and odds ratio (OR), which compare outcomes between exposed and unexposed groups. It also describes absolute measures like risk difference and absolute risk reduction, which provide the actual difference in risk. The number needed to treat (NNT) metric is also introduced, which indicates the number of patients needed to treat to prevent one adverse event based on absolute risk reduction. Examples are provided to illustrate how these measures are calculated and interpreted.