Downloaded 28 times
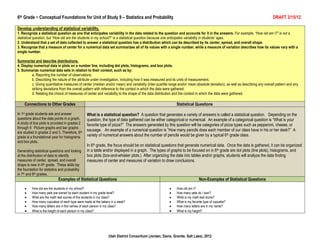
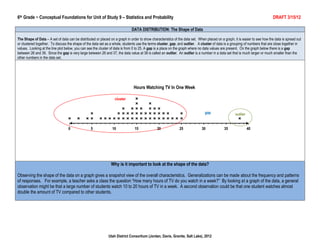
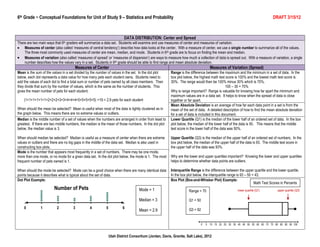
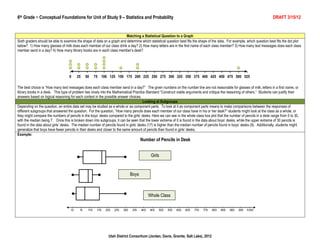
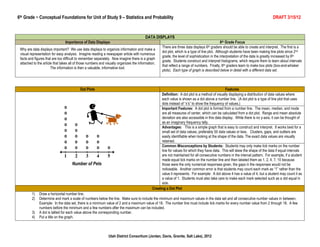

This document provides guidance for a 6th grade statistics and probability unit of study. It outlines key concepts students should understand, including developing questions that anticipate variability, understanding data distributions in terms of center, spread and shape, and summarizing and describing distributions using various graphs such as dot plots, histograms and box plots. Students learn to analyze subgroups within data sets and how to match statistical questions to the appropriate graph. The document emphasizes interpreting and constructing dot plots, histograms and box plots to display and analyze numerical data.