Download to read offline
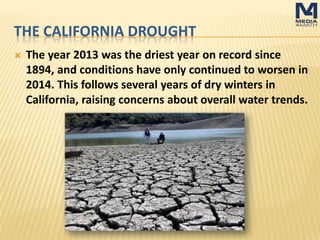
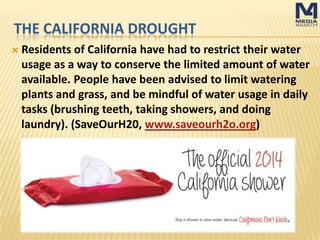
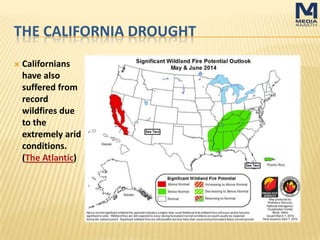
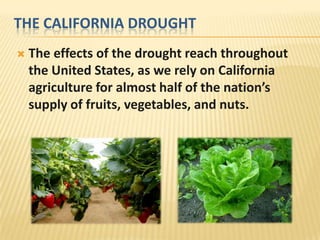
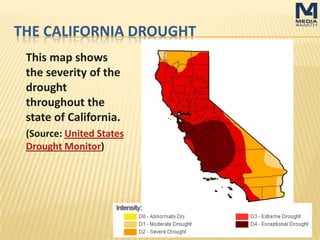
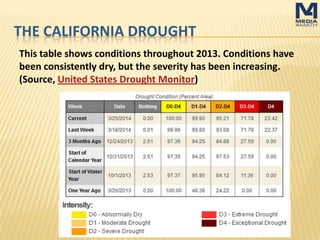
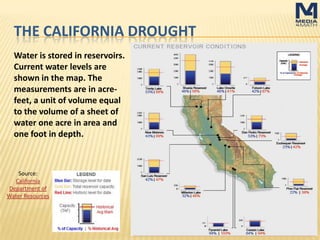
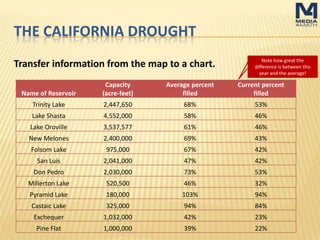
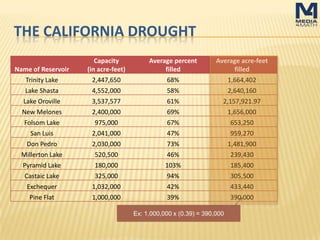

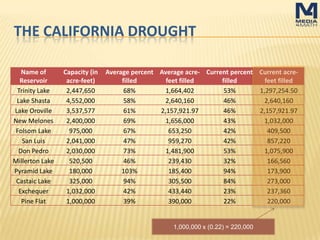
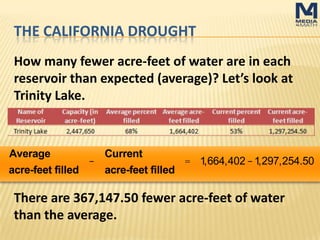

The document discusses the ongoing California drought, highlighting that 2013 was the driest year recorded since 1894, with worsening conditions in 2014. It outlines the restrictions imposed on water usage by residents, the impact on agriculture which supplies nearly half of the nation's fruits and vegetables, and the severe water level declines in various reservoirs. Additionally, it emphasizes the need for individuals to assess their water consumption and the broader implications of the drought on the state and the country.


