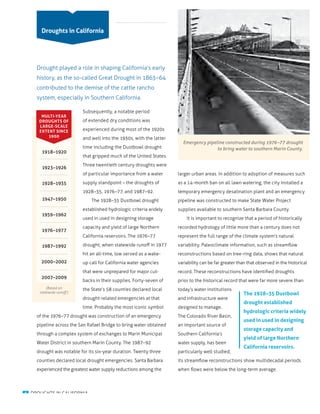
Drought in California
California Department of Water Resources
Natural Resources Agency
State of California
Definition California
Drought
Cause &
Prediction
Impact Groundwater Preparation
0
10
20
30
40
1900 1910 1920 1930 1940 1950 1960 1970
YEAR
INCHES
red line Denotes 11-year running mean Western regional
Climate Center
1980 1990 2000 2010
Defining Drought
2 0 1 2 D R O U G H T B R O C H U R E
2
CALIFORNIA STATEWIDE PRECIPITATION
OCT–SEPT (WATER YEAR)
CONTENTS
2
4 Droughts in California
6 Drought Causation and Prediction
8
10 Droughts and groundwater
11
Defining Drought
2 0 1 2 D R O U G H T B R O C H U R E
3
Powell has been below average in 10 of the past 13 years,
The Colorado has historically been a highly reliable water
supply for Southern California despite long-term drought,
to water agencies may be exacerbated by other factors
from a water use
conditions constituting a
drought for water users
in one location may not
2 0 1 2 D R O U G H T B R O C H U R E
4
contributed to the demise of the cattle rancho
of extended dry conditions was
time including the Dustbowl drought
three twentieth century droughts were
established hydrologic criteria widely
used in used in designing storage
drought-related emergencies at that
recorded hydrology of little more than a century does not
and infrastructure were
DROUGHTS OF
EXTENT SINCE
1900
(Based on
1918–1920
1923–1926
1928–1935
1947–1950
1959–1962
1976–1977
1987–1992
2000–2002
2007–2009
Emergency pipeline constructed during 1976–77 drought
Flow,MillionAcre-Feet
YEAR
25
20
800 1000900 1100 1200 1300 1400 1500 1600 1700 1800 1900 2000
2005
15
15
5
0
762
2 0 1 2 D R O U G H T B R O C H U R E
5
Some 5,000–6,000 years ago these trees were growing on lands
now submerged by Lake Tahoe, illustrating centuries-long periods
drier than present conditions. National Geographic submersible
shown inspecting tree stumps still rooted in place on the lakebed.
Photo courtesy of National Geographic.
RECONSTRUCTED COLORADO RIVER
STREAMFLOW AT LEE FERRY
storms more or less shift the balance between a wet year and
The impacts of climate change, such as the shift
becoming increasingly discernible in analysis of
evaluate the natural climate variability seen in
historical and paleoclimate records, together with Source: National Climate Data Center
1 2005
2 2010
3 1998
4 2003
5 2002
6 2006
7 2009
8 2007
9 2004
10 2001
0
2
5
INCHES
7
9
Jan. Feb. Mar. Apr. May June
MONTHS
July Aug. Sept. Oct. Nov. Dec.
0
2
5
7
9
1 2 3 4 5 6 7 8 9 10 11 12
2 0 1 2 D R O U G H T B R O C H U R E
7
KEY
Atmospheric river storms – storms fueled by concentrated
A few major storms more or less shift the balance between
Image courtesy NOAA Hydrometeorology Testbed.
2 0 1 2 D R O U G H T B R O C H U R E
8
SIZE DISTRIBUTION OF
CALIFORNIA PUBLIC WATER SYSTEMS
California Department of Public Health data
KEY
CWS
NCWS
2 0 1 2 D R O U G H T B R O C H U R E
9
commonly groundwater
in fractured rock systems
or in small coastal terrace
Some avocado growers in Southern California stumped
orchards as a short-term measure to reduce water use
2 0 1 2 D R O U G H T B R O C H U R E
10
ability to increase their use of groundwater when those
statewide or large regional scales in a
GROUNDWATER BASINS
OSP 12 128357
Guidebook to Assist Urban Water
Suppliers to Prepare a 2010 Urban
Water Management Plan
California
Department of Water Resources
2 0 1 2 D R O U G H T B R O C H U R E
11
regional-scale water infrastructure greatly enhances
integrated regional water management
The Urban Water
Act was adopted in
a process of continuing
to local plans for
ensuring service area
must include a water shortage contingency analysis that
drinking water regulations require that the
F A L L 2 0 1 2
California Department of Water Resources

Drought in California

  • 1.
    Drought in California CaliforniaDepartment of Water Resources Natural Resources Agency State of California Definition California Drought Cause & Prediction Impact Groundwater Preparation
  • 2.
    0 10 20 30 40 1900 1910 19201930 1940 1950 1960 1970 YEAR INCHES red line Denotes 11-year running mean Western regional Climate Center 1980 1990 2000 2010 Defining Drought 2 0 1 2 D R O U G H T B R O C H U R E 2 CALIFORNIA STATEWIDE PRECIPITATION OCT–SEPT (WATER YEAR) CONTENTS 2 4 Droughts in California 6 Drought Causation and Prediction 8 10 Droughts and groundwater 11
  • 3.
    Defining Drought 2 01 2 D R O U G H T B R O C H U R E 3 Powell has been below average in 10 of the past 13 years, The Colorado has historically been a highly reliable water supply for Southern California despite long-term drought, to water agencies may be exacerbated by other factors from a water use conditions constituting a drought for water users in one location may not
  • 4.
    2 0 12 D R O U G H T B R O C H U R E 4 contributed to the demise of the cattle rancho of extended dry conditions was time including the Dustbowl drought three twentieth century droughts were established hydrologic criteria widely used in used in designing storage drought-related emergencies at that recorded hydrology of little more than a century does not and infrastructure were DROUGHTS OF EXTENT SINCE 1900 (Based on 1918–1920 1923–1926 1928–1935 1947–1950 1959–1962 1976–1977 1987–1992 2000–2002 2007–2009 Emergency pipeline constructed during 1976–77 drought
  • 5.
    Flow,MillionAcre-Feet YEAR 25 20 800 1000900 11001200 1300 1400 1500 1600 1700 1800 1900 2000 2005 15 15 5 0 762 2 0 1 2 D R O U G H T B R O C H U R E 5 Some 5,000–6,000 years ago these trees were growing on lands now submerged by Lake Tahoe, illustrating centuries-long periods drier than present conditions. National Geographic submersible shown inspecting tree stumps still rooted in place on the lakebed. Photo courtesy of National Geographic. RECONSTRUCTED COLORADO RIVER STREAMFLOW AT LEE FERRY
  • 6.
    storms more orless shift the balance between a wet year and The impacts of climate change, such as the shift becoming increasingly discernible in analysis of evaluate the natural climate variability seen in historical and paleoclimate records, together with Source: National Climate Data Center 1 2005 2 2010 3 1998 4 2003 5 2002 6 2006 7 2009 8 2007 9 2004 10 2001
  • 7.
    0 2 5 INCHES 7 9 Jan. Feb. Mar.Apr. May June MONTHS July Aug. Sept. Oct. Nov. Dec. 0 2 5 7 9 1 2 3 4 5 6 7 8 9 10 11 12 2 0 1 2 D R O U G H T B R O C H U R E 7 KEY Atmospheric river storms – storms fueled by concentrated A few major storms more or less shift the balance between Image courtesy NOAA Hydrometeorology Testbed.
  • 8.
    2 0 12 D R O U G H T B R O C H U R E 8 SIZE DISTRIBUTION OF CALIFORNIA PUBLIC WATER SYSTEMS California Department of Public Health data KEY CWS NCWS
  • 9.
    2 0 12 D R O U G H T B R O C H U R E 9 commonly groundwater in fractured rock systems or in small coastal terrace Some avocado growers in Southern California stumped orchards as a short-term measure to reduce water use
  • 10.
    2 0 12 D R O U G H T B R O C H U R E 10 ability to increase their use of groundwater when those statewide or large regional scales in a GROUNDWATER BASINS
  • 11.
    OSP 12 128357 Guidebookto Assist Urban Water Suppliers to Prepare a 2010 Urban Water Management Plan California Department of Water Resources 2 0 1 2 D R O U G H T B R O C H U R E 11 regional-scale water infrastructure greatly enhances integrated regional water management The Urban Water Act was adopted in a process of continuing to local plans for ensuring service area must include a water shortage contingency analysis that drinking water regulations require that the
  • 12.
    F A LL 2 0 1 2 California Department of Water Resources