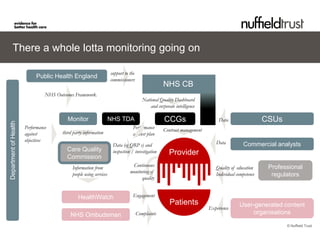
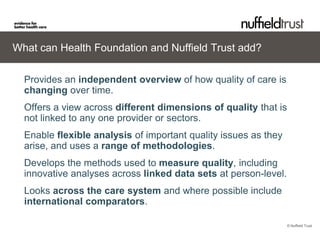
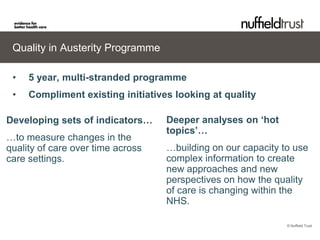
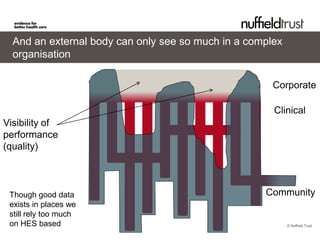
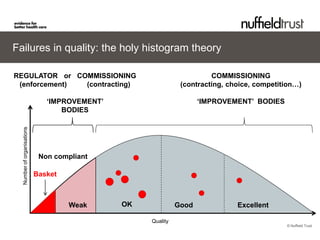
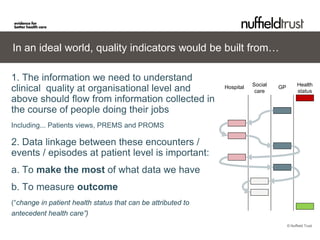
Quality In Austerity - Indicators of
Quality


Martin Bardsley
Director of Research, Nuffield Trust
March 2013
                                       © Nuffield Trust
Twitter: #NTSummit
Why is HF/NT investing in work on quality?

There is no inevitable inverse relationship between finance and
quality but....
•   Financial pressure may divert attention from quality
•   Search for transformational changes in delivery may have
    unintended consequences (good/bad) on quality
•   Historically success in areas like waiting times and HAI linked
    with significant investment
•   Efficiencies likely to be sought in staffing
•   New organisational structures everywhere
•   Implications of austerity on health needs
                                                                  © Nuffield Trust
There a whole lotta monitoring going on

                                                                     support to the
                            Public Health England                    commissioners                                                      Experience
                                                                                                                                        Inspection
                                                                                                                                        Data monitoring
                                                                                                                                        Contract
                                                                                                                                        Self monitoring
                                                                                                     NHS CB
                                 NHS Outcomes Framework.
                                                                                                                                        monitoring
                                                                                         National Quality Dashboard
                                                                                             and corporate intelligence

                                           Monitor                   NHS TDA                         CCGs                       Data                  CSUs
Department of Health


                       Performance                                               Performance         Contract management
                       against          third party information                  against plan
                       objectives                                                                                             Data
                                                                      Data (eg QRP s) and                                                   Commercial analysts
                                          Care Quality                inspection / investigation        Provider
                                          Commission
                                             Information from                    Continuous                                   Quality of education     Professional
                                             people using services              monitoring of                                 Individual competence     regulators
                                                                                      quality


                                                HealthWatch                      Engagement
                                                                                                        Patients                          User-generated content
                                                                                                                           Experience
                                            NHS Ombudsman                             Complaints                                              organisations

                                                                                                                                                             © Nuffield Trust
What can Health Foundation and Nuffield Trust add?

  Provides an independent overview of how quality of care is
  changing over time.
  Offers a view across different dimensions of quality that is
  not linked to any one provider or sectors.
  Enable flexible analysis of important quality issues as they
  arise, and uses a range of methodologies.
  Develops the methods used to measure quality, including
  innovative analyses across linked data sets at person-level.
  Looks across the care system and where possible include
  international comparators.

                                                                 © Nuffield Trust
Quality in Austerity Programme

 •   5 year, multi-stranded programme
 •   Compliment existing initiatives looking at quality

Developing sets of indicators…     Deeper analyses on ‘hot
                                   topics’…
…to measure changes in the
quality of care over time across   …building on our capacity to use
care settings.                     complex information to create
                                   new approaches and new
                                   perspectives on how the quality
                                   of care is changing within the
                                   NHS.

                                                              © Nuffield Trust
Topic: Trends in Ambulatory Care Sensitive Admissions


                       ACS admissions have increase by 40%
                       in the last 10 years – will they continue to
                       grow?

                       300,000
Emergency admissions


                       250,000

                       200,000

                       150,000

                       100,000

                        50,000

                            0

                                                                      Age-standardised rates of admission for ear,
                                                                      nose and throat infections, 2011/12
                                                                                                           © Nuffield Trust
Individual indicators


Effectiveness


 Access and
  timeliness


  Capacity


 Safety


   Patient
centeredness


   Equity


                        © Nuffield Trust
An explosion of indicators…
                   …but some areas better covered than others
Outcomes Frameworks, NICE, QRP, QIPP, QOF, Quality Accounts, Dashboards, Thermometers, Atlases…

                             Primary and   Secondary / tertiary provision
                                                                                           Population /
                             community     General and         Mental       Social care   commissioner     Total
                              provision      acute             health        provision        level

             Effectiveness    147            274               26              13            82           542
              Access and
               timeliness       46            75               41              13              9          184

               Capacity         35            47               24              30              1          137

                Safety          66           160               82              11              7          326
                Patient
             centeredness       27           159               77              18              5          286

                Equity           7            10               10               0              1           28

               Total          328            725              260              85           105           1503     © Nuffield Trust
Even more limited outside acute trusts

Some areas better populated than others

Hospital admin systems - strong on activity and coverage but limited detail
General Practice – massive data sets with untapped potential
Acute care specialist and clinical systems – hugely variable
Social Care – tend to be local, not shared. Major problem re self funders
Community Care – very variable
Independent Sector Care – very limited


                                                                            © Nuffield Trust
And an external body can only see so much in a complex
  organisation

                                                      Corporate

                                                      Clinical
Visibility of
performance
(quality)


 Though good data                                   Community
 exists in places we
 still rely too much
 on HES based                                              © Nuffield Trust
Failures in quality: the holy histogram theory

REGULATOR or COMMISSIONING                                              COMMISSIONING
 (enforcement) (contracting)                                   (contracting, choice, competition…)

                               ‘IMPROVEMENT’                         ‘IMPROVEMENT’ BODIES
                                   BODIES
  Number of organisations


                             Non compliant

                            Basket


                                     Weak      OK             Good             Excellent

                                                    Quality
                                                                                             © Nuffield Trust
In an ideal world, quality indicators would be built from…

1. The information we need to understand
                                                                         Social              Health
clinical quality at organisational level and                  Hospital
                                                                          care
                                                                                  GP
                                                                                             status
above should flow from information collected in
the course of people doing their jobs
Including... Patients views, PREMS and PROMS

2. Data linkage between these encounters /
events / episodes at patient level is important:
a. To make the most of what data we have
b. To measure outcome
(“change in patient health status that can be attributed to
antecedent health care”)
                                                                                       © Nuffield Trust
Some of the most critical areas are the most challenging
eg Information from care users

  Care Users – Surveys, F&F, Complaints, Individual reports/stories
  Patient reported outcome measures
  Staff perceptions
  Quality of medical treatments – limited information
  Patient outcomes – difficult to assign causality
  Capturing qualitative intelligence


  Improving these will help but no guarantee of predicting
  future failure                                                      © Nuffield Trust
So what do we need to do…

A. Continue developing information from patients and staff
B. Fill the gaps for services that are lacunae – OOH,
   community, independent sectors...
C. Go beyond HES into the quality of services including
   clinical audits
D. Integrate the quantitative and qualitative
E. Link data to make the most of what there is and to assess
   consequences /outcome


F. Link the information to subsequent action....
                                                               © Nuffield Trust

Martin Bardsley: Quality In Austerity-Indicators of Quality

  • 1.
    Quality In Austerity- Indicators of Quality Martin Bardsley Director of Research, Nuffield Trust March 2013 © Nuffield Trust Twitter: #NTSummit
  • 2.
    Why is HF/NTinvesting in work on quality? There is no inevitable inverse relationship between finance and quality but.... • Financial pressure may divert attention from quality • Search for transformational changes in delivery may have unintended consequences (good/bad) on quality • Historically success in areas like waiting times and HAI linked with significant investment • Efficiencies likely to be sought in staffing • New organisational structures everywhere • Implications of austerity on health needs © Nuffield Trust
  • 3.
    There a wholelotta monitoring going on support to the Public Health England commissioners Experience Inspection Data monitoring Contract Self monitoring NHS CB NHS Outcomes Framework. monitoring National Quality Dashboard and corporate intelligence Monitor NHS TDA CCGs Data CSUs Department of Health Performance Performance Contract management against third party information against plan objectives Data Data (eg QRP s) and Commercial analysts Care Quality inspection / investigation Provider Commission Information from Continuous Quality of education Professional people using services monitoring of Individual competence regulators quality HealthWatch Engagement Patients User-generated content Experience NHS Ombudsman Complaints organisations © Nuffield Trust
  • 4.
    What can HealthFoundation and Nuffield Trust add? Provides an independent overview of how quality of care is changing over time. Offers a view across different dimensions of quality that is not linked to any one provider or sectors. Enable flexible analysis of important quality issues as they arise, and uses a range of methodologies. Develops the methods used to measure quality, including innovative analyses across linked data sets at person-level. Looks across the care system and where possible include international comparators. © Nuffield Trust
  • 5.
    Quality in AusterityProgramme • 5 year, multi-stranded programme • Compliment existing initiatives looking at quality Developing sets of indicators… Deeper analyses on ‘hot topics’… …to measure changes in the quality of care over time across …building on our capacity to use care settings. complex information to create new approaches and new perspectives on how the quality of care is changing within the NHS. © Nuffield Trust
  • 6.
    Topic: Trends inAmbulatory Care Sensitive Admissions ACS admissions have increase by 40% in the last 10 years – will they continue to grow? 300,000 Emergency admissions 250,000 200,000 150,000 100,000 50,000 0 Age-standardised rates of admission for ear, nose and throat infections, 2011/12 © Nuffield Trust
  • 7.
    Individual indicators Effectiveness Accessand timeliness Capacity Safety Patient centeredness Equity © Nuffield Trust
  • 8.
    An explosion ofindicators… …but some areas better covered than others Outcomes Frameworks, NICE, QRP, QIPP, QOF, Quality Accounts, Dashboards, Thermometers, Atlases… Primary and Secondary / tertiary provision Population / community General and Mental Social care commissioner Total provision acute health provision level Effectiveness 147 274 26 13 82 542 Access and timeliness 46 75 41 13 9 184 Capacity 35 47 24 30 1 137 Safety 66 160 82 11 7 326 Patient centeredness 27 159 77 18 5 286 Equity 7 10 10 0 1 28 Total 328 725 260 85 105 1503 © Nuffield Trust
  • 9.
    Even more limitedoutside acute trusts Some areas better populated than others Hospital admin systems - strong on activity and coverage but limited detail General Practice – massive data sets with untapped potential Acute care specialist and clinical systems – hugely variable Social Care – tend to be local, not shared. Major problem re self funders Community Care – very variable Independent Sector Care – very limited © Nuffield Trust
  • 10.
    And an externalbody can only see so much in a complex organisation Corporate Clinical Visibility of performance (quality) Though good data Community exists in places we still rely too much on HES based © Nuffield Trust
  • 11.
    Failures in quality:the holy histogram theory REGULATOR or COMMISSIONING COMMISSIONING (enforcement) (contracting) (contracting, choice, competition…) ‘IMPROVEMENT’ ‘IMPROVEMENT’ BODIES BODIES Number of organisations Non compliant Basket Weak OK Good Excellent Quality © Nuffield Trust
  • 12.
    In an idealworld, quality indicators would be built from… 1. The information we need to understand Social Health clinical quality at organisational level and Hospital care GP status above should flow from information collected in the course of people doing their jobs Including... Patients views, PREMS and PROMS 2. Data linkage between these encounters / events / episodes at patient level is important: a. To make the most of what data we have b. To measure outcome (“change in patient health status that can be attributed to antecedent health care”) © Nuffield Trust
  • 13.
    Some of themost critical areas are the most challenging eg Information from care users Care Users – Surveys, F&F, Complaints, Individual reports/stories Patient reported outcome measures Staff perceptions Quality of medical treatments – limited information Patient outcomes – difficult to assign causality Capturing qualitative intelligence Improving these will help but no guarantee of predicting future failure © Nuffield Trust
  • 14.
    So what dowe need to do… A. Continue developing information from patients and staff B. Fill the gaps for services that are lacunae – OOH, community, independent sectors... C. Go beyond HES into the quality of services including clinical audits D. Integrate the quantitative and qualitative E. Link data to make the most of what there is and to assess consequences /outcome F. Link the information to subsequent action.... © Nuffield Trust