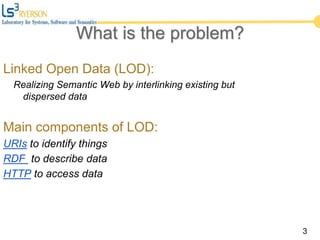
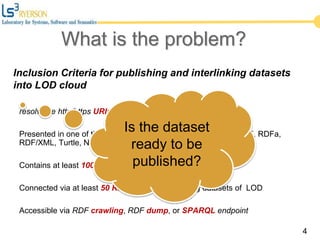
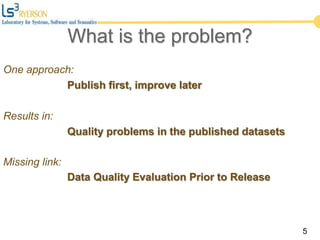
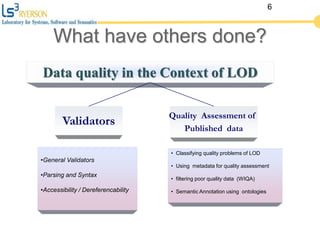
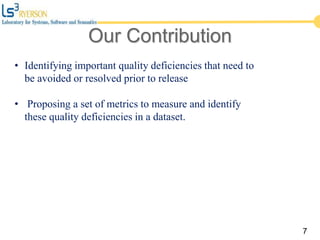
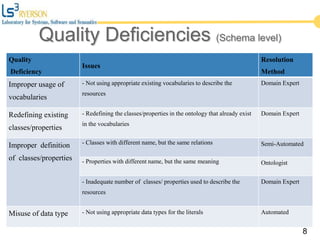
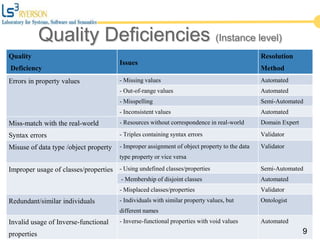
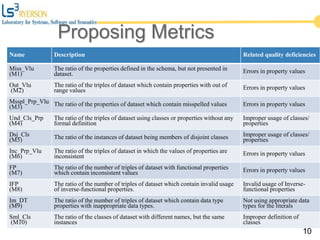
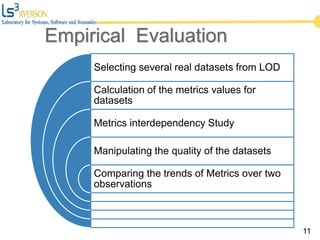
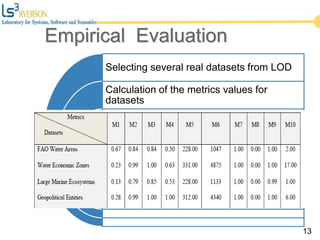
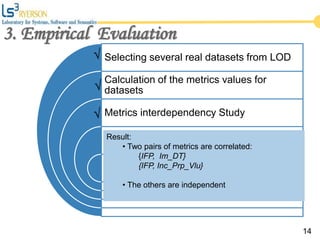
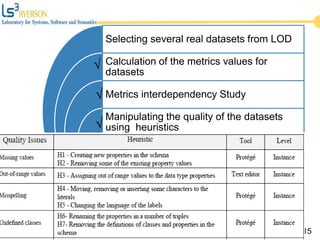
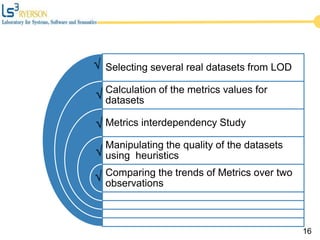
Structural syntactic metrics for RDF Datasets that correlate with high level quality deficiencies.
The vision of the Linked Open Data (LOD) initiative is to provide a model for publishing data and meaningfully interlinking such dispersed but related data. Despite the importance of data quality for the successful growth of the LOD, only limited attention has been focused on quality of data prior to their publication on the LOD. This paper focuses on the systematic assessment of the quality of datasets prior to publication on the LOD cloud. To this end, we identify important quality deficiencies that need to be avoided and/or resolved prior to the publication of a dataset. We then propose a set of metrics to measure and identify these quality deficiencies in a dataset. This way, we enable the assessment and identification of undesirable quality characteristics of a dataset through our proposed metrics.
Slides for paper presentation at DEXA 2015:
Behshid Behkamal, Mohsen Kahani, Ebrahim Bagheri:
Quality Metrics for Linked Open Data. DEXA (1) 2015: 144-152
1. Behshid Behkamal, Mohsen Kahani, Ebrahim Bagheri
Quality Metrics for
Linked Open Data
Bagheri@ryerson.ca
2. What is the problem?
What have others done?
What is our solution?
Does it work?
Outline
2
3. 3
What is the problem?
Linked Open Data (LOD):
Realizing Semantic Web by interlinking existing but
dispersed data
Main components of LOD:
URIs to identify things
RDF to describe data
HTTP to access data
4. Inclusion Criteria for publishing and interlinking datasets
into LOD cloud
resolvable http/https URIs
Presented in one of the standard formats of Semantic Web (RDF, RDFa,
RDF/XML, Turtle, N-Triples)
Contains at least 1000 triples
Connected via at least 50 RDF links to the existing datasets of LOD
Accessible via RDF crawling, RDF dump, or SPARQL endpoint
4
Is the dataset
ready to be
published?
What is the problem?
5. 5
One approach:
Publish first, improve later
Results in:
Quality problems in the published datasets
Missing link:
Data Quality Evaluation Prior to Release
What is the problem?
6. Data quality in the Context of LOD
•General Validators
•Parsing and Syntax
•Accessibility / Dereferencability
Validators
Quality Assessment of
Published data
• Classifying quality problems of LOD
• Using metadata for quality assessment
• filtering poor quality data (WIQA)
• Semantic Annotation using ontologies
6
What have others done?
7. Our Contribution
7
• Identifying important quality deficiencies that need to
be avoided or resolved prior to release
• Proposing a set of metrics to measure and identify
these quality deficiencies in a dataset.
8. Quality
Deficiency
Issues
Resolution
Method
Improper usage of
vocabularies
- Not using appropriate existing vocabularies to describe the
resources
Domain Expert
Redefining existing
classes/properties
- Redefining the classes/properties in the ontology that already exist
in the vocabularies
Domain Expert
Improper definition
of classes/properties
- Classes with different name, but the same relations Semi-Automated
- Properties with different name, but the same meaning Ontologist
- Inadequate number of classes/ properties used to describe the
resources
Domain Expert
Misuse of data type - Not using appropriate data types for the literals Automated
8
Quality Deficiencies (Schema level)
9. Quality
Deficiency
Issues
Resolution
Method
Errors in property values - Missing values Automated
- Out-of-range values Automated
- Misspelling Semi-Automated
- Inconsistent values Automated
Miss-match with the real-world - Resources without correspondence in real-world Domain Expert
Syntax errors - Triples containing syntax errors Validator
Misuse of data type /object property - Improper assignment of object property to the data
type property or vice versa
Validator
Improper usage of classes/properties - Using undefined classes/properties Semi-Automated
- Membership of disjoint classes Automated
- Misplaced classes/properties Validator
Redundant/similar individuals - Individuals with similar property values, but
different names
Ontologist
Invalid usage of Inverse-functional
properties
- Inverse-functional properties with void values Automated
9
Quality Deficiencies (Instance level)
10. Name Description Related quality deficiencies
Miss_Vlu
(M1)
The ratio of the properties defined in the schema, but not presented in
dataset. Errors in property values
Out_Vlu
(M2)
The ratio of the triples of dataset which contain properties with out of
range values Errors in property values
Msspl_Prp_Vlu
(M3) The ratio of the properties of dataset which contain misspelled values Errors in property values
Und_Cls_Prp
(M4)
The ratio of the triples of dataset using classes or properties without any
formal definition
Improper usage of classes/
properties
Dsj_Cls
(M5) The ratio of the instances of dataset being members of disjoint classes Improper usage of classes/
properties
Inc_Prp_Vlu
(M6)
The ratio of the triples of dataset in which the values of properties are
inconsistent Errors in property values
FP
(M7)
The ratio of the number of triples of dataset with functional properties
which contain inconsistent values Errors in property values
IFP
(M8)
The ratio of the number of triples of dataset which contain invalid usage
of inverse-functional properties.
Invalid usage of Inverse-
functional properties
Im_DT
(M9)
The ratio of the number of triples of dataset which contain data type
properties with inappropriate data types.
Not using appropriate data
types for the literals
Sml_Cls
(M10)
The ratio of the classes of dataset with different names, but the same
instances
Improper definition of
classes
10
Proposing Metrics
11. Selecting several real datasets from LOD
Calculation of the metrics values for
datasets
Metrics interdependency Study
Manipulating the quality of the datasets
Comparing the trends of Metrics over two
observations
11
Empirical Evaluation
12. Real world datasets
Calculation of the metrics values for
datasets
Metrics interdependency Study
Manipulating the quality of the datasets
Comparing the trends of Metrics over two
observations
12
Datasets
No. of
triples
No. of
instances
No. of
classes
No. of
properties
FAO Water Areas 10,730 586 31 19
Water Economic Zones 29,193 1,074 113 127
Large Marine Ecosystems 12,012 716 21 31
Geopolitical Entities 22,725 312 88 101
ISSCAAP Species Classification 398,166 25,253 52 93
Species Taxonomic Classification 319,490 11,741 33 26
Commodities 56,420 2,788 10 19
Vessels 4,236 240 6 22
Empirical Evaluation
13. Selecting several real datasets from LOD
Calculation of the metrics values for
datasets
Metrics interdependency Study
Manipulating the quality of the datasets
Comparing the trends of Metrics over two
observations
13
Empirical Evaluation
14. Selecting several real datasets from LOD
Calculation of the metrics values for
datasets
Metrics interdependency Study
Manipulating the quality of the datasets
using heuristics
Comparing the trends of Metrics over two
observations
14
√
√
√
3. Empirical Evaluation
Result:
• Two pairs of metrics are correlated:
{IFP, Im_DT}
{IFP, Inc_Prp_Vlu}
• The others are independent
15. Selecting several real datasets from LOD
Calculation of the metrics values for
datasets
Metrics interdependency Study
Manipulating the quality of the datasets
using heuristics
Comparing the trends of Metrics over two
observations
15
√
√
√
16. Selecting several real datasets from LOD
Calculation of the metrics values for
datasets
Metrics interdependency Study
Manipulating the quality of the datasets
using heuristics
Comparing the trends of Metrics over two
observations
16
√
√
√
√
√
17. Results analysis
In 78% of the scenarios, the metrics react as expected to the
corresponding heuristics:
Heuristics applied and corresponding metrics have changed (23%)
Heuristics have not been applied and the metric values have not changed
(55%)
In 22% of the scenarios, heuristics have been applied and corresponding
metrics have not changed, because:
Dependency between heuristics caused some side effects
The ratio of heuristics done over the size of datasets is very low
17
The main goal of LOD is to create knowledge by interlinking already existing, but dispersed data.
LOD has built on three principles: URI, RDF, HTTP
To better understanding of the problem, we review the requirements for publishing a datasets.
First, it should be resolvable by URI.
However, the usefulness of knowledge created through LOD, strongly depends on the quality of the published data.
Now, a question. If a dataset satisfy all of these criteria, is it ready to publish?
This is the question that we are going to answer now.
As the main idea of linked data is based on “publishing first, improving later”, it leads to some quality problems in published datasets.
On the other hand, the usefulness of the knowledge created from LOD, strongly depends on the quality of its data, so there is a missing link in publishing process. It is DATA Quality evaluation before Release
So, we have proposed an automated and scalable method using metrics, to assess the quality of datasets before publishing and interlinking to LOD.
To the best of our knowledge, we found that many of the published datasets suffer from quality issues. We believe that most of these issues have roots in the deficiencies of the sources from where that data is extracted, and they can be avoided if they are identified in the initial stages of publishing
We present the quality deficiencies of data within the published datasets focusing on those which are related to the dataset itself and also detectable in the initial phase of publication. To this end, we have classified the quality issues into schema level and instance level as presented in these tables.
In summary, we have identified eleven quality deficiencies characterizing eighteen quality issues at both schema and instance levels. Among all, six quality issues, which their resolution methods are domain expert or ontologist, cannot be detected by any kind of automated methods and needs the intervention of human experts. It is clear that all of these metrics are very subjective and it is hard, if not impossible, to asses them automatically.
Among the remaining quality issues, only three issues can be detected and resolved by validators. To the extent of our knowledge, there is no validator to cover all of the remaining issues, particularly the issues relating to incompatibility of schema, naming, and inconsistent data. Thus, we propose a set of metrics to address the remaining quality issues. We note that the identified issues and the following proposed metrics are not meant to be comprehensive and are only limited to the issues reported in the literature.
In this section, a set of metrics are proposed to address mentioned quality issues which can be resolved in an automated or semi-automated way.
To achieve this, metrics, proposed in the areas of the Linked Data, relational databases, and data quality models have been considered; the results of which were taken into account as guidelines for designing a useful set of metrics for our purpose. The proposed metrics are presented in this table.
According to the definitions presented for the metrics, it is clear that all of the metrics are defined to measure the quality problems in the scope of the RDF dataset itself, not in the context of other datasets. From the level of quality deficiency point of view, the last two metrics (Im_DT and Sml_Cls) are defined to address intrinsic quality issues at the schema level, while the others are related to the intrinsic quality problems at the instance level.
All of the proposed metrics are theoretically validated in our recently published work [14].
It is necessary to place metrics under empirical evaluation to observe their behavior and show their applicability in practice. So, we first calculated the values of the metrics for eight datasets of different domains and sizes from LOD.
Next, we manipulated the quality of these datasets by applying some heuristics and then recalculated the metric values to observe the behavior of the metrics over these changes. The aim of our dataset manipulation work was to investigate the trends of metrics over real datasets and to compare the results of applying metrics on good and poor quality data.
We have selected eight datasets from the EU FP6 Networked Ontology (NeOn) project.
We have implemented an automated tool that is able to automatically compute the metric values for any given input dataset.
Then we used Spearman test to study metric interdependency. According to Spearman’s correlation, a correlation with a significance p value ≤ 0.05 can be considered to be significant. Two pairs of correlated are metrics and the others are independent.
The reason for the observed correlation is that the values for correlated metrics are mainly '0', and it indicates that there are not many
deficiencies related to the mentioned metrics in the datasets.
Next, we manipulated the quality of these datasets by applying some heuristics and then recalculated the metric values to observe the behavior of the metrics over these changes. The aim of our dataset manipulation work was to investigate the trends of metrics over real datasets and to compare the results of applying metrics on good and poor quality data. To this end, fourteen heuristics are introduced to be used in the dataset contamination process. Some of these quality issues such as misspelling errors were made using an ontology editor, i.e. Protégé.
For those quality issues such as invalid usage of inverse functional properties, errors were introduced manually. We have randomly applied the heuristics to the different datasets. The rationale for this was to measure the values for our metrics both before and after the quality issues were injected.
The aim of the second experiment is to show the trends of the proposed metrics by recalculating the values of the metrics over manipulated datasets.
As a result, we would ideally expect to observe meaningful changes in the values of the metrics according to the heuristics used to manipulate the datasets. In light of the results, it is observed that most of the outcomes are desirable; however, some of the values need more discussions.
Regarding to the results, we observed that in 78% of the scenarios the metrics have behaved as expected.
Dependency between heuristics lead to some side effects
Some of the heuristics were not independent and as a result, the order of applying these heuristics affected the results of measuring the quality problems by the metrics.
The ratio of heuristics done over the size of datasets is very low
Based on this experiment, whenever the number of changes is less that 10% of the triples, the changes of metric values cannot be properly reported.
Although in our scenario, no radical shift in the metric values was observed, but we are not going to generalize our finding about the trends of metrics, because of the limited number of datasets that we have used in this experiment. As a result, we believe more experiments need to be done to reach a valid conclusion about the reaction of metrics to the changes in the measurement subject.