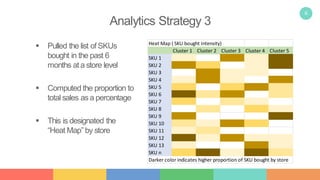
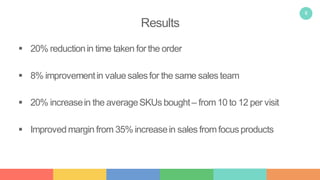
1
Sales Optimization
How to get more saleswith the samesalesforce
New Developments in Measurement and Analytics
2
Background
 ACPGmajorused a hand-held device to takesales orders fromsmall independent
retail stores
 The problem was that as the company had over 200 SKUsand the timetaken to
complete an order was inordinately long as the salesperson had to scroll up and down
the list, even though the average SKUs purchased per visit was only 10
 The SKUsthat cameat the top of the list werethose that the store had already bought,
but to sell SKU’snot sold earlier was an issue
 The opportunity toupsell and cross sell existed while taking lesser timein each store
3
Objectives
 Reduce the time taken foran order by bringing the high probability SKUsto
the top ofthe list
 Also bring key focus SKUsto the top of the list – which the management
would like todrive
 Increase the average number of SKUssold per visit
 Increase the value of the invoice foreach trip
4
Analytics Strategy 1
 Given the wide array ofchoices available tostores of differing profile, asegmentation
analysis was done dividing the stores into 6 clusters
 The most popular to least popular products listed foreach cluster
Average
Price
Store Size
Value
sales
Frequency
of
purchase
Product
type
Area Pin
code
Cluster 1 Cluster 2
Cluster 3 Cluster 4
Cluster 5
5
Analytics Strategy 2
• Built Logistic Regression
Models forall the focusSKUs
• Use purchase patterns at the
SKUlevel, Frequency, Size and
other parameterstaken fromthe
invoice level data
• Computed the probability of
purchasing focusSKU foreach
store
• Validated on existing data
6
Analytics Strategy 3
 Pulled the list ofSKUs
bought in the past 6
months ata store level
 Computed the proportion to
total sales asa percentage
 This is designated the
“Heat Map” by store
Heat Map ( SKU bought Intensity)
Cluster 1 Cluster 2 Cluster 3 Cluster 4 Cluster 5
SKU 1
SKU 2
SKU 3
SKU 4
SKU 5
SKU 6
SKU 7
SKU 8
SKU 9
SKU 10
SKU 11
SKU 12
SKU 13
SKU n
Darker color indicates higher proportion of SKU bought by store
7
Algorithm andAutomation
 algorithm wascreated as a
combination of strategies 1, 2
and 3.This is based on
iterations
 Validated on existing data, with
the highest validating Algorithm
used in market
 The existing IT system was
tweakedto deliver customized
lists by store with highlights on
focusSKUs
Datamart
Algorithm
8
Results
 20% reductionin time taken for the order
 8% improvementin valuesalesfor the same sales team
 20% increasein the averageSKUs bought– from10 to 12 per visit
 Improvedmargin from 35% increasein sales fromfocusproducts
9
Bangalore, IN Office:
No. 141, 2nd Cross, 2nd Main,
Domlur, 2nd Stage, Bangalore 560071
Phone: +91 80 40917572,+91 80 40916116
info@therainman.com
Contact Us US Office:
Suite 100, 1780 Chadds Lake Dr, NE
Marietta, Georgia, 30068-1608
Atlanta, USA
info@bottomlineanalytics.com

Sales optimization

  • 1.
    1 Sales Optimization How toget more saleswith the samesalesforce New Developments in Measurement and Analytics
  • 2.
    2 Background  ACPGmajorused ahand-held device to takesales orders fromsmall independent retail stores  The problem was that as the company had over 200 SKUsand the timetaken to complete an order was inordinately long as the salesperson had to scroll up and down the list, even though the average SKUs purchased per visit was only 10  The SKUsthat cameat the top of the list werethose that the store had already bought, but to sell SKU’snot sold earlier was an issue  The opportunity toupsell and cross sell existed while taking lesser timein each store
  • 3.
    3 Objectives  Reduce thetime taken foran order by bringing the high probability SKUsto the top ofthe list  Also bring key focus SKUsto the top of the list – which the management would like todrive  Increase the average number of SKUssold per visit  Increase the value of the invoice foreach trip
  • 4.
    4 Analytics Strategy 1 Given the wide array ofchoices available tostores of differing profile, asegmentation analysis was done dividing the stores into 6 clusters  The most popular to least popular products listed foreach cluster Average Price Store Size Value sales Frequency of purchase Product type Area Pin code Cluster 1 Cluster 2 Cluster 3 Cluster 4 Cluster 5
  • 5.
    5 Analytics Strategy 2 •Built Logistic Regression Models forall the focusSKUs • Use purchase patterns at the SKUlevel, Frequency, Size and other parameterstaken fromthe invoice level data • Computed the probability of purchasing focusSKU foreach store • Validated on existing data
  • 6.
    6 Analytics Strategy 3 Pulled the list ofSKUs bought in the past 6 months ata store level  Computed the proportion to total sales asa percentage  This is designated the “Heat Map” by store Heat Map ( SKU bought Intensity) Cluster 1 Cluster 2 Cluster 3 Cluster 4 Cluster 5 SKU 1 SKU 2 SKU 3 SKU 4 SKU 5 SKU 6 SKU 7 SKU 8 SKU 9 SKU 10 SKU 11 SKU 12 SKU 13 SKU n Darker color indicates higher proportion of SKU bought by store
  • 7.
    7 Algorithm andAutomation  algorithmwascreated as a combination of strategies 1, 2 and 3.This is based on iterations  Validated on existing data, with the highest validating Algorithm used in market  The existing IT system was tweakedto deliver customized lists by store with highlights on focusSKUs Datamart Algorithm
  • 8.
    8 Results  20% reductionintime taken for the order  8% improvementin valuesalesfor the same sales team  20% increasein the averageSKUs bought– from10 to 12 per visit  Improvedmargin from 35% increasein sales fromfocusproducts
  • 9.
    9 Bangalore, IN Office: No.141, 2nd Cross, 2nd Main, Domlur, 2nd Stage, Bangalore 560071 Phone: +91 80 40917572,+91 80 40916116 info@therainman.com Contact Us US Office: Suite 100, 1780 Chadds Lake Dr, NE Marietta, Georgia, 30068-1608 Atlanta, USA info@bottomlineanalytics.com