This document provides an overview of key concepts related to demand, including:
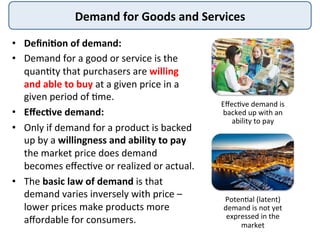
- The definition of demand as the quantity willing and able to be purchased at a given price.
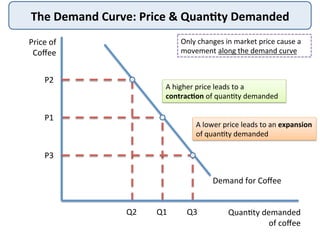
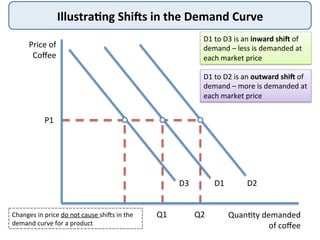
- How the demand curve illustrates the inverse relationship between price and quantity demanded.
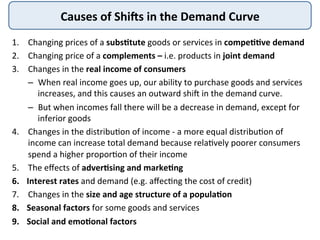
- Factors that can cause a shift in the demand curve, such as changes in income, prices of substitutes/complements, and non-economic factors.
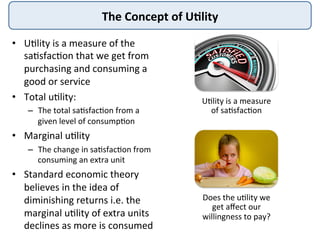
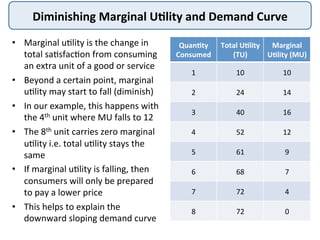
- The concept of utility and how the principle of diminishing marginal utility helps explain the downward slope of the demand curve.
This document provides an overview of market demand theory including definitions of demand, the demand curve, factors that shift the demand curve, and the concepts of utility and diminishing marginal utility. It defines demand as the quantity consumers are willing and able to purchase at a given price. The demand curve illustrates the inverse relationship between price and quantity demanded. Factors like income levels, prices of substitutes/complements, and advertising can cause the demand curve to shift. Utility represents satisfaction from consumption, and the idea of diminishing marginal utility explains why demand curves slope downward.
- A market is where buyers and sellers interact to determine price and quantity for goods and services. The demand side refers to consumers and how much they are willing to pay.
- Firms produce goods and services and households consume them. The circular flow shows the relationship between firms and households in input and output markets.
- Demand is affected by price, income, wealth, tastes, expectations and prices of related goods. The law of demand states that as price increases, quantity demanded decreases.
This short revision presentation explores the distinction between individual and market demand. Market demand is the aggregation of individual demand for goods and services at a given price.
This document discusses cross price elasticity of demand, which measures the responsiveness of the demand for one good to a change in the price of a related good. It provides examples of substitutes, where a price increase of one good raises demand for the other, and complements, where a price decrease of one good increases demand for the other. It also shows calculations of cross price elasticity values and how the strength of the relationship between goods is indicated by the coefficient. Charts illustrate the relationships between substitutes and complements. Finally, it analyzes cross price elasticity factors for UK cinema ticket prices.
Income elasticity of demand (YED) measures how responsive demand is to changes in income. YED is calculated as the percentage change in quantity demanded divided by the percentage change in real income. Goods are classified based on their YED: normal goods have positive YED, luxury goods have YED greater than 1, necessities have positive YED less than 1, and inferior goods have negative YED. Inferior goods are countercyclical and demand increases when incomes fall. Examples of luxury goods include fine wines and resorts while examples of inferior goods include cigarettes and bus transportation.
demand and supply, a free market, equilibrium in marketRAHUL SINHA
notes on chapter 4 of economics book by mankiw.
graphs are taken from the same.
topics covered
WHAT IS MARKET?
WHAT DETERMINES THE QUANTITY AN INDIVIDUAL DEMANDS?
THE DEMAND SCHEDULE AND THE DEMAND CURVE
MARKET DEMAND VERSUS INDIVIDUAL DEMAND
SHIFTS IN THE DEMAND CURVE
WHAT DETERMINES THE QUANTITY AN INDIVIDUAL SUPPLIES?
THE SUPPLY SCHEDULE AND THE SUPPLY CURVE
MARKET SUPPLY VERSUS INDIVIDUAL SUPPLY
SHIFTS IN THE SUPPLY CURVE
SUPPLY AND DEMAND TOGETHER
THREE STEPS TO ANALYZING CHANGES IN EQUILIBRIUM
This document discusses supply and demand in market economies. It defines key terms like market, supply, demand, and how buyers and sellers interact through markets. It explains that supply and demand determine market equilibrium. Demand is defined as the quantity demanded at a given price, and is determined by factors like income, prices of related goods, and expectations. The law of demand and demand curves are described. Changes in demand factors cause the demand curve to shift, while price changes cause movements along a fixed demand curve. Input and output markets are also summarized.
This is a small and easy description of demand and its determinants. PLEASE MUST WATCH IT AND UNDERSTAND IT AND ASK YOUR QUARRIES ALSO , i would love to solve it and give your peaceful reviews regarding this presentation weather it is bad or good.
THANK YOU!!
The document discusses the determinants of demand. It identifies six key determinants: (1) changes in income, (2) changes in prices of related goods like substitutes and complements, (3) changes in population size or composition, (4) changes in price expectations, (5) changes in tastes/preferences, and (6) changes in consumer expectations about health effects. It provides examples showing how an increase or decrease in these determinants would shift a demand curve, representing a change in the quantity demanded at each price level rather than a movement along the curve.
The document summarizes the economic theory of supply and demand. It defines key concepts such as markets, demand, supply, and equilibrium price. Demand is determined by factors like income, wealth, prices of substitutes and complements, population, expected price, and tastes. Supply is determined by the costs of production faced by firms. The interaction of supply and demand forces in a competitive market determines the equilibrium price and quantity traded.
Demand Supply analysis...Explanations for Law of Demand Degree of scarcity of one good relative to another helps determine each good’s relative price Definition of demand includes the “other things constant” assumption Among the “other things” are the prices of other goods Substitution Effect When the price of a good falls, its relative price makes consumers more willing to purchase this good When the price of a good increases, its relative price makes consumers less willing to purchase this good Changes in the relative prices – the price of one good compared to the prices of other goods – causes the substitution effect…you substitute toward the less expensive good.
Demand and Supply Analysis (Economics) Lecture NotesFellowBuddy.com
FellowBuddy.com is an innovative platform that brings students together to share notes, exam papers, study guides, project reports and presentation for upcoming exams.
We connect Students who have an understanding of course material with Students who need help.
Benefits:-
# Students can catch up on notes they missed because of an absence.
# Underachievers can find peer developed notes that break down lecture and study material in a way that they can understand
# Students can earn better grades, save time and study effectively
Our Vision & Mission – Simplifying Students Life
Our Belief – “The great breakthrough in your life comes when you realize it, that you can learn anything you need to learn; to accomplish any goal that you have set for yourself. This means there are no limits on what you can be, have or do.”
Like Us - https://www.facebook.com/FellowBuddycom
This document discusses the various determinants of demand, including price, income, prices of related goods, tastes, government policies, climate, advertising, expectations, and number of consumers. It explains how each of these factors can cause either a shift of the demand curve or a shift along the demand curve. It provides examples to illustrate how changes in income, prices of substitutes and complements, tastes, government policies, climate, and number of consumers impact demand for different goods.
Firms produce goods and services, which are sold in output markets to households. Households supply resources like labor in input markets to firms. Market equilibrium exists where quantity supplied equals quantity demanded, resulting in no incentive for prices to change. A change in demand or supply can shift the curves, impacting equilibrium price and quantity. Higher demand increases price and quantity while higher supply decreases price but increases quantity at the new equilibrium.
The document provides an overview of demand, including key concepts like:
- Demand is the willingness and ability to purchase a good or service
- Demand curves slope downward, showing consumers will buy more of a product at a lower price
- Factors like income, tastes, expectations, and prices of substitutes and complements can cause the demand curve to shift
- The principle of diminishing marginal utility explains why demand curves slope downward, as additional units provide less satisfaction
This document provides an overview of key concepts in microeconomics including markets, supply and demand, equilibrium, consumer and producer surplus, and the effects of changes in supply and demand. It defines markets, demand, the law of demand, supply, the law of supply, and equilibrium. It also discusses consumer surplus, producer surplus, surpluses and shortages, and the effects of price ceilings and floors.
The Market Of Supply and Demand - EconomicsFaHaD .H. NooR
- Supply and demand determine market equilibrium price and quantity in competitive markets. The demand curve shows the relationship between price and quantity demanded, while the supply curve shows the relationship between price and quantity supplied.
- Equilibrium occurs where the supply and demand curves intersect, with price and quantity at the equilibrium point balancing the quantity suppliers are willing to offer and buyers are willing to purchase.
- Changes in supply or demand shift the curves, impacting equilibrium price and quantity. A demand increase raises price and quantity while a supply decrease also raises price but lowers quantity.
Mba1014 individual and market demand 080513Stephen Ong
This document provides an overview of individual and market demand. It begins with a discussion of the theory of demand, including how individual demand curves are derived from price-consumption curves. It then examines how changes in income and prices can affect demand through substitution and income effects. The document discusses how market demand curves are constructed by aggregating individual demand curves. It provides examples of how demand for goods like housing and gasoline are affected by factors like taxes, rebates, and consumer subgroups. The overall purpose is to explain the concepts of individual and market demand.
1. Supply and demand are the market forces that determine price and quantity in a competitive market. The demand curve shows that as price decreases, quantity demanded increases, and the supply curve shows that as price increases, quantity supplied also increases.
2. Equilibrium occurs where the supply and demand curves intersect, establishing an equilibrium price and quantity where the amounts buyers want to purchase and sellers want to sell are equal.
3. Various factors can cause the supply and demand curves to shift, changing the equilibrium price and quantity in the market. Changes in income, prices of related goods, tastes and preferences, expectations, technology and number of buyers/sellers all impact supply and demand.
Economic theory market demand and supplyAbuzer Ansari
This document provides an overview of economic theory related to market demand and supply. It defines key concepts such as markets, demand, supply, demand and supply curves. It outlines the law of demand and supply, which state that demand is negatively correlated with price while supply is positively correlated. Determinants that influence demand and supply are also discussed. The document explains how equilibrium price and quantity are determined by the intersection of the demand and supply curves. It describes the conditions of excess supply/surplus and excess demand/shortage.
Law of supply and demand in Economy and management.
In economics, the relationship between the quantity of a commodity that producers wish to sell at various prices and the quantity that consumers wish to buy. It is the main model of price determination used in economic theory. The price of a commodity is determined by the interaction of supply and demand in a market. The resulting price is referred to as the equilibrium price and represents an agreement between producers and consumers of the good. In equilibrium, the quantity of a good supplied by producers equals the quantity demanded by consumers.
This document discusses demand and supply. It defines demand as the quantity of a good that consumers are willing and able to purchase at a given price, time, and place. The key factors that influence demand are income, population, tastes/preferences, price expectations of related goods, number of buyers, complements, and substitutes. Supply is defined as the quantity of a good that producers are willing and able to produce and offer for sale at a given price, place, and time. The factors that influence supply are resource prices, technology, taxes/subsidies, prices of other goods, producers' expectations, and number of sellers. The document also discusses the law of demand, law of supply, and the interaction between supply
This document provides an overview of demand, supply, and market equilibrium. It begins with introducing the key concepts of demand, including the law of demand which states that as price increases, quantity demanded decreases. Supply is also introduced, with the law of supply stating that as price increases, quantity supplied also increases. Market equilibrium is explained as the price where quantity demanded equals quantity supplied. The document then discusses how equilibrium can change if either demand or supply shifts due to various factors such as income, prices of related goods, technology, and more. Examples are provided to illustrate these concepts and how equilibrium adjustments occur when demand or supply changes.
This document discusses market equilibrium between demand and supply. It defines key concepts like market, demand, supply, demand curves, supply curves, and equilibrium. The equilibrium price and quantity occur where the demand and supply curves intersect, and where the quantity demanded equals the quantity supplied. An example equilibrium calculation is shown using algebraic demand and supply functions. The concepts are illustrated with graphs of the demand curve, supply curve, and equilibrium point.
This document defines demand and discusses the key determinants and concepts related to demand, including:
1. Demand is defined as the amount of a good or service consumers will purchase at a given price. The main determinants of demand are price, income, tastes/preferences, and prices of related goods.
2. The law of demand states that, all else equal, demand increases when price decreases and decreases when price increases. Exceptions include Giffen goods, conspicuous goods, and speculative goods.
3. Elasticity measures the responsiveness of demand to changes in factors like price and income. Types of elasticity include price, income, and cross elasticity. Demand can be perfectly elastic,
10 Reasons To Attend The Content Marketing Workshoptrish321
This document advertises a two-day Constant Cash with Content Marketing (CCCM) workshop happening on October 25-26, 2013 at the Philippine Trade Training Center. The workshop will teach attendees how to create valuable content once and reuse it for multiple purposes, attract customers and build trust through social media and content marketing, create their own agency using advanced social media skills, and transform themselves into a valuable professional through the workshop. Attendees will receive a complete set of e-presentations and can meet like-minded participants.
The document discusses different ways of representing numerical data in assembly language programming. It explains that numbers are generally represented in binary format for arithmetic operations but displayed in ASCII format for human readability. It then describes four methods for processing numerical data: ASCII representation which stores numbers as ASCII characters; unpacked BCD representation which stores each decimal digit in a byte; packed BCD representation which stores two digits in a byte; and binary representation for direct arithmetic operations. It provides examples of how to convert between these representations and use specific instructions to perform addition and subtraction on ASCII and BCD formatted numbers.
El departamento de Cordillera se encuentra en el centro oeste de Paraguay. Su capital y ciudad más poblada es Caacupé, fundada en 1770. Cordillera contiene importantes sitios turísticos como el Lago Ypacarai y el Cerro Kavaju. El departamento alberga una rica diversidad ambiental, cultural y arquitectónica.
Argentina está dividida en 23 provincias y la ciudad autónoma de Buenos Aires, que es la capital federal. Tiene una población de 40 millones de personas y el fútbol es muy importante culturalmente, con figuras como Maradona y Messi. El tango también es una parte importante de la cultura argentina, originado en Buenos Aires. Las provincias, playas y paisajes variados lo convierten en un destino atractivo para visitar.
Este documento presenta una secuencia didáctica sobre la Edad Media dirigida a niños de 4-5 años. La secuencia se llevará a cabo durante el mes de marzo de 2014 y tiene como objetivo enseñar características básicas de la Edad Media como castillos, clases sociales, profesiones, alimentación, música e inventos de una manera lúdica. Se detallan los aprendizajes, objetivos y contenidos que se trabajarán en cada área así como la metodología, recursos y evaluación.
El documento explica la diferencia entre régimen y sistema político. Un régimen se refiere a las normas y leyes que rigen las relaciones entre una sociedad o países, mientras que un sistema político clasifica y estudia modelos de órdenes políticos similares. Luego describe que el régimen colombiano es un tipo de autoridad política ejercida por el país de forma independiente a los juicios de valor, mientras que su sistema político mezcla diversos aspectos tratando de tener un juicio de valor positivo y orden mediante comportamientos similares pero diferenciados.
El documento describe una clase en la Escuela Media Presidente Juan Domingo Perón donde la profesora Flavia Buffo guió a sus alumnos de 2do año en realizar actividades con TIC usando un documento PDF. Los estudiantes completaron las tareas de manera atenta y participativa usando Foxit Reader. Al final, guardaron su trabajo y lo pasaron al pendrive de la profesora. Los testimonios de los alumnos indicaron que les pareció más fácil y mejor hacer la clase con computadoras.
La vasija agrietada narra la historia de una cargadora de agua china que llevaba dos vasijas, una perfecta y otra con grietas. A pesar de que la vasija agrietada solo podía transportar la mitad del agua, la cargadora sembraba flores a lo largo del camino que regaba la vasija, por lo que ambas cumplían un propósito. La cargadora le explica a la vasija agrietada que gracias a sus defectos pudo crear belleza, enseñando que todos tenemos grietas pero podemos
Assessing the success of forest and landscape restoration efforts – What do g...Bioversity International
'Assessing the success of forest and landscape restoration efforts – What do genetic diversity indicators tell us?' highlights the importance of taking genetics into consideration when choosing tree seedlings for restoring degraded landscapes. Presented by Riina Jalonen, this presentation was part of ICRAF and partners'-organized Tree Diversity Day on the side lines of CBD COP12 in Korea, 2014.
Windows Phone applications can be built using the Windows Azure platform and Visual Studio 2010. Developers can leverage cloud services like storage, SQL databases and more to add capabilities beyond what's possible using only local phone resources. The combination of phone and cloud development allows for powerful mobile apps with scalable backend services.
The Excel Benchmarking Report provides a free 30-minute online Excel test for all staff in a firm to assess their Excel IQ scores and skills. Managers then receive a comprehensive analysis showing Excel proficiency levels by individual staff, positions, training received, experience and other metrics. The report concludes with training recommendations to help improve Excel skills across the organization. Firms can request a sample report and quote to benchmark their staff's Excel abilities.
The People for Social Responsibility in Bangladesh (PSRB) aims to unite professionals to contribute their expertise towards social development in Bangladesh. PSRB will link professional groups like doctors, engineers, teachers, and students to utilize their skills and create community support. The organization seeks to ensure peoples' rights to justice, education, health, and economic opportunities. It also aims to develop motivated future generations committed to Bangladesh's true development. PSRB will engage professionals and students in community service, provide training, and arrange student volunteer activities to build the next generation's leadership skills.
Tecnologie e Startup: ICT è solo una commodity? - Matteo Valoriani - Codemoti...Codemotion
Questa sessione vuole affrontare il tema della tecnologia e come questa possa essere una leva fondamentale per le nuove Startup. Nella prima parte saranno discussi i maggiori trend di mercato: le tecnologie più in voga e ricercate, quelle già mature e consolidate e quelle che sono in fase calante ma che avranno un alto impatto in futuro. Nella seconda parte mostrerò alcuni tool e tecniche che possono migliorare la gestione del lavoro di una start-up introducendo meccanismi di sviluppo agili.
Uni.sherbrooke 2015 créez la meilleur application grâce à gwt, gwtp et j...Arcbees
MEILLEURES PRATIQUES
DE DÉVELOPPEMENT
GR CE À GWT, GWTP ET JUKITO
Conference by Christian Goudreau et Christopher Viel
au Département Génie Informatique de l'université de Sherbrooke.
Christopher Viel is Software Engineer at Arcbees.
You can follow Christian on Google+ :+ChristopherVielArcbees
Christian Goudreau is BEE-EO AND CO-FOUNDER
at Arcbees.
You can follow Christian on Twitter : @imchrisgoudreau
Christian Goudreau, ArcBees’ CEO, is a self-made entrepreneur with significant experience in project management. Christian has been managing major software development projects since his early teens, and therefore has quickly learned how to juggle heavy responsibilities and deliver.
A talented guest speaker, recognized expert in software architecture and developer tools, his services are much sought-after, not only in Quebec but also in Europe and the United States, where he takes great pleasure in sharing his technical knowledge and his passion for business.
Christian Goudreau was named Young Business Person of the Year, technology & research division, at the Jeune personnalité d’affaires Banque Nationale competition organized by the Jeune chambre de commerce de Québec (JCCQ), in 2012. He was also awarded the Creativity and Innovation Prize, and the Grand Prize at the 2013 Annual LOJIQ awards (the Quebec International Youth Offices).
This document discusses concepts related to microeconomics including the laws of supply and demand, market price determination, and the role of government in prices. It defines demand and supply, outlines factors that shift demand and supply curves like income, prices of substitutes/complements, and technology. It explains how equilibrium price is determined by the intersection of supply and demand and how prices change when these curves shift due to changes in the factors above. In 3 sentences: The document covers microeconomic concepts like supply and demand, factors that shift the curves, and how equilibrium price is determined by the intersection of supply and demand. It also discusses how prices change when demand or supply shifts due to things like income, input costs, or government policies.
This document defines key terms related to elasticity of demand and supply such as price elasticity, arc elasticity, point elasticity, income elasticity of demand, cross elasticity of demand, and more. It provides examples of how to calculate price elasticity using data points on a demand curve. It also discusses how elasticity affects total revenue and the impacts of price changes on producers and consumers depending on whether demand is elastic, inelastic, or unitary elastic.
Demand refers to how much of a good or service consumers are willing and able to purchase at different price levels. Quantity demanded is the total amount consumers want to buy at a given price. Market demand is the sum of all individual demands. Demand curves slope downward, showing an inverse relationship between price and quantity demanded. Supply refers to how much producers are willing to sell at different prices. Quantity supplied is the total amount producers want to sell at a given price. Market supply curves slope upward, showing a direct relationship between price and quantity supplied. Equilibrium occurs where quantity demanded equals quantity supplied, establishing the market price.
The document discusses various concepts related to demand including:
1. Demand is the quantity of a good or service that consumers are willing and able to buy at a given price in a given time period. Effective demand is backed by an ability to pay, while latent demand exists without purchasing power.
2. Derived demand is demand for a product that is linked to demand for a related product. For example, steel demand is derived from vehicle demand.
3. Elasticity of demand measures the responsiveness of quantity demanded to changes in price, income, or the price of a related good. Price elasticity is defined as the percentage change in quantity divided by the percentage change in price.
4. The daily energy demand
Chapter Two ppt.pdf managerial economicshamdiabdrhman
The document discusses the concept of demand in economics. It defines demand and explains the key factors that determine demand, including price, income, tastes, and expectations about future prices. It also describes the law of demand, which states that quantity demanded is inversely related to price, assuming all other factors remain constant. The document outlines different types of demand curves and schedules, and exceptions to the basic law of demand under certain market conditions.
This document discusses key concepts related to demand and elasticity. It defines demand, types of demand, individual and market demand, and determinants of demand. It also covers the demand curve and function, law of demand, demand schedule and exceptions. For elasticity, it defines price, income, and cross elasticity. It discusses types of price elasticity including perfectly elastic/inelastic and unit elastic demand. Finally, it covers methods for measuring price elasticity including total outlay, proportional, and point methods.
The document discusses demand analysis and forecasting. It defines demand and outlines the key determinants and types of demand, including price demand, income demand, and cross demand. It also explains the law of demand and its assumptions. Methods of measuring price elasticity of demand are described, including the total expenditure method, point method, and arc method. The significance and levels of demand forecasting are discussed. The main methods of demand forecasting are the survey method, including expert opinion surveys and consumer interviews, and statistical methods.
This document defines key concepts in microeconomics related to demand and supply, including elasticities. It explains the laws of demand and supply, and how non-price factors can cause shifts in demand and supply curves. It also defines different types of elasticities including price elasticity of demand, cross elasticity of demand, income elasticity of demand, and price elasticity of supply. Examples are provided to illustrate these concepts.
This document discusses the concept of demand, including:
- Demand refers to a desire backed by ability and willingness to pay for a commodity.
- The law of demand states that, other things remaining the same, demand increases when price falls and decreases when price rises.
- Demand schedules and curves illustrate the relationship between price and quantity demanded. Individual demand curves combine to form the market demand curve.
- Factors like income, tastes, prices of related goods, and population can cause changes in demand. Exceptions to the law of demand include Giffen goods, habits/addictions, and essential goods.
- Price elasticity of demand measures the responsiveness of quantity demanded to
When disasters strike, markets can help allocate scarce resources through price signals. Prices rise in response to supply shocks and consumption shocks to ration goods. Higher prices encourage conservation and signal producers to increase supply. Case studies of hurricanes Katrina and Rita found gasoline production declined in affected areas but increased elsewhere as prices rose, avoiding shortages. However, price controls intended to help consumers can cause shortages and inefficient allocation. Markets best address scarcity through decentralized price adjustments.
1. The document discusses the fundamentals of demand and supply, including defining demand with a demand curve, the determinants of demand, and the difference between a shift in demand versus movement along a demand curve.
2. It explains that a demand curve slopes downward due to the law of demand and the law of diminishing marginal utility - as price increases, quantity demanded decreases.
3. The main determinants of demand are price of the good, income, tastes, prices of substitutes and complements, and expectations about future prices and income. A change in a determinant causes the demand curve to shift, while a change in price results in movement along the
The document discusses key concepts in microeconomics including demand, the law of demand, demand schedules, demand curves, determinants of demand, elasticity of demand, and how to measure elasticity. Specifically, it defines demand as the quantity of a good consumers are willing and able to purchase at various prices in a given time period. It explains that the law of demand states that as price increases, quantity demanded decreases, and vice versa. Demand schedules and curves illustrate the relationship between price and quantity demanded. Factors like income, tastes, prices of related goods, and expectations can cause shifts in the demand curve. Elasticity refers to the responsiveness of quantity demanded to price changes, and can be elastic, inelastic,
The document discusses why demand curves slope downward. It provides four reasons: 1) the income effect, as lower prices increase purchasing power and demand, 2) the substitution effect, as consumers substitute cheaper goods, 3) new consumers can now afford the good at lower prices, and 4) alternative uses of goods increase as prices fall. Equilibrium in markets occurs where the supply and demand curves intersect, establishing an equilibrium price and quantity.
This document discusses various concepts related to elasticity, including:
- Price elasticity of demand measures how quantity demanded responds to price changes. Demand can be elastic, inelastic, or unit elastic.
- Price elasticity of supply measures how quantity supplied responds to price changes over different time periods.
- Income elasticity of demand indicates whether a good is a necessity, luxury, or inferior based on how demand responds to income changes.
- Cross price elasticity measures how demand for one good responds to price changes in another good if they are substitutes or complements.
This document provides an overview of demand and supply analysis concepts including:
- Definitions of key terms like market, demand, individual vs market demand, determinants of demand, demand curves, law of demand, supply, determinants of supply, law of supply, and market equilibrium.
- Descriptions of different types of demand like organization vs industry demand, autonomous vs derived demand, short-term vs long-term demand.
- Explanations of concepts like demand schedules, demand functions, exceptions to the law of demand, law of diminishing marginal utility, and demand curves.
- Discussions of elasticity including definitions of price elasticity, income elasticity, cross elasticity, and promotional
This document provides an overview of supply and demand concepts including:
- Demand is determined by consumers' willingness and ability to purchase goods at different price levels, while supply is determined by producers' willingness to provide goods at different price levels.
- The law of demand states that as price increases, quantity demanded decreases, while the law of supply states that as price increases, quantity supplied also increases.
- Demand and supply curves graphically represent these relationships, with demand curves sloping downward and supply curves sloping upward.
- Factors like income, population, tastes, prices of substitutes and complements can cause demand to shift, while costs of production and technology can cause supply shifts.
The document discusses demand theory, subsidies, and India's energy sector. It explains demand theory, including the demand curve and factors that influence demand elasticity. It then discusses the concept of subsidies, their types and rationale, as well as their advantages and disadvantages. Specifically regarding India, it outlines the trends in central government subsidies from 1994-1995 and classifications of subsidies. It also discusses explicit central government subsidies like food and fertilizer subsidies.
This document discusses demand theory, the demand curve, elasticity of demand, and energy subsidies from both national and international perspectives. It explains that demand theory relates consumer demand for goods to their prices in the market. The demand curve shows the inverse relationship between quantity demanded and price. Elasticity of demand measures the responsiveness of quantity demanded to price changes. The document also outlines the objectives, advantages, and disadvantages of subsidies and their effects on markets.
Slide 1 1mm - the basic economic problemmattbentley34
The basic economic problem is that human wants are unlimited while resources are scarce. This means that societies must make choices about how to allocate scarce resources between alternative uses to best satisfy people's needs and wants. The opportunity cost of a choice is the value of the best alternative forgone, or what is given up by making that choice. Production possibility curves illustrate this problem by showing the tradeoffs involved - producing more of one good requires producing less of another since resources are limited.
This document introduces economics as a social science that studies human behavior in markets at both micro and macro levels. It then lists several current economic issues and prompts the reader to discuss the reasons for each issue and potential solutions in small groups. Some of the issues highlighted include the wealth divide, the effects of Brexit, policies to curb plastic pollution, and the future of work with artificial intelligence. The document encourages further discussion and learning about economics topics.
1. Altruism refers to humans behaving with more kindness and fairness than would be expected if they acted rationally according to self-interest.
2. Anchoring is the tendency for people to rely on irrelevant reference points or anchors when making estimates.
3. Bounded rationality recognizes the cognitive limits of humans in making fully rational decisions due to limits in information, time, and brain processing capacity.
This document provides a list of 14 online resources for learning about behavioral economics and conducting experiments. Some of the key resources mentioned include Dan Ariely's website which has video explanations of concepts and research; the Invisible Gorilla team's videos demonstrating bounded rationality; interactive experiments on the Online Psychology Laboratory website; and videos from the Behavioural Design Lab. Overall, the document serves as a guide to various online materials for studying behavioral economics concepts.
This document introduces concepts from behavioural economics, which challenges the assumption that people always make rational decisions. It discusses how social, emotional, and cognitive factors can influence choices. People have bounded rationality and use mental shortcuts like heuristics. Choices are affected by defaults, framing, norms, and biases. Behavioural economics aims to "nudge" better choices through approaches like changing defaults or using social norms, rather than mandates. However, some argue that nudges could be seen as paternalistic or that consumers are not as irrational as behavioral economics assumes.
1. ArcelorMittal, the world's largest steelmaker, made a bid to acquire Macarthur Coal in Australia in October 2011. This was likely motivated by the desire to achieve the benefits of backwards vertical integration, as ArcelorMittal uses large quantities of coal in its steel production process.
2. Sally owns a potato farm and aims to maximize profit. As she believes the market price of potatoes will not be affected by her farm's output level, she will produce at the level where marginal cost equals price in the short run to maximize profit.
3. Sally believes her individual output will not impact the overall market price. Therefore, she will produce the quantity where marginal cost equals price to
- Starbucks has had success in China but has faced criticism for high prices. It has adopted a localization strategy including store designs that reflect local culture and adding popular local flavors.
- Spotify dominates the music streaming market but faces challenges from competitors differentiating their offerings and royalty costs reducing profits despite rising revenues.
- Nissan faces uncertainty from Brexit but has cut European prices for its electric Leaf model. A UK consumer could save over £1,000 buying from France due to the weak pound.
This document summarizes factors that influence wage determination in labor markets, including supply and demand, trade unions, government intervention, and discrimination. Key points include:
- Supply and demand are primary determinants of wages, with wages rising or falling based on labor demand changes.
- Economic rent and transfer earnings also impact wages. Workers earn more economic rent the more inelastic the labor supply.
- Trade unions aim to increase member wages through collective bargaining, creating a new higher minimum supply curve. This raises wages but reduces employment.
- Government policies like minimum wage legislation and anti-discrimination laws also impact wages.
- Discrimination against groups lowers their wages below true market rates due to prejudices about their productivity
Justin King became CEO of UK retailer J Sainsbury plc in 2004 when sales and market share were falling. He implemented a strategy of recovery through sales growth including price cuts, organizational restructuring, and bonuses for higher store standards. King also focused on increasing employee engagement to improve customer service and financial performance. Following King's changes, Sainsbury's experienced 36 consecutive months of sales growth from 2010 to 2013 and increased its market share. However, in 2014 King announced he was stepping down as CEO and soon after Sainsbury's reported its first sales decline in 9 years due to continued competition.
This document provides a template for planning answers to AQA A Level Business exam questions. The template includes spaces to write the question, marks available, and multiple paragraphs to structure an answer with context, evidence, models, theory and reasoning. Each paragraph includes prompts to include an explanation of a point and opportunities to include evaluation.
The multiplier effect occurs when an initial injection of spending, such as government spending on a new infrastructure project, leads to a greater total increase in real GDP through multiple rounds of spending. The size of the multiplier effect depends on factors like the marginal propensity to consume, marginal propensity to save, marginal propensity to import, and how elastic the aggregate supply is. A higher propensity to consume and a lower propensity to save and import leads to a larger multiplier. The multiplier is calculated as 1 divided by the sum of the marginal propensities.
Nationalism and racialism are often confused concepts. Nationalism refers to a shared cultural identity among a group of people, such as a common language, religion, or traditions. In contrast, racialism asserts that humanity is divided into distinct biological groups with inherent differences. While nationalism can take liberal forms that promote self-determination and international harmony, it can also be expressed chauvinistically by asserting the superiority of one nation over others. Racialism inherently claims racial segregation and superiority. However, the concepts can overlap, such as in certain expressions of aggressive nationalism. Overall, nationalism encompasses a spectrum of doctrines from the progressive to the reactionary.
This document provides exam advice for the Edexcel A Level Economics exam. It outlines the structure and timing of Papers 1-3 and the types of questions that may be asked. For each section and question type, it offers strategies and techniques for answering questions successfully, such as using diagrams, chains of analysis, and considering different perspectives in evaluations. Students are advised to read questions carefully, show workings, use economic terminology, and relate their answers back to the questions.
The document appears to be missing content and only contains the heading "Conclusions;" without any conclusions stated. Based on the limited information, this document does not provide any summarizable content in 3 sentences or less.
Nationalism and racialism are often confused concepts. Nationalism refers to a shared cultural identity among a group of people, such as a common language, religion, or traditions. In contrast, racialism asserts that humanity is divided into distinct biological groups with inherent differences. While nationalism can take liberal forms that promote self-determination and international harmony, it can also be expressed chauvinistically by asserting the superiority of one nation over others. Racialism inherently claims racial segregation and superiority. However, the concepts can overlap, such as in certain expressions of aggressive nationalism. Overall, nationalism encompasses a spectrum of doctrines from the progressive to the reactionary.
This document discusses different voting systems used in elections, including first-past-the-post, supplementary vote, additional vote, and single transferable vote systems. First-past-the-post is used for UK House of Commons elections, where voters select one candidate and the candidate with the most votes wins. Proportional representation systems aim to allocate seats proportionally based on votes. The supplementary vote and additional vote systems allow voters to rank candidates, while single transferable vote uses multi-member constituencies and transfers votes from eliminated candidates.
This document provides an overview of key concepts related to political representation and democracy in the UK. It defines democracy, explaining that modern democracies are generally representative rather than direct, with citizens electing representatives to make decisions on their behalf. It discusses the role of manifestos in outlining party policies, and the concept of mandates for the party that wins a majority of seats. Referendums are described as a way to directly consult citizens on important issues. Finally, it outlines the different levels of government in the UK, from local to national to European Union levels.
This document discusses political participation in the UK. It outlines different forms of political participation such as voting, joining political parties, and participating in demonstrations. Younger people are more likely to engage in newer forms of participation like pressure groups, while older individuals typically participate through voting and party membership. Women are underrepresented among politicians but equally participate in other ways. Traditional participation through parties and unions has declined as issues are addressed more globally and new social and environmental movements have emerged.
This document discusses several major political ideologies including liberalism, conservatism, socialism, and others. It defines ideology as "an interrelated set of ideas that in some way guides or inspires political action." Liberalism focuses on individual freedom, equality of opportunity, and a limited government role, while conservatism emphasizes tradition, gradual change, and social order. Socialism promotes collectivism, equality, and opposition to capitalism. The document also examines post-ideological politics, where clear ideological differences are less apparent and single-issue groups are more common.
Leveraging Generative AI to Drive Nonprofit InnovationTechSoup
In this webinar, participants learned how to utilize Generative AI to streamline operations and elevate member engagement. Amazon Web Service experts provided a customer specific use cases and dived into low/no-code tools that are quick and easy to deploy through Amazon Web Service (AWS.)
Temple of Asclepius in Thrace. Excavation resultsKrassimira Luka
The temple and the sanctuary around were dedicated to Asklepios Zmidrenus. This name has been known since 1875 when an inscription dedicated to him was discovered in Rome. The inscription is dated in 227 AD and was left by soldiers originating from the city of Philippopolis (modern Plovdiv).
A Visual Guide to 1 Samuel | A Tale of Two HeartsSteve Thomason
These slides walk through the story of 1 Samuel. Samuel is the last judge of Israel. The people reject God and want a king. Saul is anointed as the first king, but he is not a good king. David, the shepherd boy is anointed and Saul is envious of him. David shows honor while Saul continues to self destruct.
Gender and Mental Health - Counselling and Family Therapy Applications and In...PsychoTech Services
A proprietary approach developed by bringing together the best of learning theories from Psychology, design principles from the world of visualization, and pedagogical methods from over a decade of training experience, that enables you to: Learn better, faster!
Chapter wise All Notes of First year Basic Civil Engineering.pptxDenish Jangid
Chapter wise All Notes of First year Basic Civil Engineering
Syllabus
Chapter-1
Introduction to objective, scope and outcome the subject
Chapter 2
Introduction: Scope and Specialization of Civil Engineering, Role of civil Engineer in Society, Impact of infrastructural development on economy of country.
Chapter 3
Surveying: Object Principles & Types of Surveying; Site Plans, Plans & Maps; Scales & Unit of different Measurements.
Linear Measurements: Instruments used. Linear Measurement by Tape, Ranging out Survey Lines and overcoming Obstructions; Measurements on sloping ground; Tape corrections, conventional symbols. Angular Measurements: Instruments used; Introduction to Compass Surveying, Bearings and Longitude & Latitude of a Line, Introduction to total station.
Levelling: Instrument used Object of levelling, Methods of levelling in brief, and Contour maps.
Chapter 4
Buildings: Selection of site for Buildings, Layout of Building Plan, Types of buildings, Plinth area, carpet area, floor space index, Introduction to building byelaws, concept of sun light & ventilation. Components of Buildings & their functions, Basic concept of R.C.C., Introduction to types of foundation
Chapter 5
Transportation: Introduction to Transportation Engineering; Traffic and Road Safety: Types and Characteristics of Various Modes of Transportation; Various Road Traffic Signs, Causes of Accidents and Road Safety Measures.
Chapter 6
Environmental Engineering: Environmental Pollution, Environmental Acts and Regulations, Functional Concepts of Ecology, Basics of Species, Biodiversity, Ecosystem, Hydrological Cycle; Chemical Cycles: Carbon, Nitrogen & Phosphorus; Energy Flow in Ecosystems.
Water Pollution: Water Quality standards, Introduction to Treatment & Disposal of Waste Water. Reuse and Saving of Water, Rain Water Harvesting. Solid Waste Management: Classification of Solid Waste, Collection, Transportation and Disposal of Solid. Recycling of Solid Waste: Energy Recovery, Sanitary Landfill, On-Site Sanitation. Air & Noise Pollution: Primary and Secondary air pollutants, Harmful effects of Air Pollution, Control of Air Pollution. . Noise Pollution Harmful Effects of noise pollution, control of noise pollution, Global warming & Climate Change, Ozone depletion, Greenhouse effect
Text Books:
1. Palancharmy, Basic Civil Engineering, McGraw Hill publishers.
2. Satheesh Gopi, Basic Civil Engineering, Pearson Publishers.
3. Ketki Rangwala Dalal, Essentials of Civil Engineering, Charotar Publishing House.
4. BCP, Surveying volume 1
Philippine Edukasyong Pantahanan at Pangkabuhayan (EPP) CurriculumMJDuyan
(𝐓𝐋𝐄 𝟏𝟎𝟎) (𝐋𝐞𝐬𝐬𝐨𝐧 𝟏)-𝐏𝐫𝐞𝐥𝐢𝐦𝐬
𝐃𝐢𝐬𝐜𝐮𝐬𝐬 𝐭𝐡𝐞 𝐄𝐏𝐏 𝐂𝐮𝐫𝐫𝐢𝐜𝐮𝐥𝐮𝐦 𝐢𝐧 𝐭𝐡𝐞 𝐏𝐡𝐢𝐥𝐢𝐩𝐩𝐢𝐧𝐞𝐬:
- Understand the goals and objectives of the Edukasyong Pantahanan at Pangkabuhayan (EPP) curriculum, recognizing its importance in fostering practical life skills and values among students. Students will also be able to identify the key components and subjects covered, such as agriculture, home economics, industrial arts, and information and communication technology.
𝐄𝐱𝐩𝐥𝐚𝐢𝐧 𝐭𝐡𝐞 𝐍𝐚𝐭𝐮𝐫𝐞 𝐚𝐧𝐝 𝐒𝐜𝐨𝐩𝐞 𝐨𝐟 𝐚𝐧 𝐄𝐧𝐭𝐫𝐞𝐩𝐫𝐞𝐧𝐞𝐮𝐫:
-Define entrepreneurship, distinguishing it from general business activities by emphasizing its focus on innovation, risk-taking, and value creation. Students will describe the characteristics and traits of successful entrepreneurs, including their roles and responsibilities, and discuss the broader economic and social impacts of entrepreneurial activities on both local and global scales.
This document provides an overview of wound healing, its functions, stages, mechanisms, factors affecting it, and complications.
A wound is a break in the integrity of the skin or tissues, which may be associated with disruption of the structure and function.
Healing is the body’s response to injury in an attempt to restore normal structure and functions.
Healing can occur in two ways: Regeneration and Repair
There are 4 phases of wound healing: hemostasis, inflammation, proliferation, and remodeling. This document also describes the mechanism of wound healing. Factors that affect healing include infection, uncontrolled diabetes, poor nutrition, age, anemia, the presence of foreign bodies, etc.
Complications of wound healing like infection, hyperpigmentation of scar, contractures, and keloid formation.
2. Demand
for
Goods
and
Services
• Defini8on
of
demand:
• Demand
for
a
good
or
service
is
the
quan:ty
that
purchasers
are
willing
and
able
to
buy
at
a
given
price
in
a
given
period
of
:me.
• Effec8ve
demand:
• Only
if
demand
for
a
product
is
backed
up
by
a
willingness
and
ability
to
pay
the
market
price
does
demand
becomes
effec:ve
or
realized
or
actual.
• The
basic
law
of
demand
is
that
demand
varies
inversely
with
price
–
lower
prices
make
products
more
affordable
for
consumers.
Effec:ve
demand
is
backed
up
with
an
ability
to
pay
Poten:al
(latent)
demand
is
not
yet
expressed
in
the
market
3. The
Demand
Curve:
Price
&
Quan8ty
Demanded
Price
of
Coffee
Quan:ty
demanded
of
coffee
Demand
for
Coffee
P1
Q1
P2
Q2
P3
Q3
A
higher
price
leads
to
a
contrac8on
of
quan:ty
demanded
A
lower
price
leads
to
an
expansion
of
quan:ty
demanded
Only
changes
in
market
price
cause
a
movement
along
the
demand
curve
4. Income
and
Subs8tu8on
Effects
of
a
Price
Change
Income
effect
• A
fall
in
price
increases
the
real
purchasing
power
of
consumers
• This
allows
people
to
buy
more
with
a
given
budget
• For
normal
goods,
demand
rises
with
an
increase
in
real
income
Subs:tu:on
effect
• A
fall
in
the
price
of
good
X
makes
it
rela:vely
cheaper
compared
to
subs:tutes
• Some
consumers
will
switch
to
good
X
leading
to
higher
demand
• Much
depends
on
whether
products
are
close
subs:tutes
5. Causes
of
ShiHs
in
the
Demand
Curve
1. Changing
prices
of
a
subs8tute
goods
or
services
in
compe88ve
demand
2. Changing
price
of
a
complements
–
i.e.
products
in
joint
demand
3. Changes
in
the
real
income
of
consumers
– When
real
income
goes
up,
our
ability
to
purchase
goods
and
services
increases,
and
this
causes
an
outward
shiT
in
the
demand
curve.
– But
when
incomes
fall
there
will
be
a
decrease
in
demand,
except
for
inferior
goods
4. Changes
in
the
distribu:on
of
income
-‐
a
more
equal
distribu:on
of
income
can
increase
total
demand
because
rela:vely
poorer
consumers
spend
a
higher
propor:on
of
their
income
5. The
effects
of
adver8sing
and
marke8ng
6. Interest
rates
and
demand
(e.g.
affec:ng
the
cost
of
credit)
7. Changes
in
the
size
and
age
structure
of
a
popula8on
8. Seasonal
factors
for
some
goods
and
services
9. Social
and
emo8onal
factors
6. The
Concept
of
U8lity
• U:lity
is
a
measure
of
the
sa:sfac:on
that
we
get
from
purchasing
and
consuming
a
good
or
service
• Total
u:lity:
– The
total
sa:sfac:on
from
a
given
level
of
consump:on
• Marginal
u:lity
– The
change
in
sa:sfac:on
from
consuming
an
extra
unit
• Standard
economic
theory
believes
in
the
idea
of
diminishing
returns
i.e.
the
marginal
u:lity
of
extra
units
declines
as
more
is
consumed
U:lity
is
a
measure
of
sa:sfac:on
Does
the
u:lity
we
get
affect
our
willingness
to
pay?
7. Diminishing
Marginal
U8lity
and
Demand
Curve
• Marginal
u:lity
is
the
change
in
total
sa:sfac:on
from
consuming
an
extra
unit
of
a
good
or
service
• Beyond
a
certain
point,
marginal
u:lity
may
start
to
fall
(diminish)
• In
our
example,
this
happens
with
the
4th
unit
where
MU
falls
to
12
• The
8th
unit
carries
zero
marginal
u:lity
i.e.
total
u:lity
stays
the
same
• If
marginal
u:lity
is
falling,
then
consumers
will
only
be
prepared
to
pay
a
lower
price
• This
helps
to
explain
the
downward
sloping
demand
curve
Quan8ty
Consumed
Total
U8lity
(TU)
Marginal
U8lity
(MU)
1
10
10
2
24
14
3
40
16
4
52
12
5
61
9
6
68
7
7
72
4
8
72
0
8. The
Paradox
of
Value
• The
Paradox
of
Value
is
also
known
as
the
diamond-‐water
paradox
• We
understand
that
water
is
necessary
to
sustain
life
and
that
ornaments
such
as
diamonds
are
just
that
–
certainly
life
sustaining.
• But
water
typically
has
a
low
price,
while
a
piece
of
diamond
jewelry
has
a
a
high
market
price.
• One
reason
–
water
is
abundant
rela:ve
to
demand
whereas
diamonds
are
scarce
rela:ve
to
demand
• Value
in
use
i.e.
drinking
water
to
sa:sfy
your
thirst
• Value
in
exchange
–
what
a
resource
can
be
sold
for
in
exchange
for
other
products.
Nothing
is
more
useful
than
water:
but
it
will
purchase
scarce
any
thing.
The
reverse
is
usually
true
for
expensive
jewelry
Cheap
water
Expensive
jewelry
9. Seasonal
Demand
for
Goods
and
Services
• Seasonality
refers
to
fluctua:ons
in
output
and
sales
related
to
the
seasonal
of
the
year.
• For
most
products
there
will
be
seasonal
peaks
and
troughs
in
produc:on
and/or
sales
• Demand
for
slippers
peaks
in
the
run
up
to
Christmas
• Demand
for
plants
at
garden
centres
is
linked
to
the
plan:ng
season
• There
is
high
demand
for
decora:ng
materials
before
the
Easter
weekend
• High
street
retailers
such
as
jewellry
companies
may
sell
as
much
as
80-‐90%
of
their
products
over
Xmas
• Theatres
take
a
high
%
of
their
income
during
pantomime
season
Easter
chocolate
Summer
fruits
Winter
clothing
Ski
season
products
Some
examples
of
seasonal
demand
10. Seasonal
and
Non-‐Seasonal
Demand
for
Confec8onery
5,219
5,243
5,353
5,375
5,136
580
563
583
612
669
0
1000
2000
3000
4000
5000
6000
7000
12
months
ending
2
October
2011
12
months
ending
1
October
2012
12
months
ending
29
September
2013
12
month
ending
29
December
2013
12
month
ending
28
December
2014
Sales
value
in
million
euros
Non-‐seasonal
confec:onery
Seasonal
confec:onery
Just
over
one
tenth
of
total
spending
on
confec:onery
in
the
UK
is
es:mated
to
be
seasonal
spending
e.g.
at
Easter
and
at
Christmas.
11. Seasonal
Demand:
Occupancy
Rate
of
Hotels
in
USA
The
occupancy
rate
of
hotels
follows
a
season
pajern
reaching
a
peak
during
the
summer
months.
At
off-‐peak
:mes,
the
occupancy
rate
can
decline
to
less
than
50%
i.e.
there
is
plenty
of
spare
capacity
40.0%
45.0%
50.0%
55.0%
60.0%
65.0%
70.0%
75.0%
80.0%
Jan
Feb
March
April
May
June
July
Aug
Sep
Oct
Nov
Dec
Occupancy
rate
(per
cent)
2011
2012
2013
2014
2015
12. Networks
and
Demand
Choices
Increasingly
in
the
digital
economy,
the
choices
made
by
consumers
are
influenced
by
the
decisions
of
others.
A
good
example
is
the
decision
about
which
messenger
app
to
use.
800
700
549
300
249
211
200
91
48
0
100
200
300
400
500
600
700
800
900
WhatsApp
Facebook
Messenger
WeChat
Skype*
Viber*
LINE
Kik*
BlackBerry
Messenger
KakaoTalk
Monthly
ac:ve
users
in
millions
*
July
2015
data
13. Derived
Demand
• Derived
demand
is
the
demand
for
a
factor
of
produc8on
used
to
produce
another
good
or
service
• Steel:
The
demand
for
steel
is
strongly
linked
to
the
market
demand
for
cars
and
the
construc:on
of
new
buildings.
• Wood:
Wood
is
a
product
where
much
of
the
demand
comes
from
the
uses
to
which
it
can
be
put.
– The
end
use
of
wood
in
the
UK
is:
Construc:on:
60%,
Furniture:
15%,
Packaging:
15%,
Fencing:
7%,
Other:
3%
• Labour:
In
factor
markets,
the
demand
for
labour
is
derived
• Transport:
An
increase
in
the
demand
for
air
travel
will
lead
to
a
rise
in
the
demand
for
airplane
pilots.
The
idea
of
derived
demand
is
important
to
use
when
discussing
inter-‐
rela:onships
between
markets.
Many
ques:ons
consider
two
or
more
markets.
14. Composite
Demand
• Composite
demand
exists
where
goods
have
more
than
one
use
-‐
an
increase
in
the
demand
for
one
product
leads
to
a
fall
in
supply
of
the
other
• An
example
is
milk
which
can
be
used
for
cheese,
yoghurts,
cream,
bujer
and
other
products
including
fer:lizer!
• Another
example
is
land
–
e.g.
farmland
can
be
developed
in
many
different
ways,
urban
land
has
different
uses
etc.
• Oil
is
used
in
many
different
industries
such
as
plas:cs.
Bujer
Yoghurt
Milk
Chocolate
Cheese
Unprocessed
milk
has
many
final
uses
15. Illustra8ng
ShiHs
in
the
Demand
Curve
Price
of
Coffee
Quan:ty
demanded
of
coffee
D1
P1
Q1
Q2
D2
D3
Q3
D1
to
D3
is
an
inward
shiH
of
demand
–
less
is
demanded
at
each
market
price
D1
to
D2
is
an
outward
shiH
of
demand
–
more
is
demanded
at
each
market
price
Changes
in
price
do
not
cause
shiTs
in
the
demand
curve
for
a
product
16. Consump8on
of
sports
and
energy
drinks
in
UK
5.7
6.5
8.6
9
10
11.2
11.3
11.8
12.1
0
2
4
6
8
10
12
14
2006
2007
2008
2009
2010
2011
2012
2013
2014
Average
consump:on
in
litres
per
person
Which
demand
factors
might
help
to
explain
the
rising
trend
of
consump:on
and
sports
and
energy
drinks
in
the
UK?
17. Market
Demand:
Global
Sales
of
Wearable
Devices
0
20
40
60
80
100
120
140
160
2013
2014
2015
Shipments
in
millions
Wearable
cameras
Smart
glasses
Smart
watches
Healthcare
Sports/ac:vity
trackers
Wearable
3D
mo:on
trackers
Smart
clothing
Global
market
demand
for
wearable
devices
is
soaring
–
to
what
extent
are
social
factors
more
important
than
factors
such
as
income?
18. The
Fall
and
Rise
of
Vinyl
Album
Sales
in
the
UK
In
2014,
over
1.2
million
vinyl
LPs
were
sold
in
the
UK,
up
from
just
205
thousand
sold
in
2007.
What
might
explain
this
rebound?
0
200000
400000
600000
800000
1000000
1200000
1400000
1600000
1995
1996
1997
1998
1999
2000
2001
2002
2003
2004
2005
2006
2007
2008
2009
2010
2011
2012
2013
2014
LPs
sold
19. Changing
Preferences
–
Movie
Consump8on
in
the
UK
0.0%
5.0%
10.0%
15.0%
20.0%
25.0%
30.0%
35.0%
40.0%
45.0%
Q3
2010
Q1
2011
Q3
2011
Q1
2012
Q3
2012
Q1
2013
Q3
2013
Q1
2014
Q3
2014
Q1
2015
Share
of
respondents
Bought
DVD/Blu-‐ray
Any
digital
Paid
official
digital
(DTO/VOD)
Unofficial
digital
(pirate)
The
pajern
of
demand
for
movies
is
changing!
Digital
sales
now
account
for
20%
of
sales
and
the
share
from
physical
sales
is
falling.