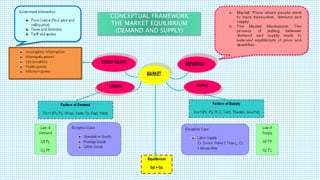
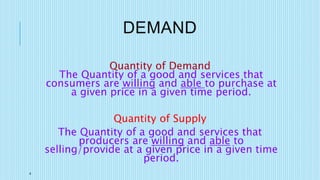
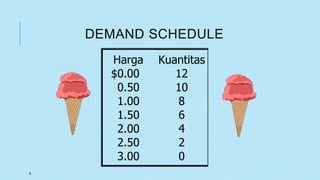
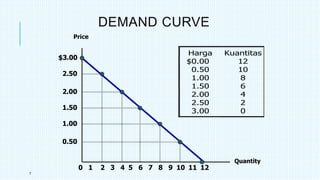
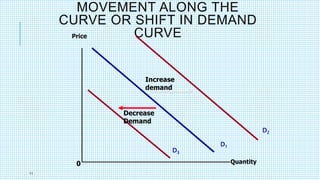
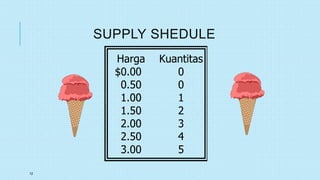
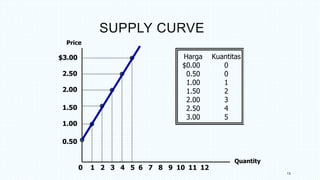
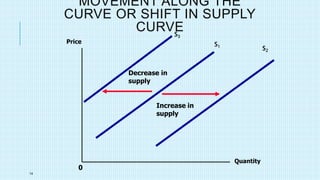
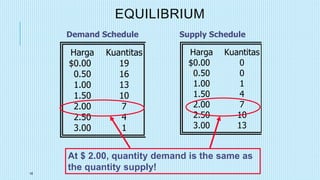
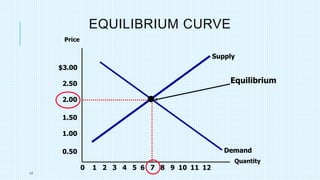
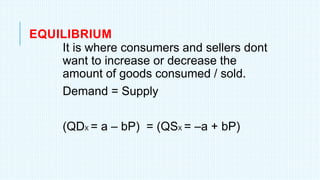
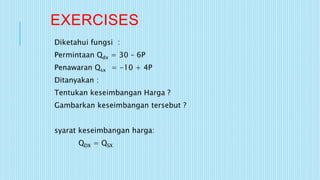
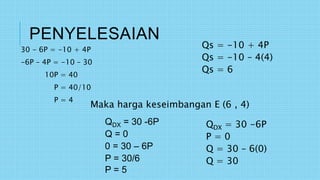
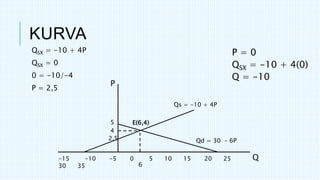
MICROECONOMICS
MARKET EQUILIBRIUM (DEMAND
AND SUPPLY)
Vadilla Mutia Zahara SE.,
ME
CONCEPTUAL FRAMEWORK
THE MARKET EQUILIBRIUM
(DEMAND AND SUPPLY)
MARKET
Market is where buyers and sellers come together to carry out an
economic transaction
4
DEMAND
Quantity of Demand
The Quantity of a good and services that
consumers are willing and able to purchase at
a given price in a given time period.
Quantity of Supply
The Quantity of a good and services that
producers are willing and able to
selling/provide at a given price in a given time
period.
THE LAW OF DEMAND
Simply states that “As a price
of a product falls, the
quantity demanded will
usually increase”. Ceteris
Paribus
6
DEMAND SCHEDULE
Harga Kuantitas
$0.00 12
0.50 10
1.00 8
1.50 6
2.00 4
2.50 2
3.00 0
7
DEMAND CURVE
$3.00
2.50
2.00
1.50
1.00
0.50
21 3 4 5 6 7 8 9 10 1211
Price
Quantity
0
Harga Kuantitas
$0.00 12
0.50 10
1.00 8
1.50 6
2.00 4
2.50 2
3.00 0
INCREASE IN DEMAND –
WHY?
Income Effect
When the price of a project falls, then people will have an increase in their “real”
income.
“real” income reflects the amount that their incomes will buy. With this increase,
the people are more likely to buy.
Example: I have 28 RMB budgeted for lunch. McD lunch is only 14 RMB so I buy 2
instead of 1 lunch.
Substitution Effect
When the price falls, then the product will be relatively more attractive to people
that other products (whose price hasn’t changed)
Example: I buy McD coffee each day for 10 RMB. Costa changes their price to 15
RMB so I stop going to McD and switch to Costa.
INCREASE IN DEMAND –
WHY?
Income
Normal Goods
For most goods, as income rises the demand for the product will also
rise.As income rises, the demand curve will shift to the right. Ex: Air
Travel
Inferior Goods
For inferior products, the demand for the product will fall as income
rises.This is because the consumer will start buying higher priced
items.The demand curve will shift to the left and eventually
disappear.Ex: cheap wine, “generic” soap
INCREASE IN DEMAND –
WHY?
Taste/Preferences
Other Factors A trend or advertising campaign may influence
demand.
For example: Increase in Hamster sales during the Chinese Year of
the Rat.
The size of the population
Changes in the age structure of the population
Changes in Income distribution
Government Policy changes
Seasonal Changes
11
MOVEMENT ALONG THE
CURVE OR SHIFT IN DEMAND
CURVE
0
D1
Price
Quantity
D3
D2
Increase
demand
Decrease
Demand
12
SUPPLY SHEDULE
Harga Kuantitas
$0.00 0
0.50 0
1.00 1
1.50 2
2.00 3
2.50 4
3.00 5
13
SUPPLY CURVE
$3.00
2.50
2.00
1.50
1.00
0.50
21 3 4 5 6 7 8 9 10 1211
Price
Quantity
0
Harga Kuantitas
$0.00 0
0.50 0
1.00 1
1.50 2
2.00 3
2.50 4
3.00 5
14
MOVEMENT ALONG THE
CURVE OR SHIFT IN SUPPLY
CURVE
Price
Quantity
0
S1
S2
S3
Increase in
supply
Decrease in
supply
15
DEMAND SUPPLY
EQUILIBRIUM
Equilibrium
It is Price and Quantity that balance supply and
demand
16
EQUILIBRIUM
Harga Kuantitas
$0.00 0
0.50 0
1.00 1
1.50 4
2.00 7
2.50 10
3.00 13
Harga Kuantitas
$0.00 19
0.50 16
1.00 13
1.50 10
2.00 7
2.50 4
3.00 1
Demand Schedule Supply Schedule
At $ 2.00, quantity demand is the same as
the quantity supply!
17
Supply
Demand
Price
Quantity
EQUILIBRIUM CURVE
21 3 4 5 6 7 8 9 10 12110
$3.00
2.50
2.00
1.50
1.00
0.50
Equilibrium
EQUILIBRIUM
It is where consumers and sellers dont
want to increase or decrease the
amount of goods consumed / sold.
Demand = Supply
(QDX = a – bP) = (QSX = –a + bP)
EXERCISES
Diketahui fungsi :
Permintaan Qdx = 30 – 6P
Penawaran Qsx = -10 + 4P
Ditanyakan :
Tentukan keseimbangan Harga ?
Gambarkan keseimbangan tersebut ?
syarat keseimbangan harga:
QDX = QSX
PENYELESAIAN
30 - 6P = -10 + 4P
-6P – 4P = -10 – 30
10P = 40
P = 40/10
P = 4
Qs = -10 + 4P
Qs = -10 – 4(4)
Qs = 6
Maka harga keseimbangan E (6 , 4)
QDX = 30 -6P
Q = 0
0 = 30 – 6P
P = 30/6
P = 5
QDX = 30 -6P
P = 0
Q = 30 – 6(0)
Q = 30
KURVA
QSX = -10 + 4P
QSX = 0
0 = -10/-4
P = 2,5
P = 0
QSX = -10 + 4(0)
Q = -10
-15 -10 -5 0 5 10 15 20 25
30 35
P
Q
2,5
5
4
6
Qs = -10 + 4P
Qd = 30 – 6P
E(6,4)

Market Equilibrium (Demand and Supply)

  • 1.
    MICROECONOMICS MARKET EQUILIBRIUM (DEMAND ANDSUPPLY) Vadilla Mutia Zahara SE., ME
  • 2.
    CONCEPTUAL FRAMEWORK THE MARKETEQUILIBRIUM (DEMAND AND SUPPLY)
  • 3.
    MARKET Market is wherebuyers and sellers come together to carry out an economic transaction
  • 4.
    4 DEMAND Quantity of Demand TheQuantity of a good and services that consumers are willing and able to purchase at a given price in a given time period. Quantity of Supply The Quantity of a good and services that producers are willing and able to selling/provide at a given price in a given time period.
  • 5.
    THE LAW OFDEMAND Simply states that “As a price of a product falls, the quantity demanded will usually increase”. Ceteris Paribus
  • 6.
    6 DEMAND SCHEDULE Harga Kuantitas $0.0012 0.50 10 1.00 8 1.50 6 2.00 4 2.50 2 3.00 0
  • 7.
    7 DEMAND CURVE $3.00 2.50 2.00 1.50 1.00 0.50 21 34 5 6 7 8 9 10 1211 Price Quantity 0 Harga Kuantitas $0.00 12 0.50 10 1.00 8 1.50 6 2.00 4 2.50 2 3.00 0
  • 8.
    INCREASE IN DEMAND– WHY? Income Effect When the price of a project falls, then people will have an increase in their “real” income. “real” income reflects the amount that their incomes will buy. With this increase, the people are more likely to buy. Example: I have 28 RMB budgeted for lunch. McD lunch is only 14 RMB so I buy 2 instead of 1 lunch. Substitution Effect When the price falls, then the product will be relatively more attractive to people that other products (whose price hasn’t changed) Example: I buy McD coffee each day for 10 RMB. Costa changes their price to 15 RMB so I stop going to McD and switch to Costa.
  • 9.
    INCREASE IN DEMAND– WHY? Income Normal Goods For most goods, as income rises the demand for the product will also rise.As income rises, the demand curve will shift to the right. Ex: Air Travel Inferior Goods For inferior products, the demand for the product will fall as income rises.This is because the consumer will start buying higher priced items.The demand curve will shift to the left and eventually disappear.Ex: cheap wine, “generic” soap
  • 10.
    INCREASE IN DEMAND– WHY? Taste/Preferences Other Factors A trend or advertising campaign may influence demand. For example: Increase in Hamster sales during the Chinese Year of the Rat. The size of the population Changes in the age structure of the population Changes in Income distribution Government Policy changes Seasonal Changes
  • 11.
    11 MOVEMENT ALONG THE CURVEOR SHIFT IN DEMAND CURVE 0 D1 Price Quantity D3 D2 Increase demand Decrease Demand
  • 12.
    12 SUPPLY SHEDULE Harga Kuantitas $0.000 0.50 0 1.00 1 1.50 2 2.00 3 2.50 4 3.00 5
  • 13.
    13 SUPPLY CURVE $3.00 2.50 2.00 1.50 1.00 0.50 21 34 5 6 7 8 9 10 1211 Price Quantity 0 Harga Kuantitas $0.00 0 0.50 0 1.00 1 1.50 2 2.00 3 2.50 4 3.00 5
  • 14.
    14 MOVEMENT ALONG THE CURVEOR SHIFT IN SUPPLY CURVE Price Quantity 0 S1 S2 S3 Increase in supply Decrease in supply
  • 15.
    15 DEMAND SUPPLY EQUILIBRIUM Equilibrium It isPrice and Quantity that balance supply and demand
  • 16.
    16 EQUILIBRIUM Harga Kuantitas $0.00 0 0.500 1.00 1 1.50 4 2.00 7 2.50 10 3.00 13 Harga Kuantitas $0.00 19 0.50 16 1.00 13 1.50 10 2.00 7 2.50 4 3.00 1 Demand Schedule Supply Schedule At $ 2.00, quantity demand is the same as the quantity supply!
  • 17.
    17 Supply Demand Price Quantity EQUILIBRIUM CURVE 21 34 5 6 7 8 9 10 12110 $3.00 2.50 2.00 1.50 1.00 0.50 Equilibrium
  • 18.
    EQUILIBRIUM It is whereconsumers and sellers dont want to increase or decrease the amount of goods consumed / sold. Demand = Supply (QDX = a – bP) = (QSX = –a + bP)
  • 19.
    EXERCISES Diketahui fungsi : PermintaanQdx = 30 – 6P Penawaran Qsx = -10 + 4P Ditanyakan : Tentukan keseimbangan Harga ? Gambarkan keseimbangan tersebut ? syarat keseimbangan harga: QDX = QSX
  • 20.
    PENYELESAIAN 30 - 6P= -10 + 4P -6P – 4P = -10 – 30 10P = 40 P = 40/10 P = 4 Qs = -10 + 4P Qs = -10 – 4(4) Qs = 6 Maka harga keseimbangan E (6 , 4) QDX = 30 -6P Q = 0 0 = 30 – 6P P = 30/6 P = 5 QDX = 30 -6P P = 0 Q = 30 – 6(0) Q = 30
  • 21.
    KURVA QSX = -10+ 4P QSX = 0 0 = -10/-4 P = 2,5 P = 0 QSX = -10 + 4(0) Q = -10 -15 -10 -5 0 5 10 15 20 25 30 35 P Q 2,5 5 4 6 Qs = -10 + 4P Qd = 30 – 6P E(6,4)