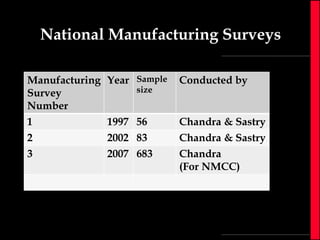
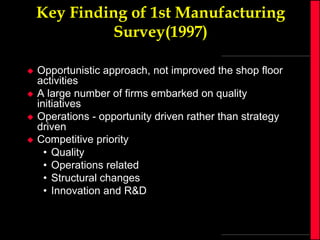
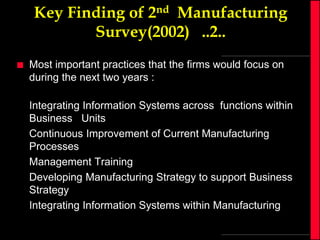
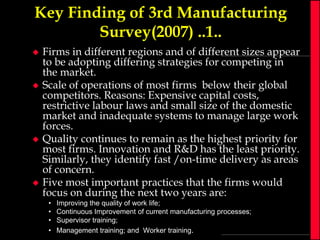
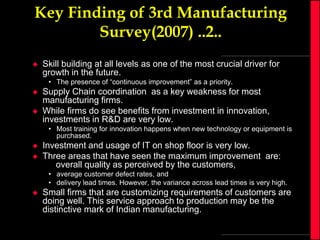
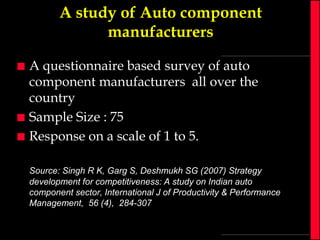
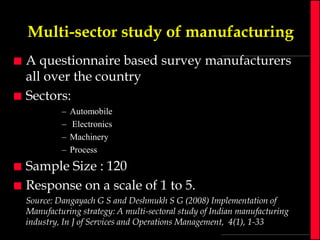
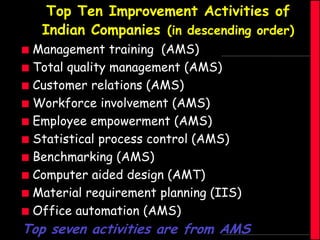
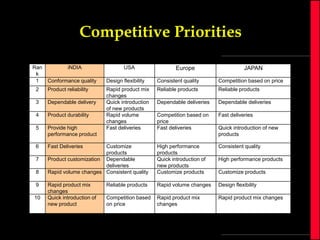
Manufacturing
Competitiveness:
Issues & Challenges
S G Deshmukh

ABV-Indian Institute of Information Technology &
Management
Gwalior

6 Nov 2009

25th National Convention of mechanical Engineers:
Challenges for Manufacturing in next decade
Speaking points..









Role of manufacturing
Two perspectives : Economic & System
Oriented
Competitiveness
Case of Auto component
Multi-sector study
Insights gained
Concluding remarks
Two Views
 Macroeconomic

View
 Operations Management View
An overview of Indian Economy
Economic Performance
o

Sustained economic growth
o Average last 10 years
o Forecast for 2010 –IMF

6.5%
6.5 %

o (world: 2.5%)

o Forecast till 2050 – Goldman Sachs
o
o

5 % p.a.

Services share in GDP over 55 % share in GDP
(in 2007-08)
Manufacturing sector grew at 8.8% in 2007-08
(15 % share in GDP in 2007-08)
Manufacturing Competitiveness
‘Made in India’


Second most attractive destination for manufacturing
o



Indian industry globally competitive in a wide range of
manufacturing skill-intensive products:
o



Apparels, electrical and electronics components; speciality
chemicals; pharmaceuticals; etc.

Automotive components: Major MNC’s & their OEMs
sourcing high-quality components from India
o



AT Kearney’s FDI Confidence Index 2004

Volvo, GM, GE, Chrysler, Ford, Toyota, Unilever, Cummins,
Delphi

Indian companies now having manufacturing presence
in many countries
o

Over 55% of approved outward investment by India companies
in manufacturing activities
Manufacturing vis-vis growth in
GDP
Source: NMCC (2009) report on Enhancing Competitiveness
Real GDP Growth Rates

Country

2001

2003

2005

2007

%
Share
in GDP
in 2007

% Share
in
Exports of
goods
/services
in 2007

% Share in
world
population
in
2007

USA

0.8

2.5

2.9

2.0

21.3

9.6

4.7

Canada

1.8

1.9

2.9

2.7

2.0

2.9

0.5

Germany

1.2

-0.2

0.8

2.5

4.3

9.2

1.3

France

1.9

1.1

1.9

2.2

3.2

4.0

1.0

UK

2.5

2.8

2.1

3.0

3.3

4.3

0.9

Japan

0.2

1.4

1.9

2.1

6.6

4.7

2.0

China

8.3

10.0

10.4

11.9

10.8

7.8

20.4

India

3.9

6.9

9.1

9.3

4.6

1.4

18.0

World

2.2

3.6

4.5

5.0
Year-on-year growth trends of
various sectors
Source: NMCC (2009) report on Enhancing Competitiveness
Year

Primary
Sector

Secondary
Sector

Tertiary Sector

Total GDP

Manufacturing

1993-94

3.30%

7.50%

6.40%

5.70%

8.60%

1994-95

4.70%

10.40%

5.80%

6.40%

10.80%

1995-96

-0.70%

13.20%

9.60%

7.30%

15.50%

1996-97

9.90%

8.00%

6.90%

8.00%

9.50%

1997-98

-2.60%

2.00%

9.00%

4.30%

0.10%

1998-99

6.30%

3.60%

8.10%

6.70%

3.10%

1999-00

2.70%

3.50%

9.30%

6.40%

3.20%

2000-01

-0.20%

6.40%

5.70%

4.40%

7.70%

2001-02

6.30%

2.40%

6.90%

5.80%

2.50%

2002-03

-7.20%

6.80%

7.50%

3.80%

6.80%

2003-04

10.00%

6.00%

8.80%

8.50%

6.60%

2004-05

0.00%

8.50%

9.90%

7.50%

8.70%

2005-06

5.90%

8.00%

11.00%

9.40%

9.00%

2006-07

3.80%

10.60%

11.20%

9.60%

12.00%

2007-08

4.50%

8.10%

10.70%

9.00%

8.80%
Significance of manufacturing ..1..








Crucial to Indian economy.
Effect of improvement in manufacturing sector goes far
beyond
Manufacturing sells goods to other sectors and in turn
buys materials and services from them for its growth
and development.

Spurs demand for : raw materials to intermediate
components. Impinges on software to financial,
health, accounting, transportation etc.
Provides a foundation for organic growth in other
sectors of economy
Offers employment opportunities directly or indirectly.
State of manufacturing helps to assess health of
economy by various stakeholders
Significance of manufacturing ..2..







Significant developments globally as well as within the
country have impacted on Indian manufacturing
sector.
Substantial reduction in trade barriers across the globe
and in India
IT revolution – Impact on productivity and costs.
Emergence of low cost manufacturing hubs – China
and other South East Asian countries
Formation of National Manufacturing Competitiveness
Council (NMCC) in 2004

NMCC has brought out strategic
perspective as starting point.
Formation of NMCC in 2004




Attaining competitive edge in ‘manufacturing’ depends critically
on mitigating constraints; both the general constraints such as
inadequate infrastructure, high transaction costs, higher interest,
power and regulatory issues as well as sector specific constraints
such as technology up gradation, market access, duty structure,
managerial practices and competitive scales etc. Resolution of
these constraints necessitates focused attention and action
involving not only inter-Ministerial/Departmental co-ordination
but also closer interaction amongst stakeholders viz; industry,
input providers, financial institutions, education, research and
management institutions.
Recognizing the importance of manufacturing in overall
economic growth of a country and the need for enhancing its
productivity, competitiveness and employment generation,
NMCC was formed. to have a national approach on
manufacturing.
National Strategy For Manufacturing




After detailed discussions with the Industry, Economists,
Academia, Government Departments concerned including
Planning Commission, Economic Advisory Council of the Prime
Minister and various stakeholders, “The National Strategy for
Manufacturing” has been prepared and submitted to the
Government for its adoption and implementation.
It attempts to identify the areas of policy and outlines the
strategic directions that need to be pursued in order to realize
higher levels of growth and employment. India has to aim at
achieving a long term GDP growth rate of 8 to 10 percent to
substantially improve the living conditions of its people for
which the manufacturing sector should target an average growth
rate of 12 to 14 per cent.
Long term manufacturing strategy












Enhance Government focus on manufacturing
competitiveness
Creating conditions for investment in and growth of the
manufacturing sector
Lowering the cost of manufacturing
Investing in innovations
Strengthening education and training at all levels
Adoption of global best practices in manufacturing
Right market framework, competition and regulation
Issues relating to competitiveness in small and medium
industries
Competitiveness of public sector manufacturing industries
Infrastructure development
Perspectives on competitiveness
Competitiveness is a concept comprising of the potential, the
process and the performance.

GMR (2001)

To be competitive, several factors must exist: the desire to win,
commitment or perseverance and the availability of certain
resources.

Khalil (2000)

Competitiveness is defined in terms of ‘helping business to win’,
‘price’, product range and quality and ‘distribution and marketing’.

Dou and
Hardwick(1998)

Competitiveness arises or results from firm-specific initiatives like:
better management, leveraging and stretching of resources.

Hamel and Prahlad

Ability to design, produce and /or market products or services
superior to those offered by competitors, considering the price
and non-price qualities.

Cruz and
Rugman(1992)

Competitiveness is synonymous with productivity and is assumed
To capture quality feature as well as efficiency feature.

Porter (1990)

Competitiveness is the ability to raise income as rapidly as
competitors and to make investments necessary to keep up with
Them in the future.

Scott (1989)

Extent to which a business sector offers potential for growth and
attractive return on investment

WCR(1994)

(1993)
Competitiveness..




Extent to which a business sector satisfies the needs of
customers from the appropriate combination of the
following product/service characteristics: price, quality,
innovation , and satisfies the needs of its constituents;
for example, workers in terms of involvement, benefit
programmes, training, and safe workplace; offers
attractive return on investment and also offers the
potential for profitable growth.
Company competitiveness is defined as "the ability to
design, produce and/or market products superior to
those offered by competitors, considering the price and
non-price qualities" (WCR, 1991).
Observations ..1..







Manufacturing sector India was liberalized much later
than the liberalization in other late industrializing
countries in Asia like Taiwan, Singapore, China and
Thailand.
Much of the changes in these other countries were led
by the electronics sector and were export oriented,
Indian firms were led by those in the process industry or
related to mechanical engineering
Focus was largely domestic.
Activities in the newer sectors (e.g., telecommunications)
dominated by MNCs who were starting to serve the
freshly liberalized and growing Indian markets.
Observations ..2..








Exports out of India were not necessary their top priority
(unlike the MNCs from seventies and eighties who had to
meet the export obligation and the phased indigenization
policies of the government).
Growth in demand in India and the coming of these
competing firms from outside India meant that domestic
firms had to adjust their strategies quite rapidly.
With increased purchasing power, the demand for goods
was growing and the manufacturing sector could hope to
get fair returns if they invested in upgrading their plants,
processes & products.
MNCs, had, brought with them new skills, new practices,
new product & process technologies, and new form of
competition based on quality and service.
Basis for my presentation








Chandra and Sastry ( 1st & 2nd National
Manufacturing Survey: 1997, 2002)
Chandra (3rd National Manufacturing
Survey: 2007)
Dangayach & Deshmukh (2001, 2005, 2007)
Singh et al. (2004, 2007)
Momaya (2004, 2006, 2007)
National Manufacturing Surveys
Manufacturing
Survey
Number
1
2
3

Year Sample

Conducted by

1997 56

Chandra & Sastry

2002 83
2007 683

Chandra & Sastry
Chandra
(For NMCC)

size
Key Finding of 1st Manufacturing
Survey(1997)






Opportunistic approach, not improved the shop floor
activities
A large number of firms embarked on quality
initiatives
Operations - opportunity driven rather than strategy
driven
Competitive priority
• Quality
• Operations related
• Structural changes
• Innovation and R&D
Key Finding of 2nd Manufacturing
Survey (2002) ..1..








A large number of firms embarked on productivity
improvement initiatives
Operations -opportunity driven rather than strategy
driven
Indian firms low on new product introduction, unable
to (or not caring to) successfully ride on the “imitation
to improvement” cycle
Supply Chain of firms fragmented, complex and lacks
discipline
Competitive priority
• Quality of product
• On time delivery
• Broad distribution
Key Finding of 2nd Manufacturing
Survey(2002) ..2..


Most important practices that the firms would focus on
during the next two years :
Integrating Information Systems across functions within
Business Units
Continuous Improvement of Current Manufacturing
Processes
Management Training
Developing Manufacturing Strategy to support Business
Strategy
Integrating Information Systems within Manufacturing
Key Finding of 3rd Manufacturing
Survey(2007) ..1..








Firms in different regions and of different sizes appear
to be adopting differing strategies for competing in
the market.
Scale of operations of most firms below their global
competitors. Reasons: Expensive capital costs,
restrictive labour laws and small size of the domestic
market and inadequate systems to manage large work
forces.
Quality continues to remain as the highest priority for
most firms. Innovation and R&D has the least priority.
Similarly, they identify fast /on-time delivery as areas
of concern.
Five most important practices that the firms would
focus on during the next two years are:
•
•
•
•

Improving the quality of work life;
Continuous Improvement of current manufacturing processes;
Supervisor training;
Management training; and Worker training.
Key Finding of 3rd Manufacturing
Survey(2007) ..2..


Skill building at all levels as one of the most crucial driver for
growth in the future.
• The presence of “continuous improvement” as a priority.




Supply Chain coordination as a key weakness for most
manufacturing firms.
While firms do see benefits from investment in innovation,
investments in R&D are very low.
• Most training for innovation happens when new technology or equipment is
purchased.




Investment and usage of IT on shop floor is very low.
Three areas that have seen the maximum improvement are:
overall quality as perceived by the customers,
• average customer defect rates, and
• delivery lead times. However, the variance across lead times is very high.



Small firms that are customizing requirements of customers are
doing well. This service approach to production may be the
distinctive mark of Indian manufacturing.
Key Finding of 3rd Manufacturing
Survey(2007) ..3..
 Regional

imbalances exist in terms of
capabilities of firms.
 Strategies of firms and their performance vary
by size. Tiny and small firms spend a higher
percentage of their sales in R&D as compared
to large and medium sized firms. Medium
size firms hold the maximum promise in
terms of their ability to compete on the basis
of higher productivity and operational
parameters as compared to the sales value.
Global acknowledgement of
manufacturing




16 Deming award-winning companies
One Japan Quality Medal winner
111 TPM Excellence awards companies




( Japan Institute of Plant Maintenance) - amongst the
highest tallies worldwide outside Japan

China has no Deming winners (only
11 TPM Excellence award winners )
Remark..
“The Indian automotive and component
industry is the most competitive globally
for its ability to design and plan ‘frugal’
products.”
Carlos Ghosn, President, Renault.
A study of Auto component
manufacturers





A questionnaire based survey of auto
component manufacturers all over the
country
Sample Size : 75
Response on a scale of 1 to 5.
Source: Singh R K, Garg S, Deshmukh SG (2007) Strategy
development for competitiveness: A study on Indian auto
component sector, International J of Productivity & Performance
Management, 56 (4), 284-307
Framework





Pressures
Constraints
Improvement agenda
Competitive Performance
Issues







Investments priorities
Priorities for developing
competencies
Strategies for cost & quality
Performance and Competitiveness
Challenges








Adoption of technology: If competitiveness is to be
enhanced, it is imperative that technology (such as AMT or
software such as ERP) needs to be properly adopted.
Training human resources at various levels: For
implementing technology , training of manpower is a
necessity. Training could include management of change
and sensitization towards new paradigm of manufacturing
Synergistically combing manufacturing with services and
thereby leveraging advantage in the global market: India is
perceived as software capital of the world. This strength
needs to be properly leveraged with hardware and other
functions related to manufacturing .
Developing the overall supply chain perspective to
strengthen the manufacturing function which can help to
get competitive advantage : It seems that many firms have
not yet integrated themselves along the basic philosophy of
supply chain. This seamless transition is a must , for
competitive manufacturing.
Multi-sector study of manufacturing




A questionnaire based survey manufacturers
all over the country
Sectors:
–
–
–
–




Automobile
Electronics
Machinery
Process

Sample Size : 120
Response on a scale of 1 to 5.
Source: Dangayach G S and Deshmukh S G (2008) Implementation of
Manufacturing strategy: A multi-sectoral study of Indian manufacturing
industry, In J of Services and Operations Management, 4(1), 1-33
Operational Measures of Competitive Priorities
Conformance quality (CQ)

Product durability (PD)
Product reliability (PR)
Product performance (PP)
Delivery speed (DS)

Quality (Q)
Delivery (D)

Dependable delivery (DD)
Product mix changes (PM)
Product customization (PC)
Design Changes (DC)

Flexibility (F)

Volume Changes (VC)
New Products (NP)
Low cost (LC)

Cost (C)
Explanation of Competitive Priorities


Conformance Quality (CQ): Improve conformance to

design specifications

Product Durability (PD): Provide durable product
 Product Reliability (PR): Offer consistent, reliable


quality


Product Performance (PP): Provide high performance

product

Delivery Speed (DS): Provide fast deliveries
 Dependable Delivery (DD): Make on time delivery or


meet delivery schedules
Explanation of Competitive Priorities


Product Mix changes (PM): Make rapid product

mix changes
Product

Customization (PC): Customize products

to customer needs

Design Changes (DC): Make rapid design changes
 Volume Changes (VC): Make rapid volume changes
 New Product introduction (NP): Introduce new


products quickly


Low Cost (LC): Ability to profit in price

competitive markets
Agenda for Improvement


Improvement through
 Advanced Manufacturing Technology
(AMT)
 Integrated Information Systems (IIS)
 Advanced Management Systems (AMS)
Advanced Manufacturing Technology (AMT)
CAD: Computer supported design and drafting system
 CAE: Computer assisted engineering methods
 CAPP: Computer assisted systems and techniques for
process planning
 CNC: Numerically controlled machine tools
 DNC: Numerical controlled machine with centralized
computer
 Robotics (RO): use of Robots for pick and place or
other material handling work
 Cellular Manufacturing (CM): organizing the shop floor
such that an operator has the resources to produce an


entire product.
Advanced Manufacturing Technology (AMT)
FMS:

Computer integrated systems which have
the flexibility to rapidly change product type and
mix
 AMHS: Automatic material handling devices such
as conveyors, gantry robots etc.
 AGV: Driver less vehicles run on special painted
paths
 Bar Coding (BC): Bar identification system
Automated storage and retrieval system (AS/RS):
Mechanized stock management system
Integrated Information Systems (IIS)
MRP: Computer assisted material planning
system
 MRPII:
Computer based system for
planning and allocation of work among
employees
 ERP: Integrated information management
system
 ABC: Philosophy of cost reduction through
activity based cost accounting

Advanced Management Systems (AMS)
Office Automation (OA): Computerization of
office systems
 Customer relations (CR): Improve customer
satisfaction, customer-supplier relationship
Total quality management (TQM): Approach to
improving the competitiveness of an organization
through kaizen, total participation and continuous
improvement
 Recycling (RC): Reusing waste materials
 Business process reengineering (BPR):
Fundamental rethinking and radical redesign of
business processes to achieve improvements

Advanced Management Systems (AMS)
Statistical process control (SPC): The use of
statistical methods to control quality
 Just-in-time (JIT): Produce and deliver finished
goods just-in-time to be sold
 Benchmarking (BM): Comparing a company's
performance against the best practice
 Workforce involvement (WI): Giving worker more
planning responsibility
 Employee empowerment (EE): Philosophy of handing
responsibility and decision making to employees
lower down in organization
 Management training (MT): Training and skill
development programs for managers

Top Ten Improvement Activities of
Indian Companies (in descending order)
Management training (AMS)
 Total quality management (AMS)
 Customer relations (AMS)
 Workforce involvement (AMS)
 Employee empowerment (AMS)
 Statistical process control (AMS)
 Benchmarking (AMS)
 Computer aided design (AMT)
 Material requirement planning (IIS)
 Office automation (AMS)


Top seven activities are from AMS
SIA Model






Simplify: simplification of processes with
advanced management systems such as
TQM, BPR, WI etc.
Integrate: Integration of various functions
through information systems (MRP, ERP etc.)
Automate: Deploying advanced
manufacturing technologies like CAD, CAM,
FMS etc.
Importance Ratings (on a scale of 1 to 5)
to Improvement Activities (IA)

AMT
(2.25)
IA

IIS (2.83)
AMS (3.28)
1

2

3

4

Mean Score

5
Insights ..1..




Firms are investing more in AMS as
compared to IIS and AMT.
The top three improvement activities







Management training (AMS),
Total quality management (AMS)
Customer relations (AMS)

The quality movement in the country
characterized by ISO 9000’s popularity has
motivated companies to invest in AMS with
a focus on human related issues.
Insights ..2..






The second locus of improvement seems to be on
integrating various business functions and processes. IIS
can act as enabler in this direction. That is why Indian
companies seem to invest more on IIS.
Because of availability of vast manpower base,
automation is generally given the last priority in the
agenda of Indian companies.
Indian manufacturing companies are reluctant to invest
in AMT because: a) high investment , b) related
problems of ‘management of change’ and c) adaptability
of such technologies in Indian context.
Competitive Priorities
Ran
k
1

iNDIA

USA

Europe

JAPAN

Conformance quality

Design flexibility

Consistent quality

Competition based on price

2

Product reliability

Reliable products

Reliable products

3

Dependable delivery

Dependable deliveries

Dependable deliveries

4

Product durability
Provide high
performance product

Competition based on
price
Fast deliveries

Fast deliveries

5

Rapid product mix
changes
Quick introduction
of new products
Rapid volume
changes
Fast deliveries

6

Fast Deliveries

Customize
products
Product customization Dependable
deliveries
Rapid volume changes Consistent quality

High performance
products
Quick introduction of
new products
Customize products

Consistent quality

Rapid product mix
changes
Quick introduction of
new product

Reliable products

Rapid volume changes

Design flexibility

Competition based
on price

Rapid product mix
changes

Rapid product mix changes

7
8
9
10

Quick introduction of new
products

High performance products
Customize products
Challenges: External





Environmental in nature – the recent financial
crisis around the world will restrict exports as
much as possible and
National barriers raised,
Ability of firms to raise resources tested due to
scarce credit though interest rates might come
down, firms will be under pressure to survive
and consequently, price competition will
become intense (and firms will be offering more
value for money).
Challenges: Internal




Challenges within the walls of the
organization will relate to tiding over the
short term crisis financially.
This may be the opportunity to focus on
productivity through training and process
improvements (which will be helpful in the
short term as well) so that when the global
markets pick up, firms have built competitive
strengths.
Key Insights


Greater Emphasis on soft issues
“The hard stuff is easy
The soft stuff is hard
Soft stuff is more important than the hard stuff”.
Miliken & Co. (USA)

Manufacturing Contributes to Competitive
Success


 Manufacturing Strategy is not limited to a few key

decisions about technology, capacity; but it is defined by
the total pattern of decisions across the full range of
manufacturing systems.
Concluding remarks..






Competitiveness of Indian manufacturing is a
function of the nature and extent of capabilities
developed by these firms. Capability building is
a complex process – it is supported by a variety
of drivers and the extent can be measured by a
range of outcomes.
Indian firms have been building a wide range of
capabilities.
Restructuring of the industry is slowly leading
to the emergence of a firms that is desirous of
competing globally.
Acknowledgement





Prof G S Yadava (IEI)
Prof G S Dangayach (MMNIT, Jaipur)
Prof S K Garg (DTU, N Delhi)
Dr R K Singh (DTU, N Delhi)

Manufacturing competitiveness-sgd-6-nov-2009

  • 1.
    Manufacturing Competitiveness: Issues & Challenges SG Deshmukh ABV-Indian Institute of Information Technology & Management Gwalior 6 Nov 2009 25th National Convention of mechanical Engineers: Challenges for Manufacturing in next decade
  • 2.
    Speaking points..        Role ofmanufacturing Two perspectives : Economic & System Oriented Competitiveness Case of Auto component Multi-sector study Insights gained Concluding remarks
  • 3.
    Two Views  Macroeconomic View Operations Management View
  • 4.
    An overview ofIndian Economy Economic Performance o Sustained economic growth o Average last 10 years o Forecast for 2010 –IMF 6.5% 6.5 % o (world: 2.5%) o Forecast till 2050 – Goldman Sachs o o 5 % p.a. Services share in GDP over 55 % share in GDP (in 2007-08) Manufacturing sector grew at 8.8% in 2007-08 (15 % share in GDP in 2007-08)
  • 5.
    Manufacturing Competitiveness ‘Made inIndia’  Second most attractive destination for manufacturing o  Indian industry globally competitive in a wide range of manufacturing skill-intensive products: o  Apparels, electrical and electronics components; speciality chemicals; pharmaceuticals; etc. Automotive components: Major MNC’s & their OEMs sourcing high-quality components from India o  AT Kearney’s FDI Confidence Index 2004 Volvo, GM, GE, Chrysler, Ford, Toyota, Unilever, Cummins, Delphi Indian companies now having manufacturing presence in many countries o Over 55% of approved outward investment by India companies in manufacturing activities
  • 6.
    Manufacturing vis-vis growthin GDP Source: NMCC (2009) report on Enhancing Competitiveness Real GDP Growth Rates Country 2001 2003 2005 2007 % Share in GDP in 2007 % Share in Exports of goods /services in 2007 % Share in world population in 2007 USA 0.8 2.5 2.9 2.0 21.3 9.6 4.7 Canada 1.8 1.9 2.9 2.7 2.0 2.9 0.5 Germany 1.2 -0.2 0.8 2.5 4.3 9.2 1.3 France 1.9 1.1 1.9 2.2 3.2 4.0 1.0 UK 2.5 2.8 2.1 3.0 3.3 4.3 0.9 Japan 0.2 1.4 1.9 2.1 6.6 4.7 2.0 China 8.3 10.0 10.4 11.9 10.8 7.8 20.4 India 3.9 6.9 9.1 9.3 4.6 1.4 18.0 World 2.2 3.6 4.5 5.0
  • 7.
    Year-on-year growth trendsof various sectors Source: NMCC (2009) report on Enhancing Competitiveness Year Primary Sector Secondary Sector Tertiary Sector Total GDP Manufacturing 1993-94 3.30% 7.50% 6.40% 5.70% 8.60% 1994-95 4.70% 10.40% 5.80% 6.40% 10.80% 1995-96 -0.70% 13.20% 9.60% 7.30% 15.50% 1996-97 9.90% 8.00% 6.90% 8.00% 9.50% 1997-98 -2.60% 2.00% 9.00% 4.30% 0.10% 1998-99 6.30% 3.60% 8.10% 6.70% 3.10% 1999-00 2.70% 3.50% 9.30% 6.40% 3.20% 2000-01 -0.20% 6.40% 5.70% 4.40% 7.70% 2001-02 6.30% 2.40% 6.90% 5.80% 2.50% 2002-03 -7.20% 6.80% 7.50% 3.80% 6.80% 2003-04 10.00% 6.00% 8.80% 8.50% 6.60% 2004-05 0.00% 8.50% 9.90% 7.50% 8.70% 2005-06 5.90% 8.00% 11.00% 9.40% 9.00% 2006-07 3.80% 10.60% 11.20% 9.60% 12.00% 2007-08 4.50% 8.10% 10.70% 9.00% 8.80%
  • 8.
    Significance of manufacturing..1..       Crucial to Indian economy. Effect of improvement in manufacturing sector goes far beyond Manufacturing sells goods to other sectors and in turn buys materials and services from them for its growth and development.  Spurs demand for : raw materials to intermediate components. Impinges on software to financial, health, accounting, transportation etc. Provides a foundation for organic growth in other sectors of economy Offers employment opportunities directly or indirectly. State of manufacturing helps to assess health of economy by various stakeholders
  • 9.
    Significance of manufacturing..2..      Significant developments globally as well as within the country have impacted on Indian manufacturing sector. Substantial reduction in trade barriers across the globe and in India IT revolution – Impact on productivity and costs. Emergence of low cost manufacturing hubs – China and other South East Asian countries Formation of National Manufacturing Competitiveness Council (NMCC) in 2004  NMCC has brought out strategic perspective as starting point.
  • 10.
    Formation of NMCCin 2004   Attaining competitive edge in ‘manufacturing’ depends critically on mitigating constraints; both the general constraints such as inadequate infrastructure, high transaction costs, higher interest, power and regulatory issues as well as sector specific constraints such as technology up gradation, market access, duty structure, managerial practices and competitive scales etc. Resolution of these constraints necessitates focused attention and action involving not only inter-Ministerial/Departmental co-ordination but also closer interaction amongst stakeholders viz; industry, input providers, financial institutions, education, research and management institutions. Recognizing the importance of manufacturing in overall economic growth of a country and the need for enhancing its productivity, competitiveness and employment generation, NMCC was formed. to have a national approach on manufacturing.
  • 11.
    National Strategy ForManufacturing   After detailed discussions with the Industry, Economists, Academia, Government Departments concerned including Planning Commission, Economic Advisory Council of the Prime Minister and various stakeholders, “The National Strategy for Manufacturing” has been prepared and submitted to the Government for its adoption and implementation. It attempts to identify the areas of policy and outlines the strategic directions that need to be pursued in order to realize higher levels of growth and employment. India has to aim at achieving a long term GDP growth rate of 8 to 10 percent to substantially improve the living conditions of its people for which the manufacturing sector should target an average growth rate of 12 to 14 per cent.
  • 12.
    Long term manufacturingstrategy           Enhance Government focus on manufacturing competitiveness Creating conditions for investment in and growth of the manufacturing sector Lowering the cost of manufacturing Investing in innovations Strengthening education and training at all levels Adoption of global best practices in manufacturing Right market framework, competition and regulation Issues relating to competitiveness in small and medium industries Competitiveness of public sector manufacturing industries Infrastructure development
  • 13.
    Perspectives on competitiveness Competitivenessis a concept comprising of the potential, the process and the performance. GMR (2001) To be competitive, several factors must exist: the desire to win, commitment or perseverance and the availability of certain resources. Khalil (2000) Competitiveness is defined in terms of ‘helping business to win’, ‘price’, product range and quality and ‘distribution and marketing’. Dou and Hardwick(1998) Competitiveness arises or results from firm-specific initiatives like: better management, leveraging and stretching of resources. Hamel and Prahlad Ability to design, produce and /or market products or services superior to those offered by competitors, considering the price and non-price qualities. Cruz and Rugman(1992) Competitiveness is synonymous with productivity and is assumed To capture quality feature as well as efficiency feature. Porter (1990) Competitiveness is the ability to raise income as rapidly as competitors and to make investments necessary to keep up with Them in the future. Scott (1989) Extent to which a business sector offers potential for growth and attractive return on investment WCR(1994) (1993)
  • 14.
    Competitiveness..   Extent to whicha business sector satisfies the needs of customers from the appropriate combination of the following product/service characteristics: price, quality, innovation , and satisfies the needs of its constituents; for example, workers in terms of involvement, benefit programmes, training, and safe workplace; offers attractive return on investment and also offers the potential for profitable growth. Company competitiveness is defined as "the ability to design, produce and/or market products superior to those offered by competitors, considering the price and non-price qualities" (WCR, 1991).
  • 15.
    Observations ..1..     Manufacturing sectorIndia was liberalized much later than the liberalization in other late industrializing countries in Asia like Taiwan, Singapore, China and Thailand. Much of the changes in these other countries were led by the electronics sector and were export oriented, Indian firms were led by those in the process industry or related to mechanical engineering Focus was largely domestic. Activities in the newer sectors (e.g., telecommunications) dominated by MNCs who were starting to serve the freshly liberalized and growing Indian markets.
  • 16.
    Observations ..2..     Exports outof India were not necessary their top priority (unlike the MNCs from seventies and eighties who had to meet the export obligation and the phased indigenization policies of the government). Growth in demand in India and the coming of these competing firms from outside India meant that domestic firms had to adjust their strategies quite rapidly. With increased purchasing power, the demand for goods was growing and the manufacturing sector could hope to get fair returns if they invested in upgrading their plants, processes & products. MNCs, had, brought with them new skills, new practices, new product & process technologies, and new form of competition based on quality and service.
  • 17.
    Basis for mypresentation      Chandra and Sastry ( 1st & 2nd National Manufacturing Survey: 1997, 2002) Chandra (3rd National Manufacturing Survey: 2007) Dangayach & Deshmukh (2001, 2005, 2007) Singh et al. (2004, 2007) Momaya (2004, 2006, 2007)
  • 18.
    National Manufacturing Surveys Manufacturing Survey Number 1 2 3 YearSample Conducted by 1997 56 Chandra & Sastry 2002 83 2007 683 Chandra & Sastry Chandra (For NMCC) size
  • 19.
    Key Finding of1st Manufacturing Survey(1997)     Opportunistic approach, not improved the shop floor activities A large number of firms embarked on quality initiatives Operations - opportunity driven rather than strategy driven Competitive priority • Quality • Operations related • Structural changes • Innovation and R&D
  • 20.
    Key Finding of2nd Manufacturing Survey (2002) ..1..      A large number of firms embarked on productivity improvement initiatives Operations -opportunity driven rather than strategy driven Indian firms low on new product introduction, unable to (or not caring to) successfully ride on the “imitation to improvement” cycle Supply Chain of firms fragmented, complex and lacks discipline Competitive priority • Quality of product • On time delivery • Broad distribution
  • 21.
    Key Finding of2nd Manufacturing Survey(2002) ..2..  Most important practices that the firms would focus on during the next two years : Integrating Information Systems across functions within Business Units Continuous Improvement of Current Manufacturing Processes Management Training Developing Manufacturing Strategy to support Business Strategy Integrating Information Systems within Manufacturing
  • 22.
    Key Finding of3rd Manufacturing Survey(2007) ..1..     Firms in different regions and of different sizes appear to be adopting differing strategies for competing in the market. Scale of operations of most firms below their global competitors. Reasons: Expensive capital costs, restrictive labour laws and small size of the domestic market and inadequate systems to manage large work forces. Quality continues to remain as the highest priority for most firms. Innovation and R&D has the least priority. Similarly, they identify fast /on-time delivery as areas of concern. Five most important practices that the firms would focus on during the next two years are: • • • • Improving the quality of work life; Continuous Improvement of current manufacturing processes; Supervisor training; Management training; and Worker training.
  • 23.
    Key Finding of3rd Manufacturing Survey(2007) ..2..  Skill building at all levels as one of the most crucial driver for growth in the future. • The presence of “continuous improvement” as a priority.   Supply Chain coordination as a key weakness for most manufacturing firms. While firms do see benefits from investment in innovation, investments in R&D are very low. • Most training for innovation happens when new technology or equipment is purchased.   Investment and usage of IT on shop floor is very low. Three areas that have seen the maximum improvement are: overall quality as perceived by the customers, • average customer defect rates, and • delivery lead times. However, the variance across lead times is very high.  Small firms that are customizing requirements of customers are doing well. This service approach to production may be the distinctive mark of Indian manufacturing.
  • 24.
    Key Finding of3rd Manufacturing Survey(2007) ..3..  Regional imbalances exist in terms of capabilities of firms.  Strategies of firms and their performance vary by size. Tiny and small firms spend a higher percentage of their sales in R&D as compared to large and medium sized firms. Medium size firms hold the maximum promise in terms of their ability to compete on the basis of higher productivity and operational parameters as compared to the sales value.
  • 25.
    Global acknowledgement of manufacturing    16Deming award-winning companies One Japan Quality Medal winner 111 TPM Excellence awards companies   ( Japan Institute of Plant Maintenance) - amongst the highest tallies worldwide outside Japan China has no Deming winners (only 11 TPM Excellence award winners )
  • 26.
    Remark.. “The Indian automotiveand component industry is the most competitive globally for its ability to design and plan ‘frugal’ products.” Carlos Ghosn, President, Renault.
  • 27.
    A study ofAuto component manufacturers    A questionnaire based survey of auto component manufacturers all over the country Sample Size : 75 Response on a scale of 1 to 5. Source: Singh R K, Garg S, Deshmukh SG (2007) Strategy development for competitiveness: A study on Indian auto component sector, International J of Productivity & Performance Management, 56 (4), 284-307
  • 28.
  • 29.
    Issues     Investments priorities Priorities fordeveloping competencies Strategies for cost & quality Performance and Competitiveness
  • 30.
    Challenges     Adoption of technology:If competitiveness is to be enhanced, it is imperative that technology (such as AMT or software such as ERP) needs to be properly adopted. Training human resources at various levels: For implementing technology , training of manpower is a necessity. Training could include management of change and sensitization towards new paradigm of manufacturing Synergistically combing manufacturing with services and thereby leveraging advantage in the global market: India is perceived as software capital of the world. This strength needs to be properly leveraged with hardware and other functions related to manufacturing . Developing the overall supply chain perspective to strengthen the manufacturing function which can help to get competitive advantage : It seems that many firms have not yet integrated themselves along the basic philosophy of supply chain. This seamless transition is a must , for competitive manufacturing.
  • 31.
    Multi-sector study ofmanufacturing   A questionnaire based survey manufacturers all over the country Sectors: – – – –   Automobile Electronics Machinery Process Sample Size : 120 Response on a scale of 1 to 5. Source: Dangayach G S and Deshmukh S G (2008) Implementation of Manufacturing strategy: A multi-sectoral study of Indian manufacturing industry, In J of Services and Operations Management, 4(1), 1-33
  • 32.
    Operational Measures ofCompetitive Priorities Conformance quality (CQ) Product durability (PD) Product reliability (PR) Product performance (PP) Delivery speed (DS) Quality (Q) Delivery (D) Dependable delivery (DD) Product mix changes (PM) Product customization (PC) Design Changes (DC) Flexibility (F) Volume Changes (VC) New Products (NP) Low cost (LC) Cost (C)
  • 33.
    Explanation of CompetitivePriorities  Conformance Quality (CQ): Improve conformance to design specifications Product Durability (PD): Provide durable product  Product Reliability (PR): Offer consistent, reliable  quality  Product Performance (PP): Provide high performance product Delivery Speed (DS): Provide fast deliveries  Dependable Delivery (DD): Make on time delivery or  meet delivery schedules
  • 34.
    Explanation of CompetitivePriorities  Product Mix changes (PM): Make rapid product mix changes Product Customization (PC): Customize products to customer needs Design Changes (DC): Make rapid design changes  Volume Changes (VC): Make rapid volume changes  New Product introduction (NP): Introduce new  products quickly  Low Cost (LC): Ability to profit in price competitive markets
  • 35.
    Agenda for Improvement  Improvementthrough  Advanced Manufacturing Technology (AMT)  Integrated Information Systems (IIS)  Advanced Management Systems (AMS)
  • 36.
    Advanced Manufacturing Technology(AMT) CAD: Computer supported design and drafting system  CAE: Computer assisted engineering methods  CAPP: Computer assisted systems and techniques for process planning  CNC: Numerically controlled machine tools  DNC: Numerical controlled machine with centralized computer  Robotics (RO): use of Robots for pick and place or other material handling work  Cellular Manufacturing (CM): organizing the shop floor such that an operator has the resources to produce an  entire product.
  • 37.
    Advanced Manufacturing Technology(AMT) FMS: Computer integrated systems which have the flexibility to rapidly change product type and mix  AMHS: Automatic material handling devices such as conveyors, gantry robots etc.  AGV: Driver less vehicles run on special painted paths  Bar Coding (BC): Bar identification system Automated storage and retrieval system (AS/RS): Mechanized stock management system
  • 38.
    Integrated Information Systems(IIS) MRP: Computer assisted material planning system  MRPII: Computer based system for planning and allocation of work among employees  ERP: Integrated information management system  ABC: Philosophy of cost reduction through activity based cost accounting 
  • 39.
    Advanced Management Systems(AMS) Office Automation (OA): Computerization of office systems  Customer relations (CR): Improve customer satisfaction, customer-supplier relationship Total quality management (TQM): Approach to improving the competitiveness of an organization through kaizen, total participation and continuous improvement  Recycling (RC): Reusing waste materials  Business process reengineering (BPR): Fundamental rethinking and radical redesign of business processes to achieve improvements 
  • 40.
    Advanced Management Systems(AMS) Statistical process control (SPC): The use of statistical methods to control quality  Just-in-time (JIT): Produce and deliver finished goods just-in-time to be sold  Benchmarking (BM): Comparing a company's performance against the best practice  Workforce involvement (WI): Giving worker more planning responsibility  Employee empowerment (EE): Philosophy of handing responsibility and decision making to employees lower down in organization  Management training (MT): Training and skill development programs for managers 
  • 41.
    Top Ten ImprovementActivities of Indian Companies (in descending order) Management training (AMS)  Total quality management (AMS)  Customer relations (AMS)  Workforce involvement (AMS)  Employee empowerment (AMS)  Statistical process control (AMS)  Benchmarking (AMS)  Computer aided design (AMT)  Material requirement planning (IIS)  Office automation (AMS)  Top seven activities are from AMS
  • 42.
    SIA Model    Simplify: simplificationof processes with advanced management systems such as TQM, BPR, WI etc. Integrate: Integration of various functions through information systems (MRP, ERP etc.) Automate: Deploying advanced manufacturing technologies like CAD, CAM, FMS etc.
  • 43.
    Importance Ratings (ona scale of 1 to 5) to Improvement Activities (IA) AMT (2.25) IA IIS (2.83) AMS (3.28) 1 2 3 4 Mean Score 5
  • 44.
    Insights ..1..   Firms areinvesting more in AMS as compared to IIS and AMT. The top three improvement activities     Management training (AMS), Total quality management (AMS) Customer relations (AMS) The quality movement in the country characterized by ISO 9000’s popularity has motivated companies to invest in AMS with a focus on human related issues.
  • 45.
    Insights ..2..    The secondlocus of improvement seems to be on integrating various business functions and processes. IIS can act as enabler in this direction. That is why Indian companies seem to invest more on IIS. Because of availability of vast manpower base, automation is generally given the last priority in the agenda of Indian companies. Indian manufacturing companies are reluctant to invest in AMT because: a) high investment , b) related problems of ‘management of change’ and c) adaptability of such technologies in Indian context.
  • 46.
    Competitive Priorities Ran k 1 iNDIA USA Europe JAPAN Conformance quality Designflexibility Consistent quality Competition based on price 2 Product reliability Reliable products Reliable products 3 Dependable delivery Dependable deliveries Dependable deliveries 4 Product durability Provide high performance product Competition based on price Fast deliveries Fast deliveries 5 Rapid product mix changes Quick introduction of new products Rapid volume changes Fast deliveries 6 Fast Deliveries Customize products Product customization Dependable deliveries Rapid volume changes Consistent quality High performance products Quick introduction of new products Customize products Consistent quality Rapid product mix changes Quick introduction of new product Reliable products Rapid volume changes Design flexibility Competition based on price Rapid product mix changes Rapid product mix changes 7 8 9 10 Quick introduction of new products High performance products Customize products
  • 47.
    Challenges: External    Environmental innature – the recent financial crisis around the world will restrict exports as much as possible and National barriers raised, Ability of firms to raise resources tested due to scarce credit though interest rates might come down, firms will be under pressure to survive and consequently, price competition will become intense (and firms will be offering more value for money).
  • 48.
    Challenges: Internal   Challenges withinthe walls of the organization will relate to tiding over the short term crisis financially. This may be the opportunity to focus on productivity through training and process improvements (which will be helpful in the short term as well) so that when the global markets pick up, firms have built competitive strengths.
  • 49.
    Key Insights  Greater Emphasison soft issues “The hard stuff is easy The soft stuff is hard Soft stuff is more important than the hard stuff”. Miliken & Co. (USA) Manufacturing Contributes to Competitive Success   Manufacturing Strategy is not limited to a few key decisions about technology, capacity; but it is defined by the total pattern of decisions across the full range of manufacturing systems.
  • 50.
    Concluding remarks..    Competitiveness ofIndian manufacturing is a function of the nature and extent of capabilities developed by these firms. Capability building is a complex process – it is supported by a variety of drivers and the extent can be measured by a range of outcomes. Indian firms have been building a wide range of capabilities. Restructuring of the industry is slowly leading to the emergence of a firms that is desirous of competing globally.
  • 51.
    Acknowledgement     Prof G SYadava (IEI) Prof G S Dangayach (MMNIT, Jaipur) Prof S K Garg (DTU, N Delhi) Dr R K Singh (DTU, N Delhi)