The document provides an overview of India's manufacturing sector. It discusses key topics such as the importance of manufacturing, classification and size of the sector, export and import trends, technology intensity, and challenges. Some key points:
- Manufacturing is an important driver of economic development and employment. However, India's manufacturing sector contributes only around 15-16% to GDP, lower than other major economies.
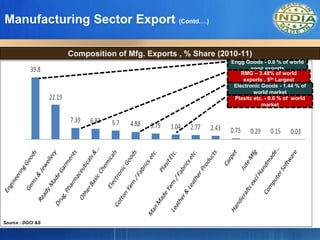
- Exports are dominated by low technology goods. Engineering goods, gems and jewelry account for over 60% of exports but India has less than 1% share in global markets. Imports exceed exports, leading to a large trade deficit.
- The sector faces challenges of low R&D spending, lack of technology