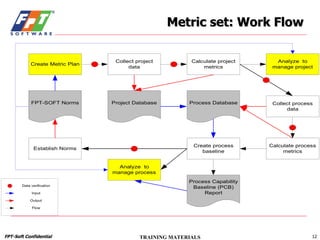
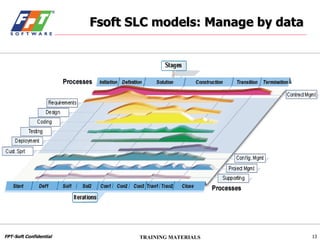
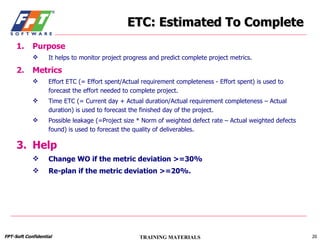
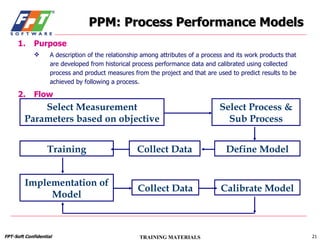
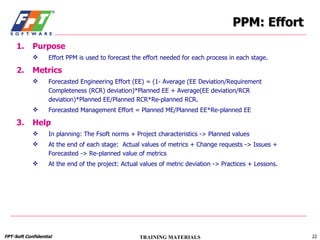
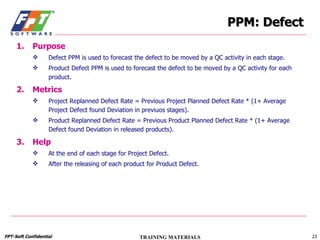
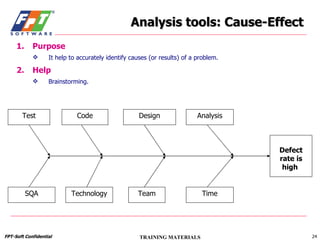
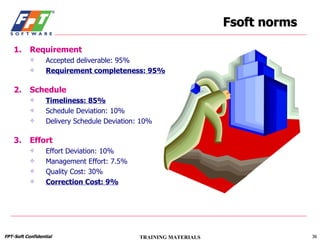
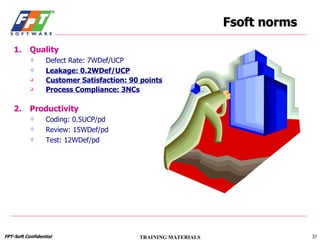
Managing projects by data Version:  3.0   Author:   Le The Hung Sep  05, 2005 Instructor:  Thai Nguyen ©  2001   FPT-SOFT 04e-BM/NS/HDCV/FSOFT
Introduction Course duration: 1 hour 45’ Purpose: Practical use of data for managing projects Targeted attendees: Team leaders, SEPG, SQA, project managers Tests/quiz: Quiz in 15’ for new attendants
Objectives After the course, student will: Understand Fsoft metric system. Know about Fsoft PCBs and norms. Be able to use data for managing projects.
Fsoft metric system  –  45’ Fsoft PCBs and Norms – 45’  Quiz – 15’ Table of contents
Why it’s needed? Metric set Analysis tools Fsoft SLC in quantitative management Fsoft metric system
Why: Fsoft quality objective “ FPT-SOFT is committed to deliver products that  fully meet  customer’s requirements  on schedule   defined in the project plan”
Why: International standards ISO 9001:2000 8.2.3 Monitoring and measurement of the processes 8.4 Analysis of data CMM/SEI 1.1: PA.G1: The quantitative process management activities are planned PA.G2: The process performance of the project's defined software process is controlled quantitatively PA.G3: The process capability of the organization's standard software process is known in quantitative terms
Why: International standards CMMI/SEI 1.1: Measurement and Analysis Quantitative project management Organizational Process Performance
Why: Production improvements
Metric set: Collected data Effort  (Project, work product, process, type of activity): Weekly Schedule  (Start-date, expected end-date, actual end-date, delivery): At milestones Defect  (Project, work product, stage detected, QC activities, stage injected, process origin, severity, classification type, priority): Weekly Size   (Total, work product, activity): At milestones Requirement   (Total, size, status): Weekly Customer  complaints, customer satisfaction survey point, NC Tools : Fsoft management suite (Timesheet, DMS, NCMS, Dashboard, Fsoft Insight)
Metric set: Calculated indicators Effort  (Effectiveness, deviation): Weekly Schedule  (Timeliness, deviation): At milestones Defect  (Defect rate, leakage): Weekly Size   (Deviation): At milestones Requirement   (Requirement Completeness): Weekly Productivity, customer satisfaction, process compliance, distribution  (Effort, defects): At the end of project Status   (Effort, Schedule, Defect): Weekly Tools : Fsoft management suite (Timesheet, DMS, NCMS, Dashboard, Fsoft Insight)
Metric set: Work Flow
Fsoft SLC models: Manage by data
Initiation stage: Norms for WO Overview The Initiation stage is the start of the SLC, in which: Project's software scope and boundary conditions, including the operational vision and proposed products, are established. Overall cost and schedule of the project are estimated. Potential risks are defined.  Metrics Estimated size, estimated effort and planned schedule for the project. Target value of the quality goals for the project:  Timeliness, Requirement Completeness, Leakage, Correct Cost, Customer Satisfaction, Process Compliance, Response Time. Actual data of the stage: Actual effort and actual schedule for the stage. Help Use Fsoft norms for overall estimating and setting goals. Record in the WO, Estimation sheets, Fsoft Insight
Definition stage: PCB for Planning Overview Studying and clarifying user requirements. Preparing and releasing SRS. Negotiating Acceptance Criteria with customer. Updating and releasing complete project plan. Metrics Estimated size for the project, estimated effort and planned schedule for the stage. Progress values of the quality goals: Timeliness, Requirement Completeness, Correct Cost. Actual data of the stage: Actual effort and actual schedule for the stage, actual size and defects of the project plan, URD and SRS. Help Use Fsoft norms for detail estimating and planning. Fill data in the Fsoft Insight Analyse by viewing the Charts/Status and log issue in the Issue table
Solution stage: Review metrics Overview The main purpose of this stage is to define an effective solution to meet customer requirements. Analyzing and creating a good design for the software package are the main activities. Metrics Estimated effort and planned schedule for the stage. Progress values of the quality goals : Timeliness, Completeness, Correct Cost, Process Compliance. Actual data of the stage:  Actual effort and actual schedule for the stage, actual size and defects of the ADD and Test Plan. Help Use Fsoft norms for re-estimating and re-planning. Fill data in the Fsoft Insight Analyse by viewing the Charts/Status and log issue in the Issue table
Construction stage: Data analysis Overview The goal of the construction stage is to develop the system. Coding and testing for the software package are the main activities. Metrics Estimated effort and planned schedule for the stage. Progress values of the quality goals : Timeliness, Completeness, Correct Cost, Process Compliance. Actual data of the stage: Actual effort and actual schedule for the stage, actual size and defects of the DDD, Test case and Test Data, modules and unit programs. Help Use Fsoft norms for re-estimating and re-planning. Fill data in the Fsoft Insight Analyse by viewing the Charts/Status and log issue in the Issue table
Transition stage: Leakage Overview The focus of the Transition stage is to ensure that software is available for its end users. Delivering software to customer, implementing software systems on customer site and conducting test activities for acceptance are main activities of this stage.  Metrics Estimated effort and planned schedule for the stage. Progress values of the quality goals: Timeliness, Completeness, Leakage, Correct Cost, Process Compliance. Actual data of the stage: Actual effort and actual schedule for the stage, actual size and defects of the software package. Help Use Fsoft norms for re-estimating and re-planning. Fill data in the Fsoft Insight Analyse by viewing the Charts/Status and log issue in the Issue table
Termination stage: Fsoft Data Overview The project closes at this stage when customer accepts the whole project and signs off the contract. Project assets must be collected and transferred to Fsoft process asset library. The goal of this stage is to summarize the results of the project and to provide the project knowledge and experiences for other projects. Metrics Estimated effort and planned schedule for the stage. Final values of the quality goals: Timeliness, Completeness, Leakage, Correct Cost, Customer Satisfaction, Process Compliance. Actual data of the stage: Actual effort and actual schedule for the stage, customer satisfaction point. Help Compare Actual metrics with Fsoft norms and Project norms Analyse in post mortem report
ETC: Estimated To Complete Purpose It helps to monitor project progress and predict complete project metrics. Metrics Effort ETC (= Effort spent/Actual requirement completeness - Effort spent) is used to forecast the effort needed to complete project. Time ETC (= Current day + Actual duration/Actual requirement completeness – Actual duration) is used to forecast the finished day of the project. Possible leakage (=Project size * Norm of weighted defect rate – Actual weighted defects found) is used to forecast the quality of deliverables. Help Change WO if the metric deviation >=30% Re-plan if the metric deviation >=20%.
PPM: Process Performance Models Purpose A description of the relationship among attributes of a process and its work products that are developed from historical process performance data and calibrated using collected process and product measures from the project and that are used to predict results to be achieved by following a process. Flow Select Measurement Parameters based on objective Collect Data Define Model Training Implementation of Model Collect Data Calibrate Model Select Process & Sub Process
PPM: Effort Purpose Effort PPM is used to forecast the effort needed for each process in each stage. Metrics Forecasted Engineering Effort (EE) = (1- Average (EE Deviation/Requirement Completeness (RCR) deviation)*Planned EE + Average(EE deviation/RCR deviation)*Planned EE/Planned RCR*Re-planned RCR. Forecasted Management Effort = Planned ME/Planned EE*Re-planned EE Help In planning: The Fsoft norms + Project characteristics -> Planned values At the end of each stage:  Actual values of metrics + Change requests -> Issues + Forecasted -> Re-planned value of metrics At the end of the project: Actual values of metric deviation -> Practices + Lessons.
PPM: Defect Purpose Defect PPM is used to forecast the defect to be moved by a QC activity in each stage. Product Defect PPM is used to forecast the defect to be moved by a QC activity for each product. Metrics Project Replanned Defect Rate = Previous Project Planned Defect Rate * (1+ Average Project Defect found Deviation in previuos stages). Product Replanned Defect Rate = Previous Product Planned Defect Rate * (1+ Average Defect found Deviation in released products). Help At the end of each stage for Project Defect. After the releasing of each product for Product Defect.
Analysis tools: Cause-Effect Purpose It help to accurately identify causes (or results) of a problem. Help Brainstorming. Test Code Design Analysis SQA Technology Team Time Defect rate is high
Analysis tools: Pareto Chart Purpose It helps identify most important issues by data. Help The rule 80:20.
Analysis tools: Control Chart Purpose It helps to define and forecast uncontrolled cases. Help Average, Stdev, UCL, LCL of series of data Color statuses of metrics (RED, YELLOW, BLUE)
Fsoft PCBs: PCB: Process capability baseline Based on data of post mortem projects and support activities 1.0: June 30, 2001 Release Period: Quarterly, 6 months, Annually Prepared by SEPG, reviewed and approved by BOM Fsoft norms Based on PCBs and Fsoft business goals Established for 6 months Suggested by SEPG, reviewed and approved by BOD Fsoft PCBs and Norms
All projects have postmortem in the reporting period Methodology: Average, Sigma, UCL, LCL Causal analysis of out of control limits Extraordinary cases are excluded Summary: The PCB of the period before the last period, the last PCB Last norms, suggested norm Improvement, issues Software PCB: Overview
Planned actions for last period Collect customer related metrics To use data effectively Results of these actions All mandatory software metrics are calculated Metrics have been used for setting project norms Issues in last period: Schedule deviation is high Review efficiency is low Suggested actions for next period Schedule estimation, customer communication, milestone control Effort for review, review workshops, review guru Software PCB: Conclusions
Software PCB: Requirement Accepted deliverable (%) 90|95| 94.4 Requirement completeness (%) 90|95| 93.83 Requirement stability (%) 7.5|5| 11.3
Software PCB: Schedule Schedule control is the most serious problem Timeliness (%) 84.9|95| 58.6 Project Schedule Deviation (%) Development: 23.5|10| 62.5 Maintenance: 5|10| 30.6 Delivery Schedule Deviation (%) Development: 13|10| 25.0 Maintenance: 5|10| 6.0
Software PCB: Effort Effort Deviation (%) Development: 29.8|10| 40.48 Maintenance: 4.9|10| 32.97 Project management effort (%) Development: 4.5|7.5| 6.33 Maintenance: 3.8|7.5| 6.78 Quality Cost (%) Development: 39|30| 34.49 Maintenance: 34.8|30| 47.66 Correction Cost (%) Development: 16.3|12| 11.65 Maintenance: 18.4|12| 12.49
Software PCB: Quality Review efficiency is too low Defect Rate (WDef/UCP): 9.5|8.5| 9.0 Leakage (WDef/UCP) 0.5|0.3| 0.4 Defect Removal Efficiency (%) Review 35|40| 36.4 Test 52|55| 57.9 Customer Satisfaction (Point) 80|85| 73.5
Software PCB: Productivity Productivity (UCP/pd) 0.43|0.4| 0.53 Review Effectiveness (WDef/pd) 13.2|15| 16.1 Test Effectiveness (WDef/pd) 8.3|10| 12.4
Fsoft norms For a period of 6 months Improvement requirements based on last PCB To use data effectively Using PCB for plan: All processes Re-estimate size: After SRS completion and at the end of the project Analysis in progress: All milestones Verification: SEPG
Fsoft norms Requirement Accepted deliverable: 95% Requirement completeness: 95% Schedule Timeliness: 85% Schedule Deviation: 10% Delivery Schedule Deviation: 10% Effort Effort Deviation: 10% Management Effort: 7.5% Quality Cost: 30% Correction Cost: 9%
Fsoft norms Quality Defect Rate: 7WDef/UCP Leakage: 0.2WDef/UCP Customer Satisfaction: 90 points Process Compliance: 3NCs Productivity Coding: 0.5UCP/pd Review: 15WDef/pd Test: 12WDef/pd
S ources & references S ources Fsoft manual Fsoft standard life cycle models and tailoring guidelines Fsoft metric guidelines Assessment and analysis tools guidelines Project database and PPM templates Fsoft process databases Fsoft PCB reports Fsoft norms Recommended readings TTVN/SYS/Fsoft QMS/document/master list TTVN/SYS/ Fsoft QMS/Data/ TTVN/SYS/ Fsoft QMS/PCB&Norm/
Questions and Answers
Conclusion Pls. give your assessment
Quiz Total 100 points = 20 questions x 5 points/question Duration: 15’ Pass criteria: 75 points Feel free to use any available material Don’t brainstorm.

Managing projects by data

  • 1.
    Managing projects bydata Version: 3.0 Author: Le The Hung Sep 05, 2005 Instructor: Thai Nguyen © 2001 FPT-SOFT 04e-BM/NS/HDCV/FSOFT
  • 2.
    Introduction Course duration:1 hour 45’ Purpose: Practical use of data for managing projects Targeted attendees: Team leaders, SEPG, SQA, project managers Tests/quiz: Quiz in 15’ for new attendants
  • 3.
    Objectives After thecourse, student will: Understand Fsoft metric system. Know about Fsoft PCBs and norms. Be able to use data for managing projects.
  • 4.
    Fsoft metric system – 45’ Fsoft PCBs and Norms – 45’ Quiz – 15’ Table of contents
  • 5.
    Why it’s needed?Metric set Analysis tools Fsoft SLC in quantitative management Fsoft metric system
  • 6.
    Why: Fsoft qualityobjective “ FPT-SOFT is committed to deliver products that fully meet customer’s requirements on schedule defined in the project plan”
  • 7.
    Why: International standardsISO 9001:2000 8.2.3 Monitoring and measurement of the processes 8.4 Analysis of data CMM/SEI 1.1: PA.G1: The quantitative process management activities are planned PA.G2: The process performance of the project's defined software process is controlled quantitatively PA.G3: The process capability of the organization's standard software process is known in quantitative terms
  • 8.
    Why: International standardsCMMI/SEI 1.1: Measurement and Analysis Quantitative project management Organizational Process Performance
  • 9.
  • 10.
    Metric set: Collecteddata Effort (Project, work product, process, type of activity): Weekly Schedule (Start-date, expected end-date, actual end-date, delivery): At milestones Defect (Project, work product, stage detected, QC activities, stage injected, process origin, severity, classification type, priority): Weekly Size (Total, work product, activity): At milestones Requirement (Total, size, status): Weekly Customer complaints, customer satisfaction survey point, NC Tools : Fsoft management suite (Timesheet, DMS, NCMS, Dashboard, Fsoft Insight)
  • 11.
    Metric set: Calculatedindicators Effort (Effectiveness, deviation): Weekly Schedule (Timeliness, deviation): At milestones Defect (Defect rate, leakage): Weekly Size (Deviation): At milestones Requirement (Requirement Completeness): Weekly Productivity, customer satisfaction, process compliance, distribution (Effort, defects): At the end of project Status (Effort, Schedule, Defect): Weekly Tools : Fsoft management suite (Timesheet, DMS, NCMS, Dashboard, Fsoft Insight)
  • 12.
  • 13.
    Fsoft SLC models:Manage by data
  • 14.
    Initiation stage: Normsfor WO Overview The Initiation stage is the start of the SLC, in which: Project's software scope and boundary conditions, including the operational vision and proposed products, are established. Overall cost and schedule of the project are estimated. Potential risks are defined. Metrics Estimated size, estimated effort and planned schedule for the project. Target value of the quality goals for the project: Timeliness, Requirement Completeness, Leakage, Correct Cost, Customer Satisfaction, Process Compliance, Response Time. Actual data of the stage: Actual effort and actual schedule for the stage. Help Use Fsoft norms for overall estimating and setting goals. Record in the WO, Estimation sheets, Fsoft Insight
  • 15.
    Definition stage: PCBfor Planning Overview Studying and clarifying user requirements. Preparing and releasing SRS. Negotiating Acceptance Criteria with customer. Updating and releasing complete project plan. Metrics Estimated size for the project, estimated effort and planned schedule for the stage. Progress values of the quality goals: Timeliness, Requirement Completeness, Correct Cost. Actual data of the stage: Actual effort and actual schedule for the stage, actual size and defects of the project plan, URD and SRS. Help Use Fsoft norms for detail estimating and planning. Fill data in the Fsoft Insight Analyse by viewing the Charts/Status and log issue in the Issue table
  • 16.
    Solution stage: Reviewmetrics Overview The main purpose of this stage is to define an effective solution to meet customer requirements. Analyzing and creating a good design for the software package are the main activities. Metrics Estimated effort and planned schedule for the stage. Progress values of the quality goals : Timeliness, Completeness, Correct Cost, Process Compliance. Actual data of the stage: Actual effort and actual schedule for the stage, actual size and defects of the ADD and Test Plan. Help Use Fsoft norms for re-estimating and re-planning. Fill data in the Fsoft Insight Analyse by viewing the Charts/Status and log issue in the Issue table
  • 17.
    Construction stage: Dataanalysis Overview The goal of the construction stage is to develop the system. Coding and testing for the software package are the main activities. Metrics Estimated effort and planned schedule for the stage. Progress values of the quality goals : Timeliness, Completeness, Correct Cost, Process Compliance. Actual data of the stage: Actual effort and actual schedule for the stage, actual size and defects of the DDD, Test case and Test Data, modules and unit programs. Help Use Fsoft norms for re-estimating and re-planning. Fill data in the Fsoft Insight Analyse by viewing the Charts/Status and log issue in the Issue table
  • 18.
    Transition stage: LeakageOverview The focus of the Transition stage is to ensure that software is available for its end users. Delivering software to customer, implementing software systems on customer site and conducting test activities for acceptance are main activities of this stage. Metrics Estimated effort and planned schedule for the stage. Progress values of the quality goals: Timeliness, Completeness, Leakage, Correct Cost, Process Compliance. Actual data of the stage: Actual effort and actual schedule for the stage, actual size and defects of the software package. Help Use Fsoft norms for re-estimating and re-planning. Fill data in the Fsoft Insight Analyse by viewing the Charts/Status and log issue in the Issue table
  • 19.
    Termination stage: FsoftData Overview The project closes at this stage when customer accepts the whole project and signs off the contract. Project assets must be collected and transferred to Fsoft process asset library. The goal of this stage is to summarize the results of the project and to provide the project knowledge and experiences for other projects. Metrics Estimated effort and planned schedule for the stage. Final values of the quality goals: Timeliness, Completeness, Leakage, Correct Cost, Customer Satisfaction, Process Compliance. Actual data of the stage: Actual effort and actual schedule for the stage, customer satisfaction point. Help Compare Actual metrics with Fsoft norms and Project norms Analyse in post mortem report
  • 20.
    ETC: Estimated ToComplete Purpose It helps to monitor project progress and predict complete project metrics. Metrics Effort ETC (= Effort spent/Actual requirement completeness - Effort spent) is used to forecast the effort needed to complete project. Time ETC (= Current day + Actual duration/Actual requirement completeness – Actual duration) is used to forecast the finished day of the project. Possible leakage (=Project size * Norm of weighted defect rate – Actual weighted defects found) is used to forecast the quality of deliverables. Help Change WO if the metric deviation >=30% Re-plan if the metric deviation >=20%.
  • 21.
    PPM: Process PerformanceModels Purpose A description of the relationship among attributes of a process and its work products that are developed from historical process performance data and calibrated using collected process and product measures from the project and that are used to predict results to be achieved by following a process. Flow Select Measurement Parameters based on objective Collect Data Define Model Training Implementation of Model Collect Data Calibrate Model Select Process & Sub Process
  • 22.
    PPM: Effort PurposeEffort PPM is used to forecast the effort needed for each process in each stage. Metrics Forecasted Engineering Effort (EE) = (1- Average (EE Deviation/Requirement Completeness (RCR) deviation)*Planned EE + Average(EE deviation/RCR deviation)*Planned EE/Planned RCR*Re-planned RCR. Forecasted Management Effort = Planned ME/Planned EE*Re-planned EE Help In planning: The Fsoft norms + Project characteristics -> Planned values At the end of each stage: Actual values of metrics + Change requests -> Issues + Forecasted -> Re-planned value of metrics At the end of the project: Actual values of metric deviation -> Practices + Lessons.
  • 23.
    PPM: Defect PurposeDefect PPM is used to forecast the defect to be moved by a QC activity in each stage. Product Defect PPM is used to forecast the defect to be moved by a QC activity for each product. Metrics Project Replanned Defect Rate = Previous Project Planned Defect Rate * (1+ Average Project Defect found Deviation in previuos stages). Product Replanned Defect Rate = Previous Product Planned Defect Rate * (1+ Average Defect found Deviation in released products). Help At the end of each stage for Project Defect. After the releasing of each product for Product Defect.
  • 24.
    Analysis tools: Cause-EffectPurpose It help to accurately identify causes (or results) of a problem. Help Brainstorming. Test Code Design Analysis SQA Technology Team Time Defect rate is high
  • 25.
    Analysis tools: ParetoChart Purpose It helps identify most important issues by data. Help The rule 80:20.
  • 26.
    Analysis tools: ControlChart Purpose It helps to define and forecast uncontrolled cases. Help Average, Stdev, UCL, LCL of series of data Color statuses of metrics (RED, YELLOW, BLUE)
  • 27.
    Fsoft PCBs: PCB:Process capability baseline Based on data of post mortem projects and support activities 1.0: June 30, 2001 Release Period: Quarterly, 6 months, Annually Prepared by SEPG, reviewed and approved by BOM Fsoft norms Based on PCBs and Fsoft business goals Established for 6 months Suggested by SEPG, reviewed and approved by BOD Fsoft PCBs and Norms
  • 28.
    All projects havepostmortem in the reporting period Methodology: Average, Sigma, UCL, LCL Causal analysis of out of control limits Extraordinary cases are excluded Summary: The PCB of the period before the last period, the last PCB Last norms, suggested norm Improvement, issues Software PCB: Overview
  • 29.
    Planned actions forlast period Collect customer related metrics To use data effectively Results of these actions All mandatory software metrics are calculated Metrics have been used for setting project norms Issues in last period: Schedule deviation is high Review efficiency is low Suggested actions for next period Schedule estimation, customer communication, milestone control Effort for review, review workshops, review guru Software PCB: Conclusions
  • 30.
    Software PCB: RequirementAccepted deliverable (%) 90|95| 94.4 Requirement completeness (%) 90|95| 93.83 Requirement stability (%) 7.5|5| 11.3
  • 31.
    Software PCB: ScheduleSchedule control is the most serious problem Timeliness (%) 84.9|95| 58.6 Project Schedule Deviation (%) Development: 23.5|10| 62.5 Maintenance: 5|10| 30.6 Delivery Schedule Deviation (%) Development: 13|10| 25.0 Maintenance: 5|10| 6.0
  • 32.
    Software PCB: EffortEffort Deviation (%) Development: 29.8|10| 40.48 Maintenance: 4.9|10| 32.97 Project management effort (%) Development: 4.5|7.5| 6.33 Maintenance: 3.8|7.5| 6.78 Quality Cost (%) Development: 39|30| 34.49 Maintenance: 34.8|30| 47.66 Correction Cost (%) Development: 16.3|12| 11.65 Maintenance: 18.4|12| 12.49
  • 33.
    Software PCB: QualityReview efficiency is too low Defect Rate (WDef/UCP): 9.5|8.5| 9.0 Leakage (WDef/UCP) 0.5|0.3| 0.4 Defect Removal Efficiency (%) Review 35|40| 36.4 Test 52|55| 57.9 Customer Satisfaction (Point) 80|85| 73.5
  • 34.
    Software PCB: ProductivityProductivity (UCP/pd) 0.43|0.4| 0.53 Review Effectiveness (WDef/pd) 13.2|15| 16.1 Test Effectiveness (WDef/pd) 8.3|10| 12.4
  • 35.
    Fsoft norms Fora period of 6 months Improvement requirements based on last PCB To use data effectively Using PCB for plan: All processes Re-estimate size: After SRS completion and at the end of the project Analysis in progress: All milestones Verification: SEPG
  • 36.
    Fsoft norms RequirementAccepted deliverable: 95% Requirement completeness: 95% Schedule Timeliness: 85% Schedule Deviation: 10% Delivery Schedule Deviation: 10% Effort Effort Deviation: 10% Management Effort: 7.5% Quality Cost: 30% Correction Cost: 9%
  • 37.
    Fsoft norms QualityDefect Rate: 7WDef/UCP Leakage: 0.2WDef/UCP Customer Satisfaction: 90 points Process Compliance: 3NCs Productivity Coding: 0.5UCP/pd Review: 15WDef/pd Test: 12WDef/pd
  • 38.
    S ources &references S ources Fsoft manual Fsoft standard life cycle models and tailoring guidelines Fsoft metric guidelines Assessment and analysis tools guidelines Project database and PPM templates Fsoft process databases Fsoft PCB reports Fsoft norms Recommended readings TTVN/SYS/Fsoft QMS/document/master list TTVN/SYS/ Fsoft QMS/Data/ TTVN/SYS/ Fsoft QMS/PCB&Norm/
  • 39.
  • 40.
    Conclusion Pls. giveyour assessment
  • 41.
    Quiz Total 100points = 20 questions x 5 points/question Duration: 15’ Pass criteria: 75 points Feel free to use any available material Don’t brainstorm.