Macro environment analysis is part of a company's strategic management that enables it to analyze and identify potential opportunities and hazards that might impact the business. The goal is to prepare management in advance with information that assists them in making operational decisions.
What Is an Example of a Macro Environment?
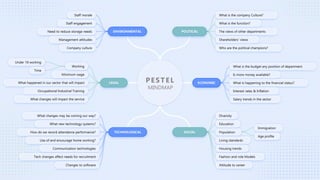
Political factors are an example of a macro-environmental force that can impact a business. These include laws or government regulations governing companies or the industry in which they operate.
Up to 40% of food crops are lost to plant pests and diseases annually.
Macro Environment Analysis HELPFUL FOR TOOLS
1. Immigration
Age profile
Diversity
Education
Population
Living standards
Housing trends
Fashion and role Models
Attitude to career
What is the budget any position of department
Is more money available?
What is happening to the financial status?
Interest rates & Inflation
Salary trends in the sector
What is the company Culture?
What is the function?
The views of other departments
Shareholders’ views
Who are the political champions?
Staff morale
Staff engagement
Need to reduce storage needs
Management attitudes
Company culture
What changes may be coming our way?
What new technology systems?
How do we record attendance performance?
Use of and encourage home working?
Communication technologies
Tech changes affect needs for recruitment
Changes to software
What happened in our sector that will impact
Minimum wage
Occupational Industrial Training
What changes will impact the service
Under 18 working
Time
Working
SOCIAL
ECONOMIC
POLITICAL
ENVIRONMENTAL
TECHNOLOGICAL
LEGAL PESTEL
MINDMAP
2. M
A
R
K
E
T
A
N
A
L
Y
S
I
S
MARKET
FORCES
Market segments
Revenue attractiveness
Needs and demand
Switching costs
Market issues
INDUSTRY
FORCES
Suppliers and other value
chain actors
Substitute products and services
Stakeholders
New entrants
(Insurgents)
Competitors
(Incumbents)
KEY TRENDS
Societal and cultural trends
Socioeconomic trends
Regulatory trends
Technology trends
MACRO-
ECONOMIC
FORCES
Economic infrastructure
Commodities and other resources
Global market conditions
Capital markets
F O R E S I G H T
M A C R O E C O N O M I C S
C
O
M
P
E
T
I
T
I
V
E
A
N
A
L
Y
S
I
S
KP CR
VP
KA CS
CH
KR
CS RS
3. 1st Tailwind
2nd Tailwind
3rd Tailwind
4th Tailwind
5th Tailwind
1st Headwind
2nd Headwind
3rd Headwind
4th Headwind
Explosive growth in investment manager businesses – particularly alternatives, customized portfolios and hybrid products
Regulatory and investor demands and costs increasing
Growth of DC plans and move to low cost products helps fuel CIT growth
New technologies solving industry issues
Investment managers business model transforming/evolving rapidly
Rise in passive investing causing increase in competition and fewer traditional active manager launches
Active manager underperformance
Significant fee pressure causing managers’ margin erosion; move to more manager/investor alignment
Increase in fintech and non-financial service industry competitors
HEADWIND
TAILWIND
4. THE SCENARIO FUNNEL
A
B
C
D
Scenario A
Pivot to emerging markets:
Leverage existing tech for new
customer segments.
Scenario B
Focus on core products: Cut non-
performing assets, double-down on
flagship solutions.
Scenario C
Mergers and acquisitions: Acquire
struggling competitors or
complementary businesses.
Scenario D
Diversify offerings: Innovate outside
tech, explore tangential sectors or
services.
HISTORIC
DATA
Today
Trends emerging issue
wild cards
Future
Option space
(Scope of possible future
developments)
5. Economic Environmental Geopolitical Societal Technological
Extreme Weather
Climate action
failure
Human
environmental
damage
Infectious
diseases
Biodiversity loss
1st 2nd 3rd 4th 5th
Digital power
concentration
Digital inequality
Interstate
rotations fracture
Cybersecurity
failure
Livelihood crises
6th 7th 8th 9th 10th
Infectious
diseases
Climate action
failure
Weapon of mass
destruction
Biodiversity loss
Natural resource
crises
1st 2nd 3rd 4th 5th
Human
environmental
damage
Livelihood crises Extreme weather Debt crises
IT infrastructure
breakdown
6th 7th 8th 9th 10th
TOP BUSINESS RISKS BY LIKELIHOOD
TOP BUSINESS RISKS BY IMPACT