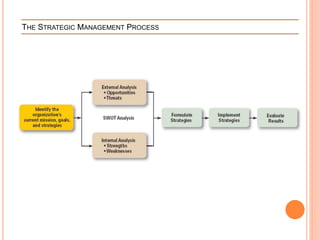
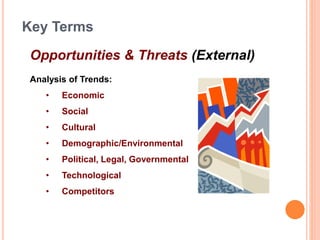
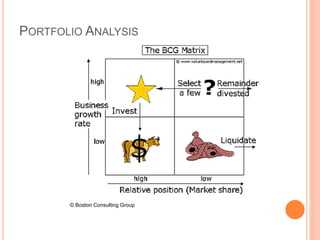
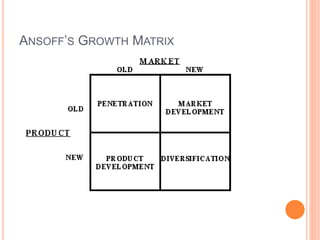
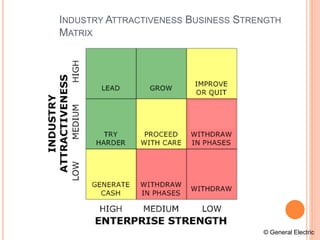
THE STRATEGIC MANAGEMENT
PROCESS
THE STRATEGIC MANAGEMENT PROCESS
Opportunities & Threats (External)
Key Terms
Analysis of Trends:
• Economic
• Social
• Cultural
• Demographic/Environmental
• Political, Legal, Governmental
• Technological
• Competitors
Strengths & Weaknesses (Internal)
Key Terms
Typically located in functional areas of the firm
• Management
• Marketing
• Finance/Accounting
• Production/Operations
• Research & Development
• Computer Information Systems
STRATEGIC MANAGEMENT PROCESS
 Step 1: Identifying the organization’s current
mission, goals, and strategies
 Mission: the firm’s reason for being
 The scope of its products and services
 Goals: the foundation for further planning
 Measurable performance targets
 Step 2: Doing an external analysis
 The environmental scanning of specific and general
environments
 Focuses on identifying opportunities and threats
STRATEGIC MANAGEMENT PROCESS
(CONT’D)
 Step 3: Doing an internal analysis
 Assessing organizational resources, capabilities, and
activities:
 Strengths create value for the customer and strengthen the
competitive position of the firm.
 Weaknesses can place the firm at a competitive disadvantage.
 Analyzing financial and physical assets is fairly easy, but
assessing intangible assets (employee’s skills, culture,
corporate reputation, and so forth) isn’t as easy.
 Steps 2 and 3 combined are called a SWOT analysis.
(Strengths, Weaknesses, Opportunities, and Threats)
STRATEGIC MANAGEMENT PROCESS
(CONT’D)
 Step 4: Formulating strategies
 Develop and evaluate strategic alternatives
 Select appropriate strategies for all levels in the
organization that provide relative advantage over
competitors
 Match organizational strengths to environmental
opportunities
 Correct weaknesses and guard against threats
STRATEGIC MANAGEMENT PROCESS
(CONT’D)
 Step 5: Implementing strategies
 Implementation: effectively fitting organizational
structure and activities to the environment.
 The environment dictates the chosen strategy;
effective strategy implementation requires an
organizational structure matched to its
requirements.
 Step 6: Evaluating results
 How effective have strategies been?
 What adjustments, if any, are necessary?
TOOLS FOR MANAGING STRATEGY
 TOWS Matrix
 BCG Matrix
 Ansoff’s Growth Matrix
 Industry Attractiveness Business Strength Matrix
 Porter’s Five Forces Model
 Porter’s Generic Strategies
 Core Competence
TOWS MATRIX
(FROM SWOT ANALYSIS)
© Prentice Hall, 2006
PORTFOLIO ANALYSIS
© Boston Consulting Group
CONTD…
 It is a comparative analysis of business potential and the evaluation of
environment. The dimension of business strength, relative market share,
will measure comparative advantage indicated by market dominance
 Star: Units having large market share. generate cash but require huge
investments. If successful, a star become a cash cow. Eg ipod
 Cash Cows: large market share, slow growing industry. Little investment &
generate cash utilized for investment in other BU. Cash cows loose, move
towards deterioration. Eg:Colgate
 Question mark: low market share, located in a high growth industry,
require huge amount of cash. Start as question mark, invest and lead
maturity. If ignored may become dogs.
 Dogs: weak market shares in low-growth markets. neither generate cash
nor require huge amount of cash. Firms have weak market share because
of high costs, poor quality, ineffective marketing.
EXAMPLES:
 Product lifecycle analysis.
 Categories based on combinations of market growth and
market share relative to the largest competitor.
 Use the link to generate BCG Matrix
http://www.marketingobjects.com/products/bcg_matrix/index.cfm
ANSOFF’S GROWTH MATRIX
INDUSTRY ATTRACTIVENESS BUSINESS STRENGTH
MATRIX
© General Electric
PORTER’S FIVE FORCES MODEL
© Porter M. E, 1980
EXAMPLE
 Similar to PEST analysis, but tends to focus on the
single, stand alone, business or SBU (Strategic
Business Unit) rather than a single product or range
of products.
 For example, Dell would analyse the market for
Business Computers i.e. one of its SBUs.
THE THREAT OF ENTRY
 Economies of scale e.g. the benefits associated with bulk purchasing.
 The high or low cost of entry e.g. how much will it cost for the latest
technology?
 Ease of access to distribution channels e.g. Do our competitors have the
distribution channels sewn up?
 Cost advantages not related to the size of the company e.g. personal
contacts or knowledge that larger companies do not own or learning
curve effects.
 Will competitors retaliate?
 Government action e.g. will new laws be introduced that will weaken our
competitive position?
 How important is differentiation? e.g. The Champagne brand cannot be
copied. This desensitises the influence of the environment.
 This is high where there a few, large players in a market e.g. the large
grocery chains.
 If there are a large number of undifferentiated, small suppliers e.g. small
farming businesses supplying the large grocery chains.
 The cost of switching between suppliers is low e.g. from one fleet
supplier of trucks to another.
THE POWER OF SUPPLIERS.
 The power of suppliers tends to be a reversal of the
power of buyers.
 Where the switching costs are high e.g. Switching
from one software supplier to another.
 Power is high where the brand is powerful e.g.
Cadillac, Pizza Hut, Microsoft.
 There is a possibility of the supplier integrating
forward e.g. Brewers buying bars.
 Customers are fragmented (not in clusters) so that
they have little bargaining power e.g. Gas/Petrol
stations in remote places.
THE THREAT OF SUBSTITUTES
 Where there is product-for-product substitution e.g.
email for fax Where there is substitution of need
e.g. better toothpaste reduces the need for dentists.
 Where there is generic substitution (competing for
the currency in your pocket) e.g. Video suppliers
compete with travel companies.
 We could always do without e.g. cigarettes.
COMPETITIVE RIVALRY
 This is most likely to be high where entry is likely;
there is the threat of substitute products, and
suppliers and buyers in the market attempt to
control.
 This is why it is always seen in the center of the
diagram.
PORTER’S GENERIC STRATEGIES
© Porter M. E, 1980
CORE COMPETENCE OF CORPORATION
Difficult to
Imitate by
competition
Wide Access
to Markets
Add value to
the customer
Core
Competence
Idea © C.K. Prahalad and Gary Hamel, 1990
RESOURCE BASED VIEW
Strategy
Competitive
advantage
Capabilities
Resources
Step 1: identify and classify firm’s
resources. Assess strengths and
weaknesses of these relative to
competitors. Identify opportunities
Step 2: identify capabilities
which are its strengths.
Identify resource inputs for it
Step 3: appraise rent gathering
potential in terms their potential
for sustained competitive
advantage and appropriability
Step 4: select a strategy which
matches. These steps Step 5: identify
resource gaps.
Invest in
replenishing,
upgrading and
augmenting
resource base.
Grant 1991

Strategic management

  • 1.
  • 2.
  • 3.
    Opportunities & Threats(External) Key Terms Analysis of Trends: • Economic • Social • Cultural • Demographic/Environmental • Political, Legal, Governmental • Technological • Competitors
  • 4.
    Strengths & Weaknesses(Internal) Key Terms Typically located in functional areas of the firm • Management • Marketing • Finance/Accounting • Production/Operations • Research & Development • Computer Information Systems
  • 5.
    STRATEGIC MANAGEMENT PROCESS Step 1: Identifying the organization’s current mission, goals, and strategies  Mission: the firm’s reason for being  The scope of its products and services  Goals: the foundation for further planning  Measurable performance targets  Step 2: Doing an external analysis  The environmental scanning of specific and general environments  Focuses on identifying opportunities and threats
  • 6.
    STRATEGIC MANAGEMENT PROCESS (CONT’D) Step 3: Doing an internal analysis  Assessing organizational resources, capabilities, and activities:  Strengths create value for the customer and strengthen the competitive position of the firm.  Weaknesses can place the firm at a competitive disadvantage.  Analyzing financial and physical assets is fairly easy, but assessing intangible assets (employee’s skills, culture, corporate reputation, and so forth) isn’t as easy.  Steps 2 and 3 combined are called a SWOT analysis. (Strengths, Weaknesses, Opportunities, and Threats)
  • 7.
    STRATEGIC MANAGEMENT PROCESS (CONT’D) Step 4: Formulating strategies  Develop and evaluate strategic alternatives  Select appropriate strategies for all levels in the organization that provide relative advantage over competitors  Match organizational strengths to environmental opportunities  Correct weaknesses and guard against threats
  • 8.
    STRATEGIC MANAGEMENT PROCESS (CONT’D) Step 5: Implementing strategies  Implementation: effectively fitting organizational structure and activities to the environment.  The environment dictates the chosen strategy; effective strategy implementation requires an organizational structure matched to its requirements.  Step 6: Evaluating results  How effective have strategies been?  What adjustments, if any, are necessary?
  • 9.
    TOOLS FOR MANAGINGSTRATEGY  TOWS Matrix  BCG Matrix  Ansoff’s Growth Matrix  Industry Attractiveness Business Strength Matrix  Porter’s Five Forces Model  Porter’s Generic Strategies  Core Competence
  • 10.
    TOWS MATRIX (FROM SWOTANALYSIS) © Prentice Hall, 2006
  • 11.
  • 12.
    CONTD…  It isa comparative analysis of business potential and the evaluation of environment. The dimension of business strength, relative market share, will measure comparative advantage indicated by market dominance  Star: Units having large market share. generate cash but require huge investments. If successful, a star become a cash cow. Eg ipod  Cash Cows: large market share, slow growing industry. Little investment & generate cash utilized for investment in other BU. Cash cows loose, move towards deterioration. Eg:Colgate  Question mark: low market share, located in a high growth industry, require huge amount of cash. Start as question mark, invest and lead maturity. If ignored may become dogs.  Dogs: weak market shares in low-growth markets. neither generate cash nor require huge amount of cash. Firms have weak market share because of high costs, poor quality, ineffective marketing.
  • 13.
    EXAMPLES:  Product lifecycleanalysis.  Categories based on combinations of market growth and market share relative to the largest competitor.  Use the link to generate BCG Matrix http://www.marketingobjects.com/products/bcg_matrix/index.cfm
  • 14.
  • 15.
    INDUSTRY ATTRACTIVENESS BUSINESSSTRENGTH MATRIX © General Electric
  • 16.
    PORTER’S FIVE FORCESMODEL © Porter M. E, 1980
  • 17.
    EXAMPLE  Similar toPEST analysis, but tends to focus on the single, stand alone, business or SBU (Strategic Business Unit) rather than a single product or range of products.  For example, Dell would analyse the market for Business Computers i.e. one of its SBUs.
  • 18.
    THE THREAT OFENTRY  Economies of scale e.g. the benefits associated with bulk purchasing.  The high or low cost of entry e.g. how much will it cost for the latest technology?  Ease of access to distribution channels e.g. Do our competitors have the distribution channels sewn up?  Cost advantages not related to the size of the company e.g. personal contacts or knowledge that larger companies do not own or learning curve effects.  Will competitors retaliate?  Government action e.g. will new laws be introduced that will weaken our competitive position?  How important is differentiation? e.g. The Champagne brand cannot be copied. This desensitises the influence of the environment.  This is high where there a few, large players in a market e.g. the large grocery chains.  If there are a large number of undifferentiated, small suppliers e.g. small farming businesses supplying the large grocery chains.  The cost of switching between suppliers is low e.g. from one fleet supplier of trucks to another.
  • 19.
    THE POWER OFSUPPLIERS.  The power of suppliers tends to be a reversal of the power of buyers.  Where the switching costs are high e.g. Switching from one software supplier to another.  Power is high where the brand is powerful e.g. Cadillac, Pizza Hut, Microsoft.  There is a possibility of the supplier integrating forward e.g. Brewers buying bars.  Customers are fragmented (not in clusters) so that they have little bargaining power e.g. Gas/Petrol stations in remote places.
  • 20.
    THE THREAT OFSUBSTITUTES  Where there is product-for-product substitution e.g. email for fax Where there is substitution of need e.g. better toothpaste reduces the need for dentists.  Where there is generic substitution (competing for the currency in your pocket) e.g. Video suppliers compete with travel companies.  We could always do without e.g. cigarettes.
  • 21.
    COMPETITIVE RIVALRY  Thisis most likely to be high where entry is likely; there is the threat of substitute products, and suppliers and buyers in the market attempt to control.  This is why it is always seen in the center of the diagram.
  • 22.
  • 23.
    CORE COMPETENCE OFCORPORATION Difficult to Imitate by competition Wide Access to Markets Add value to the customer Core Competence Idea © C.K. Prahalad and Gary Hamel, 1990
  • 24.
    RESOURCE BASED VIEW Strategy Competitive advantage Capabilities Resources Step1: identify and classify firm’s resources. Assess strengths and weaknesses of these relative to competitors. Identify opportunities Step 2: identify capabilities which are its strengths. Identify resource inputs for it Step 3: appraise rent gathering potential in terms their potential for sustained competitive advantage and appropriability Step 4: select a strategy which matches. These steps Step 5: identify resource gaps. Invest in replenishing, upgrading and augmenting resource base. Grant 1991