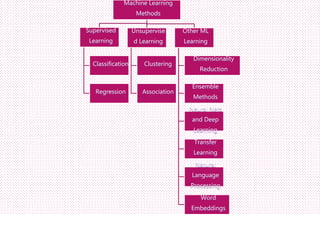
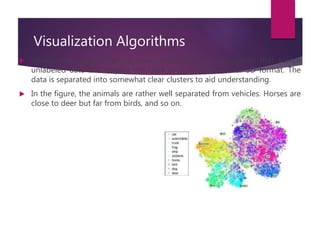
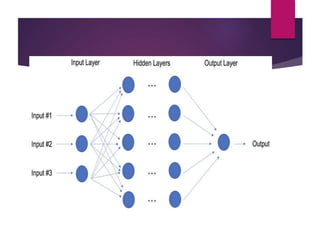
In this article you will get various methods of machine learning and techniques.
More Details https://www.fossguru.com/machine-learning-methods-and-techniques/
A Review on Subjectivity Analysis through Text Classification Using Mining Te...IJERA Editor
The increased use of web for expressing ones opinion has resulted in to an enhanced amount of subjective content available in the Web. These contents can often be categorized as social content like movie or product reviews, Customer Feedbacks, Blogs, Communication exchange in discussion forums etc. Accurate recognition of the subjective or sentimental web content has a number of benefits. Understanding of the sentiments of human masses towards different entities and products enables better services for contextual advertisements, recommendation systems and analysis of market trends. The objective behind framing this paper to analyze various sentiment based classification techniques which can be utilized for quick estimation of subjective contents of Political reviews based on politicians speech. The paper elaborately discusses supervised machine learning algorithm: Naïve Bayes classification and compares its overall accuracy, precisions as well as recall values.
This slides present the Statistical foundations in verious machine learning techniques. The intended audiance is Statistics Professionals/ students and Data Scientists.
This is my Summer internship project presentation.I have Worked on total three projects and all the brief related details are provided in the presentation.
Thanks to Eckovation.
Machine Learning Tutorial Part - 1 | Machine Learning Tutorial For Beginners ...Simplilearn
This presentation on Machine Learning will help you understand why Machine Learning came into picture, what is Machine Learning, types of Machine Learning, Machine Learning algorithms with a detailed explanation on linear regression, decision tree & support vector machine and at the end you will also see a use case implementation where we classify whether a recipe is of a cupcake or muffin using SVM algorithm. Machine learning is a core sub-area of artificial intelligence; it enables computers to get into a mode of self-learning without being explicitly programmed. When exposed to new data, these computer programs are enabled to learn, grow, change, and develop by themselves. So, to put simply, the iterative aspect of machine learning is the ability to adapt to new data independently. Now, let us get started with this Machine Learning presentation and understand what it is and why it matters.
Below topics are explained in this Machine Learning presentation:
1. Why Machine Learning?
2. What is Machine Learning?
3. Types of Machine Learning
4. Machine Learning Algorithms
- Linear Regression
- Decision Trees
- Support Vector Machine
5. Use case: Classify whether a recipe is of a cupcake or a muffin using SVM
About Simplilearn Machine Learning course:
A form of artificial intelligence, Machine Learning is revolutionizing the world of computing as well as all people’s digital interactions. Machine Learning powers such innovative automated technologies as recommendation engines, facial recognition, fraud protection and even self-driving cars. This Machine Learning course prepares engineers, data scientists and other professionals with knowledge and hands-on skills required for certification and job competency in Machine Learning.
Why learn Machine Learning?
Machine Learning is taking over the world- and with that, there is a growing need among companies for professionals to know the ins and outs of Machine Learning
The Machine Learning market size is expected to grow from USD 1.03 Billion in 2016 to USD 8.81 Billion by 2022, at a Compound Annual Growth Rate (CAGR) of 44.1% during the forecast period.
We recommend this Machine Learning training course for the following professionals in particular:
1. Developers aspiring to be a data scientist or Machine Learning engineer
2. Information architects who want to gain expertise in Machine Learning algorithms
3. Analytics professionals who want to work in Machine Learning or artificial intelligence
4. Graduates looking to build a career in data science and Machine Learning
Learn more at: https://www.simplilearn.com/
Delta Analytics is a 501(c)3 non-profit in the Bay Area. We believe that data is powerful, and that anybody should be able to harness it for change. Our teaching fellows partner with schools and organizations worldwide to work with students excited about the power of data to do good.
Welcome to the course! These modules will teach you the fundamental building blocks and the theory necessary to be a responsible machine learning practitioner in your own community. Each module focuses on accessible examples designed to teach you about good practices and the powerful (yet surprisingly simple) algorithms we use to model data.
To learn more about our mission or provide feedback, take a look at www.deltanalytics.org.
Machine learning workshop, session 3.
- Data sets
- Machine Learning Algorithms
- Algorithms by Learning Style
- Algorithms by Similarity
- People to follow
Delta Analytics is a 501(c)3 non-profit in the Bay Area. We believe that data is powerful, and that anybody should be able to harness it for change. Our teaching fellows partner with schools and organizations worldwide to work with students excited about the power of data to do good.
Welcome to the course! These modules will teach you the fundamental building blocks and the theory necessary to be a responsible machine learning practitioner in your own community. Each module focuses on accessible examples designed to teach you about good practices and the powerful (yet surprisingly simple) algorithms we use to model data.
To learn more about our mission or provide feedback, take a look at www.deltanalytics.org.
Delta Analytics is a 501(c)3 non-profit in the Bay Area. We believe that data is powerful, and that anybody should be able to harness it for change. Our teaching fellows partner with schools and organizations worldwide to work with students excited about the power of data to do good.
Welcome to the course! These modules will teach you the fundamental building blocks and the theory necessary to be a responsible machine learning practitioner in your own community. Each module focuses on accessible examples designed to teach you about good practices and the powerful (yet surprisingly simple) algorithms we use to model data.
To learn more about our mission or provide feedback, take a look at www.deltanalytics.org. If you would like to use this course content for teaching, please reach out to inquiry@deltanalytics.org
Delta Analytics is a 501(c)3 non-profit in the Bay Area. We believe that data is powerful, and that anybody should be able to harness it for change. Our teaching fellows partner with schools and organizations worldwide to work with students excited about the power of data to do good.
Welcome to the course! These modules will teach you the fundamental building blocks and the theory necessary to be a responsible machine learning practitioner in your own community. Each module focuses on accessible examples designed to teach you about good practices and the powerful (yet surprisingly simple) algorithms we use to model data.
To learn more about our mission or provide feedback, take a look at www.deltanalytics.org. If you would like to use this material to further our mission of improving access to machine learning. Education please reach out to inquiry@deltanalytics.org.
Module 4: Model Selection and EvaluationSara Hooker
Delta Analytics is a 501(c)3 non-profit in the Bay Area. We believe that data is powerful, and that anybody should be able to harness it for change. Our teaching fellows partner with schools and organizations worldwide to work with students excited about the power of data to do good.
Welcome to the course! These modules will teach you the fundamental building blocks and the theory necessary to be a responsible machine learning practitioner in your own community. Each module focuses on accessible examples designed to teach you about good practices and the powerful (yet surprisingly simple) algorithms we use to model data.
To learn more about our mission or provide feedback, take a look at www.deltanalytics.org.
This is the most simplest and easy to understand ppt. Here you can define what is decision tree,information gain,gini impurity,steps for making decision tree there pros and cons etc which will helps you to easy understand and represent it.
In a world of data explosion, the rate of data generation and consumption is on the increasing side, there comes the buzzword - Big Data.
Big Data is the concept of fast-moving, large-volume data in varying dimensions (sources) and
highly unpredicted sources.
The 4Vs of Big Data
● Volume - Scale of Data
● Velocity - Analysis of Streaming Data
● Variety - Different forms of Data
● Veracity - Uncertainty of Data
With increasing data availability, the new trend in the industry demands not just data collection,
but making ample sense of acquired data - thereby, the concept of Data Analytics.
Taking it a step further to further make a futuristic prediction and realistic inferences - the concept
of Machine Learning.
A blend of both gives a robust analysis of data for the past, now and the future.
There is a thin line between data analytics and Machine learning which becomes very obvious
when you dig deep.
In a world of data explosion, the rate of data generation and consumption is on the increasing side,
there comes the buzzword - Big Data.
Big Data is the concept of fast-moving, large-volume data in varying dimensions (sources) and
highly unpredicted sources.
The 4Vs of Big Data
● Volume - Scale of Data
● Velocity - Analysis of Streaming Data
● Variety - Different forms of Data
● Veracity - Uncertainty of Data
With increasing data availability, the new trend in the industry demands not just data collection but making an ample sense of acquired data - thereby, the concept of Data Analytics.
Taking it a step further to further make futuristic prediction and realistic inferences - the concept
of Machine Learning.
A blend of both gives a robust analysis of data for the past, now and the future.
There is a thin line between data analytics and Machine learning which becomes very obvious
when you dig deep.
This was part of my inaugural lecture of Summer Internship on Machine Learning at NMAM Institute of Technology, Nitte on 7th June, 2018. A lot more than what was on this presentation was discussed. We spoke on the ethics of choices we make as developers, socio-cultural impact of AI and ML and the political repercussions of deploying ML and AI.
Case Study 2 SCADA WormProtecting the nation’s critical infra.docxwendolynhalbert
Case Study 2: SCADA Worm
Protecting the nation’s critical infrastructure is a major security challenge within the U.S. Likewise, the responsibility for protecting the nation’s critical infrastructure encompasses all sectors of government, including private sector cooperation. Search on the Internet for information on the SCADA Worm, such as the article located athttp://www.theregister.co.uk/2010/09/22/stuxnet_worm_weapon/.
Write a three to five (3-5) page paper in which you:
1. Describe the impact and the vulnerability of the SCADA / Stuxnet Worm on the critical infrastructure of the United States.
2. Describe the methods to mitigate the vulnerabilities, as they relate to the seven (7) domains.
3. Assess the levels of responsibility between government agencies and the private sector for mitigating threats and vulnerabilities to our critical infrastructure.
4. Assess the elements of an effective IT Security Policy Framework, and how these elements, if properly implemented, could prevent or mitigate and attack similar to the SCADA / Stuxnet Worm.
5. Use at least three (3) quality resources in this assignment. Note: Wikipedia and similar Websites do not qualify as quality resources.
Your assignment must follow these formatting requirements:
· Be typed, double spaced, using Times New Roman font (size 12), with one-inch margins on all sides; citations and references must follow APA or school-specific format. Check with your professor for any additional instructions.
· Include a cover page containing the title of the assignment, the student’s name, the professor’s name, the course title, and the date. The cover page and the reference page are not included in the required assignment page length.
The specific course learning outcomes associated with this assignment are:
· Identify the role of an information systems security (ISS) policy framework in overcoming business challenges.
· Compare and contrast the different methods, roles, responsibilities, and accountabilities of personnel, along with the governance and compliance of security policy framework.
· Describe the different ISS policies associated with the user domain.
· Analyze the different ISS policies associated with the IT infrastructure.
· Use technology and information resources to research issues in security strategy and policy formation.
· Write clearly and concisely about Information Systems Security Policy topics using proper writing mechanics and technical style conventions.
DataIDSalaryCompaMidpoint AgePerformance RatingServiceGenderRaiseDegreeGender1GrStudents: Copy the Student Data file data values into this sheet to assist in doing your weekly assignments.1601.053573485805.70METhe ongoing question that the weekly assignments will focus on is: Are males and females paid the same for equal work (under the Equal Pay Act)? 226.80.866315280703.90MBNote: to simplfy the analysis, we will assume that jobs within each grade comprise equal work.334.71.120313075513.61FB457.91.01657 ...
Short Description about machine learning.What is machine learning? specifications , categories, terminologies and applications every thing is explained in short way.
Machine Learning Interview Questions and AnswersSatyam Jaiswal
Practice Best Machine Learning Interview Questions and Answers for the best preparation of the machine learning interview. these questions are very popular and asked various times in machine learning interview.
This slide includes :
Types of Machine Learning
Supervised Learning
Brain
Neuron
Design a Learning System
Perspectives
Issues in Machine Learning
Learning Task
Learning as Search
Hypothesis
Version Spaces
Candidate elimination algorithm
linear Discriminant
Perception
Linear Separability
Linear Regression
Unsupervised Learning
Reinforcement Learning
Evolutionary Learning
Similar to Machine learning Method and techniques (20)
Let's dive deeper into the world of ODC! Ricardo Alves (OutSystems) will join us to tell all about the new Data Fabric. After that, Sezen de Bruijn (OutSystems) will get into the details on how to best design a sturdy architecture within ODC.
Accelerate your Kubernetes clusters with Varnish CachingThijs Feryn
A presentation about the usage and availability of Varnish on Kubernetes. This talk explores the capabilities of Varnish caching and shows how to use the Varnish Helm chart to deploy it to Kubernetes.
This presentation was delivered at K8SUG Singapore. See https://feryn.eu/presentations/accelerate-your-kubernetes-clusters-with-varnish-caching-k8sug-singapore-28-2024 for more details.
Epistemic Interaction - tuning interfaces to provide information for AI supportAlan Dix
Paper presented at SYNERGY workshop at AVI 2024, Genoa, Italy. 3rd June 2024
https://alandix.com/academic/papers/synergy2024-epistemic/
As machine learning integrates deeper into human-computer interactions, the concept of epistemic interaction emerges, aiming to refine these interactions to enhance system adaptability. This approach encourages minor, intentional adjustments in user behaviour to enrich the data available for system learning. This paper introduces epistemic interaction within the context of human-system communication, illustrating how deliberate interaction design can improve system understanding and adaptation. Through concrete examples, we demonstrate the potential of epistemic interaction to significantly advance human-computer interaction by leveraging intuitive human communication strategies to inform system design and functionality, offering a novel pathway for enriching user-system engagements.
Neuro-symbolic is not enough, we need neuro-*semantic*Frank van Harmelen
Neuro-symbolic (NeSy) AI is on the rise. However, simply machine learning on just any symbolic structure is not sufficient to really harvest the gains of NeSy. These will only be gained when the symbolic structures have an actual semantics. I give an operational definition of semantics as “predictable inference”.
All of this illustrated with link prediction over knowledge graphs, but the argument is general.
Smart TV Buyer Insights Survey 2024 by 91mobiles.pdf91mobiles
91mobiles recently conducted a Smart TV Buyer Insights Survey in which we asked over 3,000 respondents about the TV they own, aspects they look at on a new TV, and their TV buying preferences.
LF Energy Webinar: Electrical Grid Modelling and Simulation Through PowSyBl -...DanBrown980551
Do you want to learn how to model and simulate an electrical network from scratch in under an hour?
Then welcome to this PowSyBl workshop, hosted by Rte, the French Transmission System Operator (TSO)!
During the webinar, you will discover the PowSyBl ecosystem as well as handle and study an electrical network through an interactive Python notebook.
PowSyBl is an open source project hosted by LF Energy, which offers a comprehensive set of features for electrical grid modelling and simulation. Among other advanced features, PowSyBl provides:
- A fully editable and extendable library for grid component modelling;
- Visualization tools to display your network;
- Grid simulation tools, such as power flows, security analyses (with or without remedial actions) and sensitivity analyses;
The framework is mostly written in Java, with a Python binding so that Python developers can access PowSyBl functionalities as well.
What you will learn during the webinar:
- For beginners: discover PowSyBl's functionalities through a quick general presentation and the notebook, without needing any expert coding skills;
- For advanced developers: master the skills to efficiently apply PowSyBl functionalities to your real-world scenarios.
Essentials of Automations: Optimizing FME Workflows with ParametersSafe Software
Are you looking to streamline your workflows and boost your projects’ efficiency? Do you find yourself searching for ways to add flexibility and control over your FME workflows? If so, you’re in the right place.
Join us for an insightful dive into the world of FME parameters, a critical element in optimizing workflow efficiency. This webinar marks the beginning of our three-part “Essentials of Automation” series. This first webinar is designed to equip you with the knowledge and skills to utilize parameters effectively: enhancing the flexibility, maintainability, and user control of your FME projects.
Here’s what you’ll gain:
- Essentials of FME Parameters: Understand the pivotal role of parameters, including Reader/Writer, Transformer, User, and FME Flow categories. Discover how they are the key to unlocking automation and optimization within your workflows.
- Practical Applications in FME Form: Delve into key user parameter types including choice, connections, and file URLs. Allow users to control how a workflow runs, making your workflows more reusable. Learn to import values and deliver the best user experience for your workflows while enhancing accuracy.
- Optimization Strategies in FME Flow: Explore the creation and strategic deployment of parameters in FME Flow, including the use of deployment and geometry parameters, to maximize workflow efficiency.
- Pro Tips for Success: Gain insights on parameterizing connections and leveraging new features like Conditional Visibility for clarity and simplicity.
We’ll wrap up with a glimpse into future webinars, followed by a Q&A session to address your specific questions surrounding this topic.
Don’t miss this opportunity to elevate your FME expertise and drive your projects to new heights of efficiency.
2. Objectives
Let us look at some of the objectives under this
Techniques of Machine Learning tutorial.
Explain unsupervised learning with examples
Describe semi-supervised learning and reinforcement
learning
Discuss supervised learning with examples
Define some important models and techniques in
Machine Learning
3. How do Machines learn?
There are various methods to do that. Which method to
follow completely depends on the problem statement.
Depending on the dataset, and our problem, there are
two different ways to go deeper. One is supervised
learning and the other is unsupervised learning. The
following chart explains the further classification of
machine learning methods. We will discuss them one by
one.
5. What is Supervised Learning?
Supervised Learning is a type of Machine Learning used
to learn models from labeled training data. It allows us to
predict the output for future or unseen data.
6. Understanding the Algorithm of
Supervised Learning
The image above explains the relationship
between input and output data of
Supervised Learning.
7. Supervised Learning Flow
Let’s look at the steps of Supervised Learning flow:
Data Preparation
Training Step
Evaluation or Test Step
Production Deployment
8. Testing the Algorithm
Given below are the steps for testing the algorithm of Supervised
Learning.
Once the algorithm is trained, test it with test data (a set of data
instances that do not appear in the training set).
A well-trained algorithm can predict well for new test data.
If the learning is poor, we have an underfit situation. The algorithm
will not work well on test data. Retraining may be needed to find a
better fit.
If learning on training data is too intensive, it may lead to overfitting
– a situation where the algorithm is not able to handle new testing
data that it has not seen before. The technique to keep data generic
is called regularization.
9. Examples of Supervised Learning
Example 1: Voice Assistants like Apple Siri, Amazon Alexa,
Microsoft Cortana, and Google Assistant are trained to
understand human speech and intent. Based on human
interactions, these chatbots take appropriate action.
Example 2: Gmail filters a new email into Inbox (normal)
or Junk folder (Spam) based on past information about
what you consider spam.
Example 3: The predictions made by weather apps at a
given time are based on some prior knowledge and
analysis of how the weather has been over a period of
time for a particular place.
10. Types of Supervised Learning
Given below are 2 types of Supervised Learning.
Classification
Regression
11. Classification
When the output variable is categorical like two or more
classes we make the use of classification. Here the answer is
set like true/false and yes or no. The output comes based on
the category like black or white, male or female and fit or
unfit.
Classification is a problem that is used to predict which class
a data point is part of which is usually a discrete value. From
the example I gave above, predicting whether a person is
likely to default on a loan or not is an example of a
classification problem since the classes we want to predict
are discrete: “likely to pay a loan” and “not likely to pay a
loan”.
12. Classification: predicting a
class/label
Classification is used to predict a discrete class or
label(Y). Classification basically involves assigning new
input variables (X) to the class to which they most likely
belong in based on a classification model that was built
from the training data that was already labeled. Labeled
data is used to train a classifier so that the algorithm
performs well on data that does not have a label(not yet
labeled). Repeating this process of training a classifier on
already labeled data is known as “learning”.
13. Some of the questions that a classification model helps to
answer are:
Is this a picture of a cat or a dog?
Is this email Spam or not?
Is it going to rain or not?
Is this borrower going to repay their loan?
Is this post negative or positive?
What is the genre of this song/movie?
Which type of gene is this?
14. Classification is again divided into three other categories
or problems which are: Binary classification, Multi-
class/Multinomial classification and Multi-label
classification.
15. Binary classification
This is a task of classifying the elements/input variables
of a given set into two groups i.e predicting which of the
two groups each variable belongs to. Problems like
predicting whether a picture is of a cat or dog or
predicting whether an email is Spam or not are Binary
classification problems.
16. Multi-class/Multinomial
classification
This is the task of classifying elements/ input variables
into one of three or more classes/groups. Contrary to
binary classification where elements are classified into
one of two classes. Some use cases of this type of
classification can be: classifying news into different
categories(sports/entertainment/political), sentiment
analysis;classifying text into either positive negative or
neutral, segmenting customers for marketing
purposes etc.
17. Note that sentiment analysis can either be a binary
classification or a multi-class classification depending on
the number of classes you want to be used to classify text
elements. In binary, one would predict whether a
statement is “negative” or “positive”, while in multi-class,
one would have other classes to predict such as sadness,
happiness, fear/surprise and anger/disgust.
18. Multi-label classification
This classification problem can be easily confused with
the multi-class classification but they have a distinct
difference. Multi-label is a generalization of multi-class
which is a single-label problem of categorizing instances
into precisely one of more than two classes. In this case,
we have more than one discrete classes.
19. Classification Algorithms
There are various classification algorithms that are used to make predictions such as:
Neural Networks — Has various use cases. An example is in Computer Vision which is done through convolutional neural
networks(CNN). You can read more on how Google classifies people and places using Computer Vision together with other use cases
on a post on Introduction to Computer Vision that my boyfriend wrote.
K-NN — K-Nearest Neighbors is often used in search applications where you are looking for “similar” items. One of the biggest use
cases of K-NN search is in the development of Recommender Systems.
Decision Trees — Decision trees are used in both regression and classification problems. A decision tree can be used to visually and
explicitly represent decisions and decision making. They can be used to assess the characteristics of a client that leads to the purchase
of a new product in a direct marketing campaign.
Random Forests — Random Forest algorithms can also be used in both regression and classification problems. It builds multiple
decision trees and merges them together to get a more accurate and stable prediction. It can be used in a number of circumstances
including image classification, recommendation engines, feature selection, etc.
Support Vector Machines(SVM) — This is a fundamental data science algorithm which can be used for both regression or classification
problems. However, it is mostly used in classification problems. It has a plethora of use cases such as face detection, handwriting
recognition and classification of images just to mention a few.
Naive Bayes — This is a simple and easy to implement algorithm. A classical use case for Naive Bayes is document classification where
it determines whether a given text document corresponds to one or more categories. It can be used in classifying whether an email is
Spam or not Spam or to classify a news article about technology, politics or sports. I’ve also previously done sentiment analysis using
Naive Bayes. You can find the notes and code here.
20. Regression
The relationship between two or more variables associated
with each other for changing the value of another variable.
For example, when you ask for a salary it depends on your
working experience. The height weight chart according to
age can be an example of regression machine learning.
Regression is a problem that is used to predict continuous
quantity output. A continuous output variable is a real-value,
such as an integer or floating point value. For example,
where classification has been used to determine whether or
not it will rain tomorrow, a regression algorithm will be used
to predict the amount of rainfall.
21. Types of Regression
Simple Linear Regression
Polynomial Regression
Support Vector Regression
Decision Tree Regression
Random Forest Regression
22. Simple Linear Regression
This is one of the most common and interesting type of Regression
technique. Here we predict a target variable Y based on the input
variable X. A linear relationship should exist between target variable
and predictor and so comes the name Linear Regression.
Consider predicting the salary of an employee based on his/her
age. We can easily identify that there seems to be a correlation
between employee’s age and salary (more the age more is the
salary). The hypothesis of linear regression is
Y=a+bX
Y represents salary, X is employee’s age and a and b are the
coefficients of equation. So in order to predict Y (salary) given X
(age), we need to know the values of a and b (the model’s
coefficients).
23. In polynomial regression, we transform the original
features into polynomial features of a given degree and
then apply Linear Regression on it. Consider the above
linear model Y = a+bX is transformed to something like
Polynomial Regression
24. Support Vector Regression
In SVR, we identify a hyperplane with maximum margin
such that maximum number of data points are within
that margin. SVRs are almost similar to SVM
classification algorithm.
25. Decision Tree Regression
Decision trees can be used for classification as well as
regression. In decision trees, at each level we need to
identify the splitting attribute. In case of regression, the
ID3 algorithm can be used to identify the splitting node
by reducing standard deviation (in classification
information gain is used).
26. Random Forest Regression
Random forest is an ensemble approach where we take into
account the predictions of several decision regression trees.
Select K random points
Identify n where n is the number of decision tree regressors to be
created. Repeat step 1 and 2 to create several regression trees.
The average of each branch is assigned to leaf node in each
decision tree.
To predict output for a variable, the average of all the predictions of
all decision trees are taken into consideration.
Random Forest prevents overfitting (which is common in decision
trees) by creating random subsets of the features and building
smaller trees using these subsets.
27. Classification Supervised Learning
Let us look at the classifications of
Supervised learning.
Answers “What class?”
Applied when the output has finite and
discrete values
Example: Social media sentiment analysis has three potential outcomes,
positive, negative, or neutral.
Example: Given the age and salary of consumers, predict whether they
will be interested in purchasing a house. You can perform this in your
lab environment with the dataset available in the LMS.
28. Regression Supervised Learning
Given below are some elements of Regression Supervised learning.
Answers “How much?”
Applied when the output is a continuous number
A simple regression algorithm: y = wx + b. Example:
the relationship between environmental
temperature (y) and humidity levels (x)
Example
Given the details of the area a house is located, predict the prices. You can
perform this in your lab environment with the dataset available in the LMS.
29. Unsupervised Learning: Case
Study
Ever wondered how NASA discovers a new heavenly body
and identifies that it is different from a previously known
astronomical object? It has no knowledge of these new
bodies but classifies them into proper categories.
NASA uses unsupervised learning to create clusters of
heavenly bodies, with each cluster containing objects of a
similar nature. Unsupervised Learning is a subset of
Machine Learning used to extract inferences from
datasets that consist of input data without labeled
responses.
30. Types of Unsupervised Learning
The 3 types of Unsupervised Learning are:
Clustering
Visualization Algorithms
Anomaly Detection
The most common unsupervised learning method is cluster
analysis. It is used to find data clusters so that each cluster
has the most closely matched data.
31. Clustering
Example: An online news portal segments articles into various categories like
Business, Technology, Sports, etc.
32. Visualization Algorithms
Visualization algorithms are unsupervised learning algorithms that accept
unlabeled data and display this data in an intuitive 2D or 3D format. The
data is separated into somewhat clear clusters to aid understanding.
In the figure, the animals are rather well separated from vehicles. Horses are
close to deer but far from birds, and so on.
33. Anomaly Detection
This algorithm detects anomalies in data without any
prior training. It can detect suspicious credit card
transactions and differentiate a criminal from a set of
people.
34. What is Semi-Supervised
Learning?
It is a hybrid approach (combination of Supervised and
Unsupervised Learning) with some labeled and some
non-labeled data.
35. Example of Semi-Supervised Learning
Google Photos automatically detects the same person in
multiple photos from a vacation trip (clustering –
unsupervised). One has to just name the person once
(supervised), and the name tag gets attached to that
person in all the photos.
36. What is Reinforcement Learning?
Reinforcement Learning is a type of Machine Learning
that allows the learning system to observe the
environment and learn the ideal behavior based on trying
to maximize some notion of cumulative reward.
37. Features of Reinforcement Learning
Some of the features of Reinforcement Learning are
mentioned below.
The learning system (agent) observes the environment,
selects and takes certain actions, and gets rewards in
return (or penalties in certain cases).
The agent learns the strategy or policy (choice of actions)
that maximizes its rewards over time.
39. Example of Reinforcement Learning
In a manufacturing unit, a robot uses deep reinforcement
learning to identify a device from one box and put it in a
container. The robot learns this by means of a rewards-
based learning system, which incentivizes it for the right
action.
40. Other Machine Learning
Dimensionality Reduction
Ensemble Methods
Neural Nets and Deep Learning
Transfer Learning
Natural Language Processing
Word Embeddings
41. Dimensionality reduction
Dimensionality reduction can be considered as
compression of a file. It means, taking out the
information which is not relevant. It reduces the
complexity of data and tries to keep the meaningful
data. For example, in image compression, we reduce
the dimensionality of the space in which the image stays
as it is without destroying too much of the meaningful
content in the image.
42. Ensemble Methods
Imagine you’ve decided to build a bicycle because you
are not feeling happy with the options available in stores
and online. You might begin by finding the best of each
part you need. Once you assemble all these great parts,
the resulting bike will outshine all the other options.
43. Ensemble methods use this same idea of combining
several predictive models (supervised ML) to get higher
quality predictions than each of the models could provide
on its own. For example, the Random Forest algorithms is
an ensemble method that combines many Decision Trees
trained with different samples of the data sets. As a result,
the quality of the predictions of a Random Forest is
higher than the quality of the predictions estimated with
a single Decision Tree.
44. Think of ensemble methods as a way to reduce the
variance and bias of a single machine learning model.
That’s important because any given model may be
accurate under certain conditions but inaccurate under
other conditions. With another model, the relative
accuracy might be reversed. By combining the two
models, the quality of the predictions is balanced out.
The great majority of top winners of Kaggle competitions
use ensemble methods of some kind. The most popular
ensemble algorithms are Random
Forest, XGBoost and LightGBM.
45. Neural Nets and Deep Learning
In contrast to linear and logistic regressions which are
considered linear models, the objective of neural
networks is to capture non-linear patterns in data by
adding layers of parameters to the model. In the image
below, the simple neural net has three inputs, a single
hidden layer with five parameters, and an output layer.
46.
47. In fact, the structure of neural networks is flexible enough
to build our well-known linear and logistic regression.
The term Deep learning comes from a neural net with
many hidden layers (see next Figure) and encapsulates a
wide variety of architectures.
48. It’s especially difficult to keep up with developments in
deep learning, in part because the research and industry
communities have doubled down on their deep learning
efforts, spawning whole new methodologies every day.
49.
50. For the best performance, deep learning techniques
require a lot of data — and a lot of compute power since
the method is self-tuning many parameters within huge
architectures. It quickly becomes clear why deep learning
practitioners need very powerful computers enhanced
with GPUs (graphical processing units).
In particular, deep learning techniques have been
extremely successful in the areas of vision (image
classification), text, audio and video. The most common
software packages for deep learning
are Tensorflow and PyTorch.
51. Transfer Learning
Let’s pretend that you’re a data scientist working in the
retail industry. You’ve spent months training a high-
quality model to classify images as shirts, t-shirts and
polos. Your new task is to build a similar model to classify
images of dresses as jeans, cargo, casual, and dress pants.
Can you transfer the knowledge built into the first model
and apply it to the second model? Yes, you can, using
Transfer Learning.
52. Transfer Learning refers to re-using part of a previously
trained neural net and adapting it to a new but similar
task. Specifically, once you train a neural net using data
for a task, you can transfer a fraction of the trained layers
and combine them with a few new layers that you can
train using the data of the new task. By adding a few
layers, the new neural net can learn and adapt quickly to
the new task.
53. The main advantage of transfer learning is that you need
less data to train the neural net, which is particularly
important because training for deep learning algorithms
is expensive in terms of both time and money
(computational resources) — and of course it’s often very
difficult to find enough labeled data for the training.
54. Let’s return to our example and assume that for the shirt
model you use a neural net with 20 hidden layers. After
running a few experiments, you realize that you can
transfer 18 of the shirt model layers and combine them
with one new layer of parameters to train on the images
of pants. The pants model would therefore have 19
hidden layers. The inputs and outputs of the two tasks are
different but the re-usable layers may be summarizing
information that is relevant to both, for example aspects
of cloth.
55. Transfer learning has become more and more popular
and there are now many solid pre-trained models
available for common deep learning tasks like image and
text classification.
56. Natural Language Processing
A huge percentage of the world’s data and knowledge is
in some form of human language. Can you imagine being
able to read and comprehend thousands of books,
articles and blogs in seconds? Obviously, computers can’t
yet fully understand human text but we can train them to
do certain tasks. For example, we can train our phones to
autocomplete our text messages or to correct misspelled
words. We can even teach a machine to have a simple
conversation with a human.
57. Natural Language Processing (NLP) is not a machine
learning method per se, but rather a widely used
technique to prepare text for machine learning. Think of
tons of text documents in a variety of formats (word,
online blogs, ….). Most of these text documents will be
full of typos, missing characters and other words that
needed to be filtered out. At the moment, the most
popular package for processing text is NLTK (Natural
Language ToolKit), created by researchers at Stanford.
58. The simplest way to map text into a numerical representation
is to compute the frequency of each word within each text
document. Think of a matrix of integers where each row
represents a text document and each column represents a
word. This matrix representation of the word frequencies is
commonly called Term Frequency Matrix (TFM). From there,
we can create another popular matrix representation of a
text document by dividing each entry on the matrix by a
weight of how important each word is within the entire
corpus of documents. We call this method Term Frequency
Inverse Document Frequency (TFIDF) and it typically works
better for machine learning tasks.
59. Word Embeddings
TFM and TFIDF are numerical representations of text
documents that only consider frequency and weighted
frequencies to represent text documents. By contrast, word
embeddings can capture the context of a word in a
document. With the word context, embeddings can quantify
the similarity between words, which in turn allows us to do
arithmetic with words.
60. Word2Vec is a method based on neural nets that maps words in
a corpus to a numerical vector. We can then use these vectors to
find synonyms, perform arithmetic operations with words, or to
represent text documents (by taking the mean of all the word
vectors in a document). For example, let’s assume that we use a
sufficiently big corpus of text documents to estimate word
embeddings. Let’s also assume that the words king, queen, man
and woman are part of the corpus. Let say that vector(‘word’) is
the numerical vector that represents the word ‘word’. To
estimate vector(‘woman’), we can perform the arithmetic
operation with vectors:
vector(‘king’) + vector(‘woman’) — vector(‘man’) ~
vector(‘queen’)
61. Arithmetic with Word (Vectors) Embeddings.
Word representations allow finding similarities between words by
computing the cosine similarity between the vector representation of
two words. The cosine similarity measures the angle between two
vectors.
We compute word embeddings using machine learning methods, but
that’s often a pre-step to applying a machine learning algorithm on top.
For instance, suppose we have access to the tweets of several thousand
Twitter users. Also suppose that we know which of these Twitter users
bought a house. To predict the probability of a new Twitter user buying a
house, we can combine Word2Vec with a logistic regression.
You can train word embeddings yourself or get a pre-trained (transfer
learning) set of word vectors. To download pre-trained word vectors in
157 different languages, take a look at FastText.