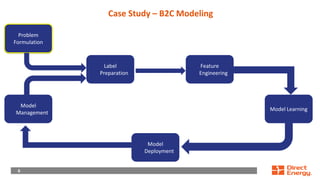
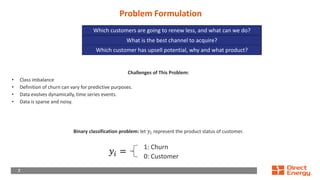
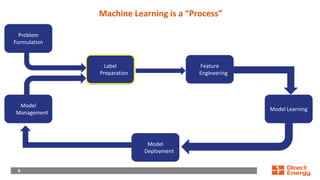
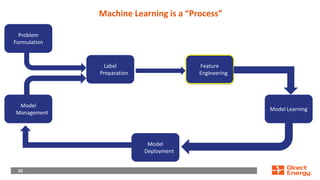
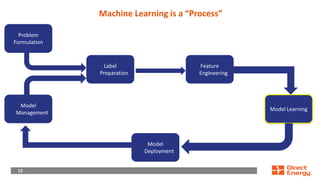
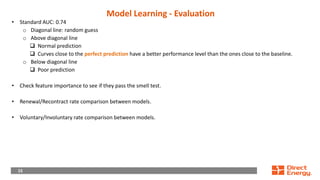
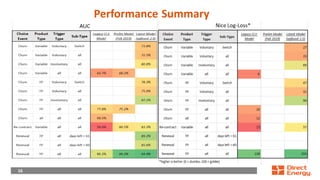
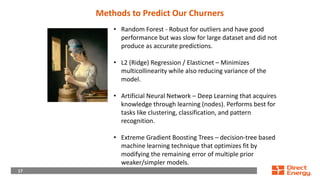
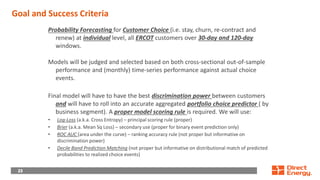
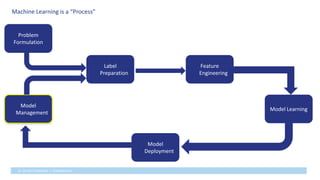
From Specs To App 10X Faster Using Reactive ProgrammingEspresso Logic
Webinar - how to build mobile, web and integration backends 10X faster using reactive programming. For transnational database applications generate an API in minutes, then add business rules using reactive programming. For the typical 5% of logic that remains, code the rest in server-side JavaScript.
OPS 571 HELP Redefined Education--ops571help.comclaric212
FOR MORE CLASSES VISIT
www.ops571help.com
a. Observe the critical path diagram. Why are there two arrows pointing to task F? b. Why is the critical path shown as A-B-E-G-I? How is the critical path defined? c. What would happen if activity F was revised to take 4 days instead of 2days?
How to Perform Churn Analysis for your Mobile Application?Tatvic Analytics
For every marketer of mobile application, acquiring new customers certainly requires more effort in terms of time and money. On the other hand, firm can always focus on maintaining existing customer base and gain maximum out of them. If this is the case, then predictive analysis will be the correct approach for this situation.
The primary goal of this webinar is to predict segment of Mobile application users,
* Who will uninstall the app
* Remain inactive (which will be also termed as a churner) for quite long time and are expected to churn.
Churn analysis is the approach by which we will predict the likelihood of this event to occur.
Our webinar covers:
* How to extract data from Google Analytics using R
* How to build churn model in R
* Identifying the customer/subscriber segment that are classified based on past data pattern, who are likely to churn (Study customer behavior Patterns)
Watch Full Webinar - http://www.tatvic.com/webinar/churn-analysis-for-mobile-application/
Tech-Talk at Bay Area Spark Meetup
Apache Spark(tm) has rapidly become a key tool for data scientists to explore, understand and transform massive datasets and to build and train advanced machine learning models. The question then becomes, how do I deploy these model to a production environment. How do I embed what I have learned into customer facing data applications. Like all things in engineering, it depends.
In this meetup, we will discuss best practices from Databricks on how our customers productionize machine learning models and do a deep dive with actual customer case studies and live demos of a few example architectures and code in Python and Scala. We will also briefly touch on what is coming in Apache Spark 2.X with model serialization and scoring options.
Production model lifecycle management 2016 09Greg Makowski
This talk covers going over the various stages of building data mining models, putting them into production and eventually replacing them. A common theme throughout are three attributes of predictive models: accuracy, generalization and description. I assert you can have it all, and having all three is important for managing the lifecycle. A subtle point is that this is a step to developing embedded, automated data mining systems which can figure out themselves when they need to be updated.
Dataset: Gather a large dataset of laptops and their features, including processor speed, RAM, storage, and display size, along with their corresponding prices.
Feature engineering: Extracting meaningful features from the dataset, such as brand, model, and year, and transforming them into a format that machine learning algorithms can use.
Model selection: Choosing the most appropriate machine learning algorithm, such as linear regression, decision tree, or random forest, based on the type of data and desired level of accuracy.
Model training: Splitting the dataset into training and testing sets, and using the training data to train the machine learning model.
Model evaluation: Testing the model's performance on the testing data and evaluating its accuracy using metrics such as mean squared error or R-squared.
Hyperparameter tuning: Optimizing the model's hyperparameters, such as learning rate or regularization strength, to achieve the best performance.
The concept of talk is as follows: - to give a general idea about user segmentation task in DMP project and how solving this problem helps our business - to tell how we use autoML to solve this task and to explain its components - to give insights about techniques we apply to make our pipeline fast and stable on huge datasets
Project Controls Expo - 31st Oct 2012 - Accurate Management Reports on 1me, e...Project Controls Expo
Contents
• Introduction to PCF
• The Challenge of Project Reporting
• Spreadsheets – the “obvious” solution – Errors and Risks
• QEI Management Reporting – Example Reports and Case Studies
Understand what value can be gained by using simulation-based predictive analytics for supply chain, distribution center, logistics and warehouse design, operations, and improvement
Understand the value of simulation based predictive analytics for distribution center, supply chain, logistics, or warehouse design, operations and performance improvement
Data Centers - Striving Within A Narrow Range - Research Report - MCG - May 2...pchutichetpong
M Capital Group (“MCG”) expects to see demand and the changing evolution of supply, facilitated through institutional investment rotation out of offices and into work from home (“WFH”), while the ever-expanding need for data storage as global internet usage expands, with experts predicting 5.3 billion users by 2023. These market factors will be underpinned by technological changes, such as progressing cloud services and edge sites, allowing the industry to see strong expected annual growth of 13% over the next 4 years.
Whilst competitive headwinds remain, represented through the recent second bankruptcy filing of Sungard, which blames “COVID-19 and other macroeconomic trends including delayed customer spending decisions, insourcing and reductions in IT spending, energy inflation and reduction in demand for certain services”, the industry has seen key adjustments, where MCG believes that engineering cost management and technological innovation will be paramount to success.
MCG reports that the more favorable market conditions expected over the next few years, helped by the winding down of pandemic restrictions and a hybrid working environment will be driving market momentum forward. The continuous injection of capital by alternative investment firms, as well as the growing infrastructural investment from cloud service providers and social media companies, whose revenues are expected to grow over 3.6x larger by value in 2026, will likely help propel center provision and innovation. These factors paint a promising picture for the industry players that offset rising input costs and adapt to new technologies.
According to M Capital Group: “Specifically, the long-term cost-saving opportunities available from the rise of remote managing will likely aid value growth for the industry. Through margin optimization and further availability of capital for reinvestment, strong players will maintain their competitive foothold, while weaker players exit the market to balance supply and demand.”
Levelwise PageRank with Loop-Based Dead End Handling Strategy : SHORT REPORT ...Subhajit Sahu
Abstract — Levelwise PageRank is an alternative method of PageRank computation which decomposes the input graph into a directed acyclic block-graph of strongly connected components, and processes them in topological order, one level at a time. This enables calculation for ranks in a distributed fashion without per-iteration communication, unlike the standard method where all vertices are processed in each iteration. It however comes with a precondition of the absence of dead ends in the input graph. Here, the native non-distributed performance of Levelwise PageRank was compared against Monolithic PageRank on a CPU as well as a GPU. To ensure a fair comparison, Monolithic PageRank was also performed on a graph where vertices were split by components. Results indicate that Levelwise PageRank is about as fast as Monolithic PageRank on the CPU, but quite a bit slower on the GPU. Slowdown on the GPU is likely caused by a large submission of small workloads, and expected to be non-issue when the computation is performed on massive graphs.
Show drafts
volume_up
Empowering the Data Analytics Ecosystem: A Laser Focus on Value
The data analytics ecosystem thrives when every component functions at its peak, unlocking the true potential of data. Here's a laser focus on key areas for an empowered ecosystem:
1. Democratize Access, Not Data:
Granular Access Controls: Provide users with self-service tools tailored to their specific needs, preventing data overload and misuse.
Data Catalogs: Implement robust data catalogs for easy discovery and understanding of available data sources.
2. Foster Collaboration with Clear Roles:
Data Mesh Architecture: Break down data silos by creating a distributed data ownership model with clear ownership and responsibilities.
Collaborative Workspaces: Utilize interactive platforms where data scientists, analysts, and domain experts can work seamlessly together.
3. Leverage Advanced Analytics Strategically:
AI-powered Automation: Automate repetitive tasks like data cleaning and feature engineering, freeing up data talent for higher-level analysis.
Right-Tool Selection: Strategically choose the most effective advanced analytics techniques (e.g., AI, ML) based on specific business problems.
4. Prioritize Data Quality with Automation:
Automated Data Validation: Implement automated data quality checks to identify and rectify errors at the source, minimizing downstream issues.
Data Lineage Tracking: Track the flow of data throughout the ecosystem, ensuring transparency and facilitating root cause analysis for errors.
5. Cultivate a Data-Driven Mindset:
Metrics-Driven Performance Management: Align KPIs and performance metrics with data-driven insights to ensure actionable decision making.
Data Storytelling Workshops: Equip stakeholders with the skills to translate complex data findings into compelling narratives that drive action.
Benefits of a Precise Ecosystem:
Sharpened Focus: Precise access and clear roles ensure everyone works with the most relevant data, maximizing efficiency.
Actionable Insights: Strategic analytics and automated quality checks lead to more reliable and actionable data insights.
Continuous Improvement: Data-driven performance management fosters a culture of learning and continuous improvement.
Sustainable Growth: Empowered by data, organizations can make informed decisions to drive sustainable growth and innovation.
By focusing on these precise actions, organizations can create an empowered data analytics ecosystem that delivers real value by driving data-driven decisions and maximizing the return on their data investment.
As Europe's leading economic powerhouse and the fourth-largest hashtag#economy globally, Germany stands at the forefront of innovation and industrial might. Renowned for its precision engineering and high-tech sectors, Germany's economic structure is heavily supported by a robust service industry, accounting for approximately 68% of its GDP. This economic clout and strategic geopolitical stance position Germany as a focal point in the global cyber threat landscape.
In the face of escalating global tensions, particularly those emanating from geopolitical disputes with nations like hashtag#Russia and hashtag#China, hashtag#Germany has witnessed a significant uptick in targeted cyber operations. Our analysis indicates a marked increase in hashtag#cyberattack sophistication aimed at critical infrastructure and key industrial sectors. These attacks range from ransomware campaigns to hashtag#AdvancedPersistentThreats (hashtag#APTs), threatening national security and business integrity.
🔑 Key findings include:
🔍 Increased frequency and complexity of cyber threats.
🔍 Escalation of state-sponsored and criminally motivated cyber operations.
🔍 Active dark web exchanges of malicious tools and tactics.
Our comprehensive report delves into these challenges, using a blend of open-source and proprietary data collection techniques. By monitoring activity on critical networks and analyzing attack patterns, our team provides a detailed overview of the threats facing German entities.
This report aims to equip stakeholders across public and private sectors with the knowledge to enhance their defensive strategies, reduce exposure to cyber risks, and reinforce Germany's resilience against cyber threats.
Chatty Kathy - UNC Bootcamp Final Project Presentation - Final Version - 5.23...John Andrews
SlideShare Description for "Chatty Kathy - UNC Bootcamp Final Project Presentation"
Title: Chatty Kathy: Enhancing Physical Activity Among Older Adults
Description:
Discover how Chatty Kathy, an innovative project developed at the UNC Bootcamp, aims to tackle the challenge of low physical activity among older adults. Our AI-driven solution uses peer interaction to boost and sustain exercise levels, significantly improving health outcomes. This presentation covers our problem statement, the rationale behind Chatty Kathy, synthetic data and persona creation, model performance metrics, a visual demonstration of the project, and potential future developments. Join us for an insightful Q&A session to explore the potential of this groundbreaking project.
Project Team: Jay Requarth, Jana Avery, John Andrews, Dr. Dick Davis II, Nee Buntoum, Nam Yeongjin & Mat Nicholas
5. 5
5
Machine Learning is a “Process”
Problem
Formulation
Model
Management
Feature
Engineering
Model Learning
Label
Preparation
Model
Deployment
6. 6
6
Case Study – B2C Modeling
Problem
Formulation
Model
Management
Feature
Engineering
Model Learning
Label
Preparation
Model
Deployment
7. 7
7
Problem Formulation
Challenges of This Problem:
• Class imbalance
• Definition of churn can vary for predictive purposes.
• Data evolves dynamically, time series events.
• Data is sparse and noisy.
Binary classification problem: let 𝑦𝑖 represent the product status of customer.
1: Churn
0: Customer
Which customers are going to renew less, and what can we do?
𝑦𝑖 =
What is the best channel to acquire?
Which customer has upsell potential, why and what product?
8. 8
8
Machine Learning is a “Process”
Problem
Formulation
Model
Management
Feature
Engineering
Model Learning
Label
Preparation
Model
Deployment
10. 10
10
Machine Learning is a “Process”
Problem
Formulation
Model
Management
Feature
Engineering
Model Learning
Label
Preparation
Model
Deployment
11. 11
11
Feature Collecting
• Feature is an individual measurable property or characteristic of a phenomenon being observed.
Demographic Features
• Demographics
• Personal interests
• Professional interests
Etc.
Behavioral Features
• Pageviews
• Account behavior
• Campaign behavior
• Professional interests
12. 12
12
Feature Engineering
• Numeric values:
• Compute basic statistics such as: sum/avg/coverage/percentiles
• Define anomaly with context: seasonal, product evolvement, etc.
• Approach: percentage change, Z-score, etc -> aware of any statistical assumption restrictions.
• Outlier in usage data: eg 25 kwh, 30,000 kwh.
• Categorical values:
• Convert to number
• One-hot-encoding: binary indicator for each categorical value
• Ordered categorical (ordinal) 1-10 -> 5, 20-30 -> 25
• Too many levels in marketing channel data which is a categorical data.
o Ex. product channel product_channel_is_ptc : {0,1}
product_channel_is_energyorgre: {0,1}
Interactions
• Cross-products of feature types, ex.
o {𝑒𝑛𝑒𝑟𝑔𝑦𝑟𝑎𝑡𝑒𝑆𝐹𝐻} X {𝑢𝑠𝑎𝑔𝑒 𝑎𝑚𝑜𝑢𝑛𝑡𝐵𝑟𝑎𝑛𝑑}
13. 13
13
Machine Learning is a “Process”
Problem
Formulation
Model
Management
Feature
Engineering
Model Learning
Label
Preparation
Model
Deployment
14. 14
14
Model Learning
• Stable model, so we chose Gradient Boosting Machines (GMB).
• GBM is unique compared to other decision tree algorithms because it builds models sequentially with higher weights given to those
cases that were poorly predicted in previous models.
• Giving higher weights to poorly predicted cases improves accuracy incrementally instead of simply taking an average of all models
like a random forest algorithm.
• By reducing the error iteratively to produce what will become the final model, GBM is an efficient and powerful algorithm for
classification and regression problems.
• Hyperparameter tips:
o Number of trees:
❑ Large data needs many trees.
❑ Many features needs many trees.
❑ More trees will reduce bias but also comes with more computational costs.
• Compare error rate in training set and in the validation set to catch possible overfitting/bias.
15. 15
15
Model Learning - Evaluation
• Standard AUC: 0.74
o Diagonal line: random guess
o Above diagonal line
❑ Normal prediction
❑ Curves close to the perfect prediction have a better performance level than the ones close to the baseline.
o Below diagonal line
❑ Poor prediction
• Check feature importance to see if they pass the smell test.
• Renewal/Recontract rate comparison between models.
• Voluntary/Involuntary rate comparison between models.
17. 17
Methods to Predict Our Churners
• Random Forest - Robust for outliers and have good
performance but was slow for large dataset and did not
produce as accurate predictions.
• L2 (Ridge) Regression / Elasticnet – Minimizes
multicollinearity while also reducing variance of the
model.
• Artificial Neural Network – Deep Learning that acquires
knowledge through learning (nodes). Performs best for
tasks like clustering, classification, and pattern
recognition.
• Extreme Gradient Boosting Trees – decision-tree based
machine learning technique that optimizes fit by
modifying the remaining error of multiple prior
weaker/simpler models.
18. 18
18
Machine Learning is a “Process”
Problem
Formulation
Model
Management
Feature
Engineering
Model Learning
Label
Preparation
Model
Deployment
20. 20
20
Model Deployment Paths
Mleap
• Better for real-time prediction of a small number of
records
• Doesn't require Spark session, portable to apps/devices
that support JVM
Spark ML Persistence
•Appropriate for batch jobs, scoring lots of records at
once
•Requires Spark session
21. 21
21
Model Deployment Paths
Towards a better deployment story
Data Scientist: Hey this logistic regression churn model is ready to go! Here is the parquet file, and here is the documentation you need to
use it.
Big Data Engineer: Awesome! We won't need to write a bazillion if-else statements to recreate the model!
When the model needs updating...
Data Scientist: We decided to use a GBM instead for better log loss error, here's the updated bundle file.
Big Data Engineer: Fantabulous! All we need to do is update the model directory!
Source: https://sais2018.netlify.com/#39
22. 22
22
22
Streams of Work
• Data: Bring in (link to modelling data-set)
remaining items on Data Sources List.
• Modelling :
• New ML approaches
• Model non-linearities (eg. cubic
spline) in key continuous vars
• Model factor interactions
• Further tuning of models
• Combination/ensemble models
• Time-Series models for precision tuning of portfolio-level predictions
• Extended Problem (2019 H2+ start): Estimate effects of main factors on choice probabilities (customer
specific factors, DE-controlled factors & external factors)
23. 23
23
23
Goal and Success Criteria
Probability Forecasting for Customer Choice (i.e. stay, churn, re-contract and
renew) at individual level, all ERCOT customers over 30-day and 120-day
windows.
Models will be judged and selected based on both cross-sectional out-of-sample
performance and (monthly) time-series performance against actual choice
events.
Final model will have to have the best discrimination power between customers
and will have to roll into an accurate aggregated portfolio choice predictor ( by
business segment). A proper model scoring rule is required. We will use:
• Log-Loss (a.k.a. Cross Entropy) – principal scoring rule (proper)
• Brier (a.k.a. Mean Sq Loss) – secondary use (proper for binary event prediction only)
• ROC AUC (area under the curve) – ranking accuracy rule (not proper but informative on
discrimination power)
• Decile Band Prediction Matching (not proper but informative on distributional match of predicted
probabilities to realized choice events)
24. 24 DO NOT FORWARD | CONFIDENTIAL
Machine Learning is a “Process”
Problem
Formulation
Model
Management
Feature
Engineering
Model Learning
Label
Preparation
Model
Deployment
25. 25
25
Model Deployment - Management
• Schedule and run the scoring weekly.
• Need to score customer accounts as well as “new” customer accounts for completeness. Do customers with invoice
score higher?
• After each scoring do some sniff test, ex. Are early tenure customers lining up as expected?
• Monitor model/feature performance.
• Refresh model as needed.
• Weekly review new wins/losses by segment.
26. 26
26
Model Interpretation
Voluntary Score = 0.6
Roxanne
Score = 0.9
Aimee
Score = 0.9
Involuntary Score = 0.2
Recontract Score = 0.1
Voluntary Score = 0.1
Involuntary Score = 0.3
Renewal Score = 0.5
…Take advantage of our summer savings with a X$ bill discount. … Do you know about DE’s new Echo Dot plan?
27. 27
27
Common Pitfalls and Challenges
Problem
Formulation
Model
Management
Feature
Engineering
Model
Learning
Label
Preparation
Model
Deployment
-Label Quality/ Noise
-Class Imbalance
-Model Degradation
-Feature quality monitoring
-Data quality
-Categorical Data
-Missing Data
-Outliers
-High Dimensionality
-Overfitting
-Scalability, speed, fast iteration
-Model Interpretation
-A/B testing
-Dependencies
28. 28
Wrap Up
Inspirations/other talks to check out
•“Big data analytics and machine learning techniques to drive and grow
business" BigDataAnalyticwsandMLTechniques Micheal Lie, Chi-Yi Kuan, Wei Di, Burcu Baran
•“From Prototyping to Deployment at Scale with R and sparklyr" https://sais2018.netlify.com/#1 Kevin Kuo
•"MLeap and Combust ML" https://youtu.be/MGZDF6E41r4 Hollin Wilkins and Mikhail Semeniuk