Downloaded 75 times


![Preprocess
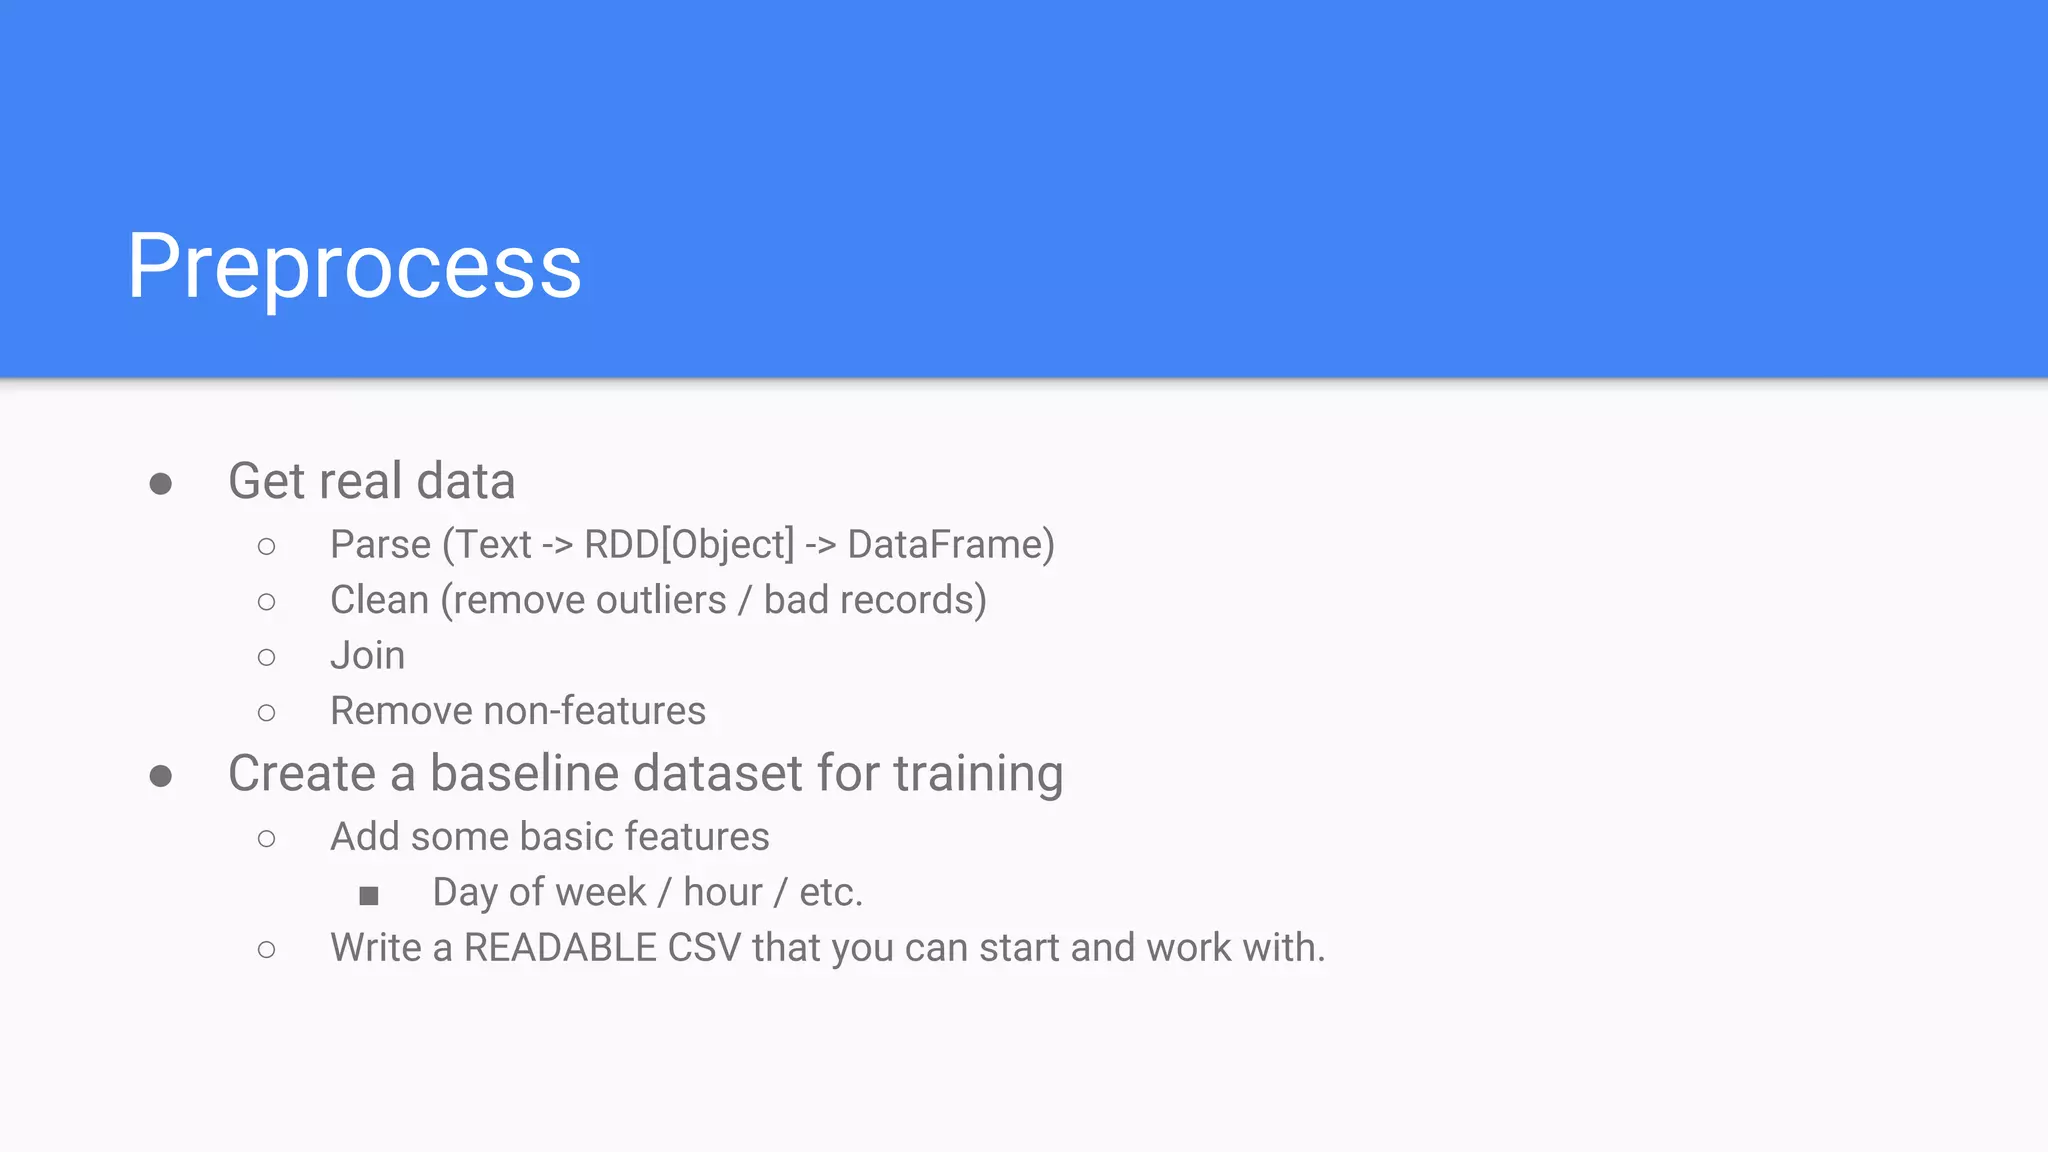
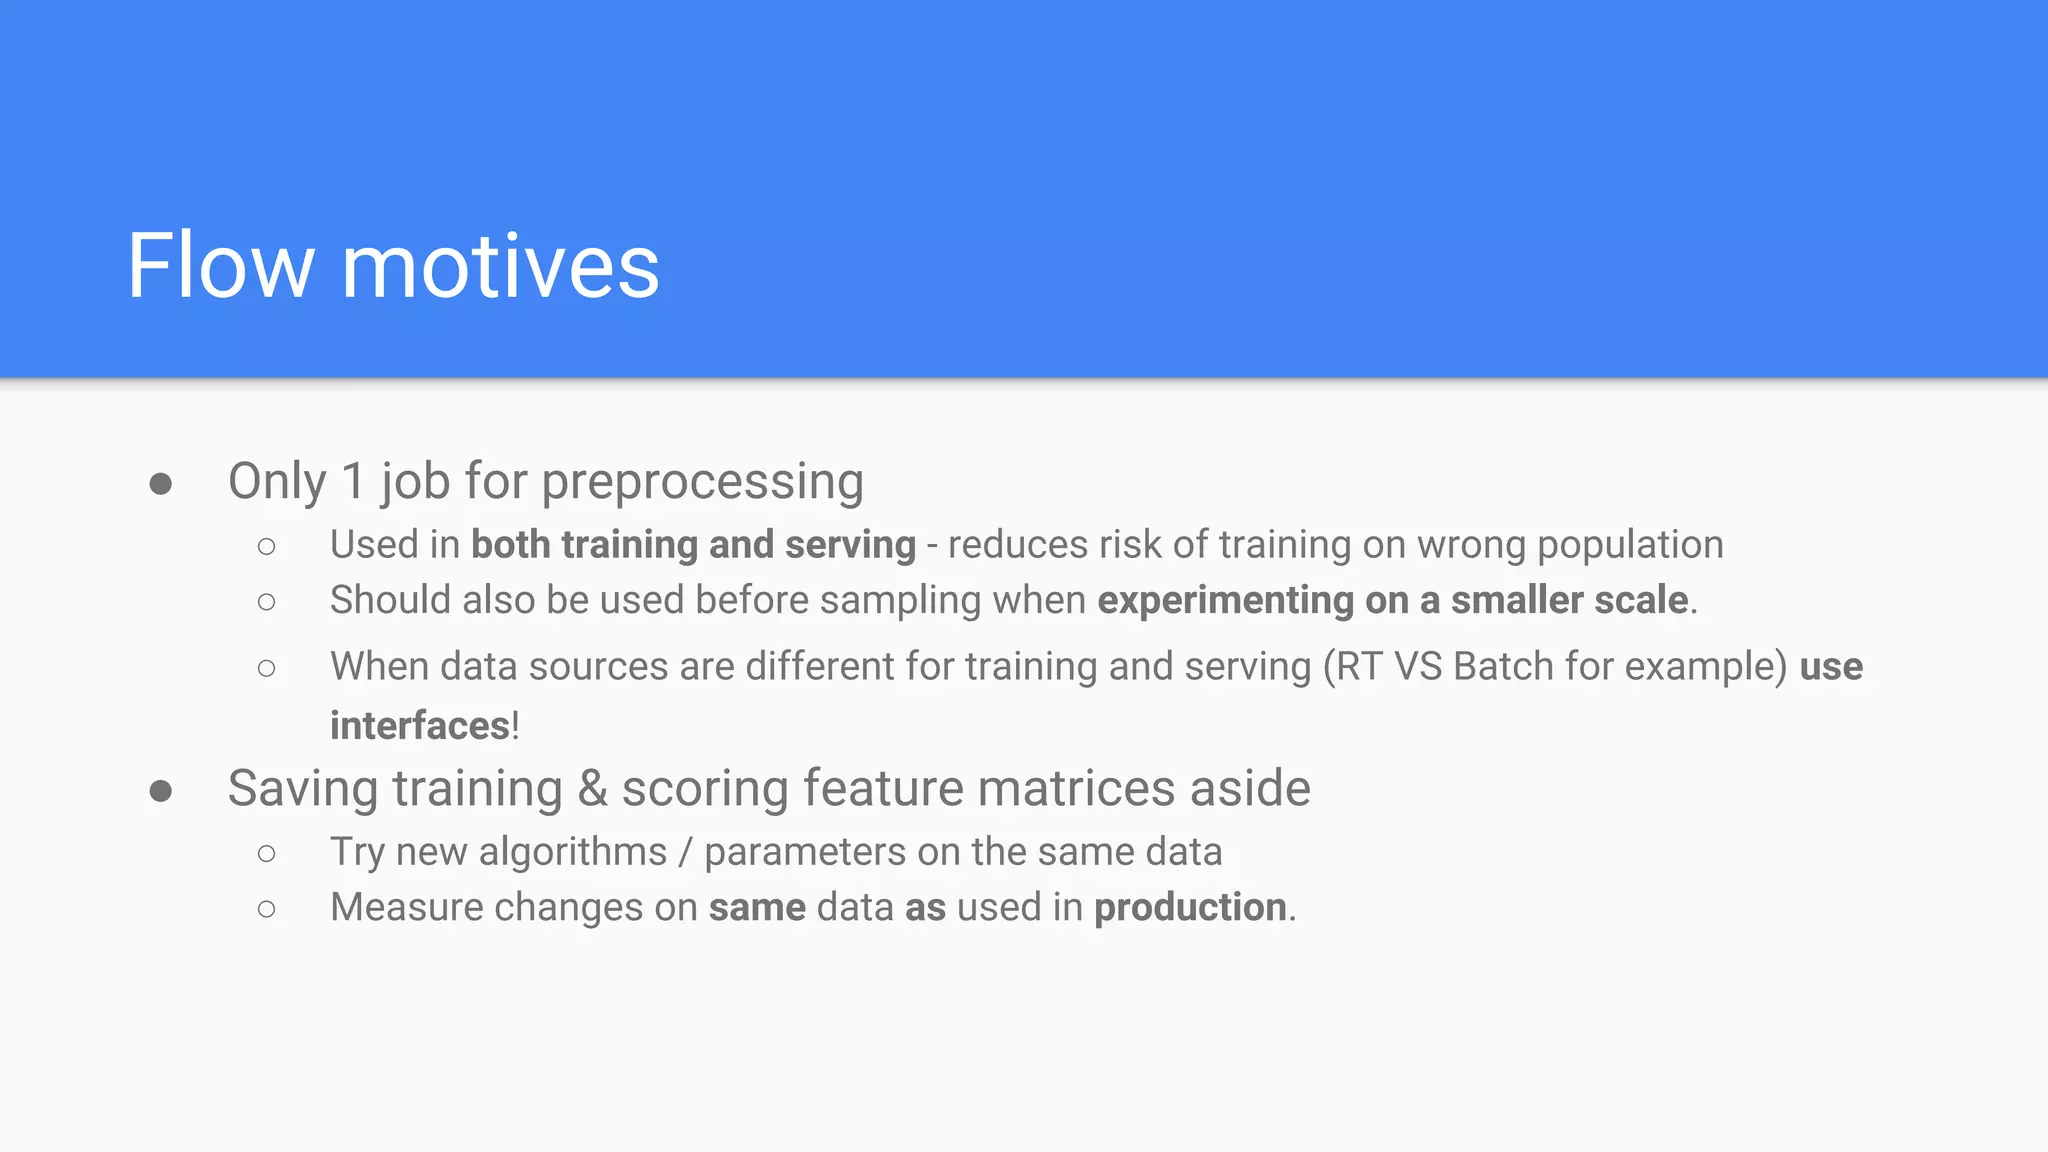
● Naive feature matrix
○ Parse (Text -> RDD[Object] -> DataFrame)
○ Clean (remove outliers / bad records)
○ Join
○ Remove non-features
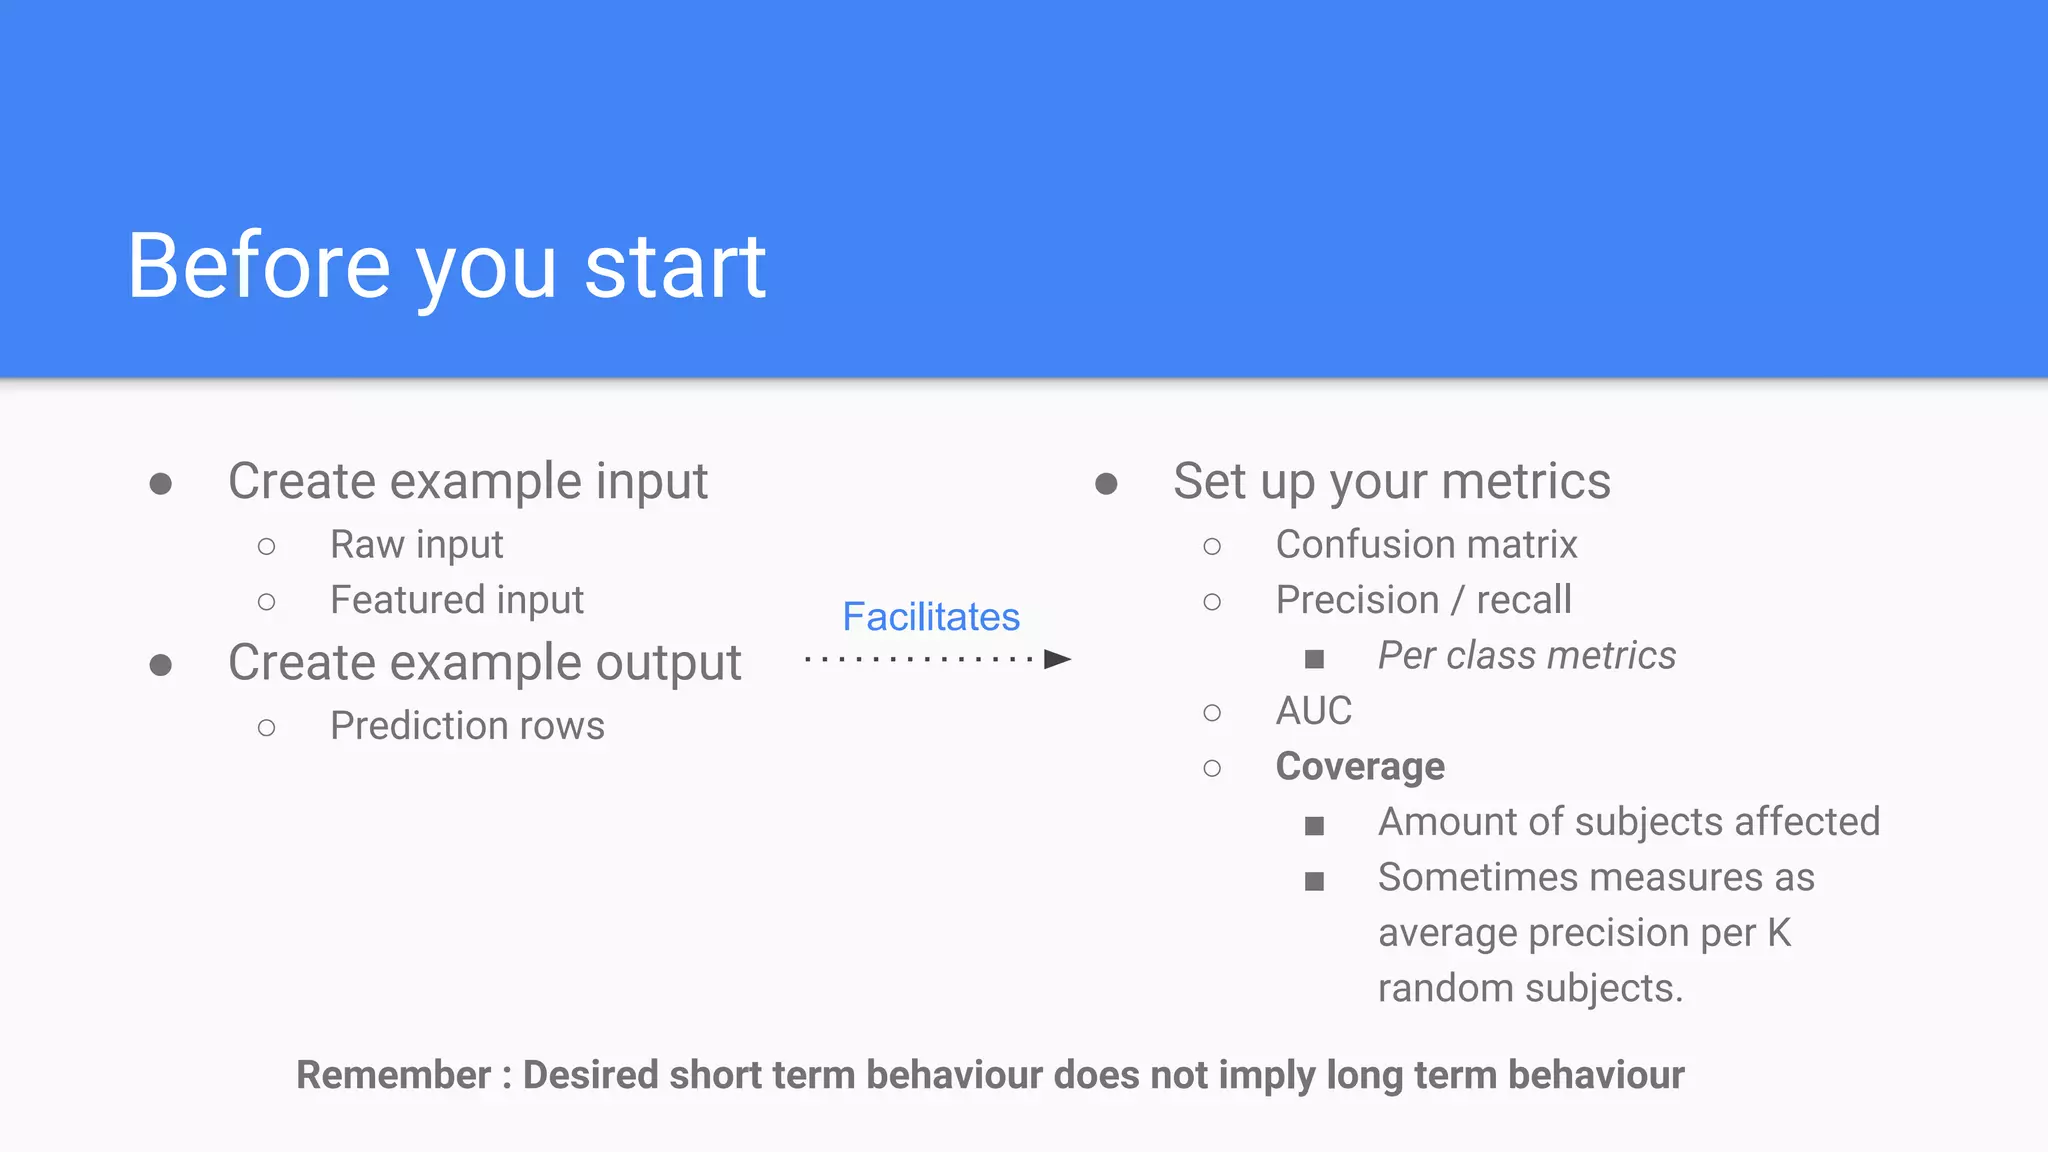
● Get real data
● Create a baseline dataset for training
○ Add some basic features
■ Day of week / hour / etc.
○ Write a READABLE CSV that you can start and work with.](https://image.slidesharecdn.com/bigmlwithsparktoproduction-160530111447/75/Production-Ready-BIG-ML-Workflows-from-zero-to-hero-17-2048.jpg)
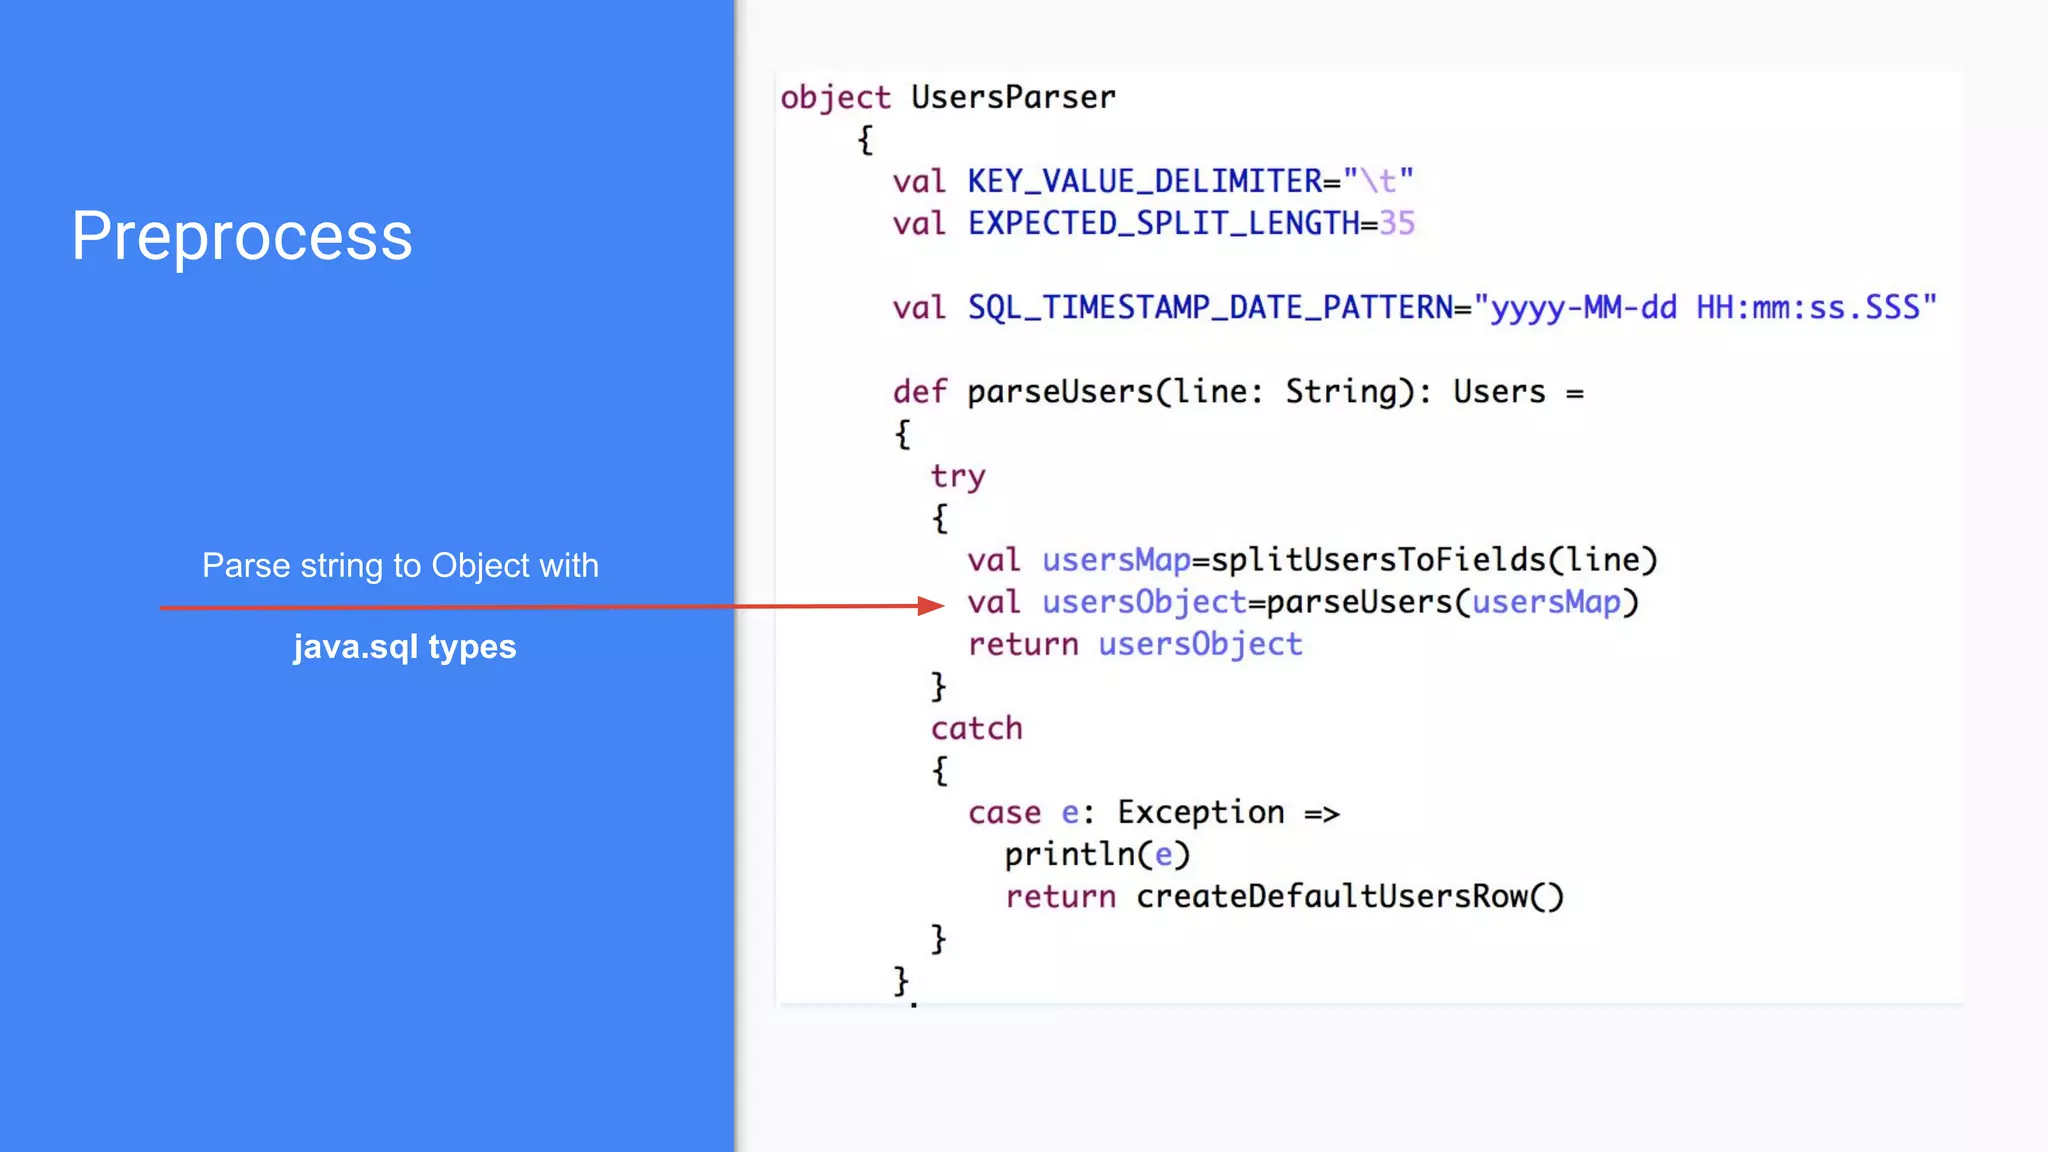
![Preprocess
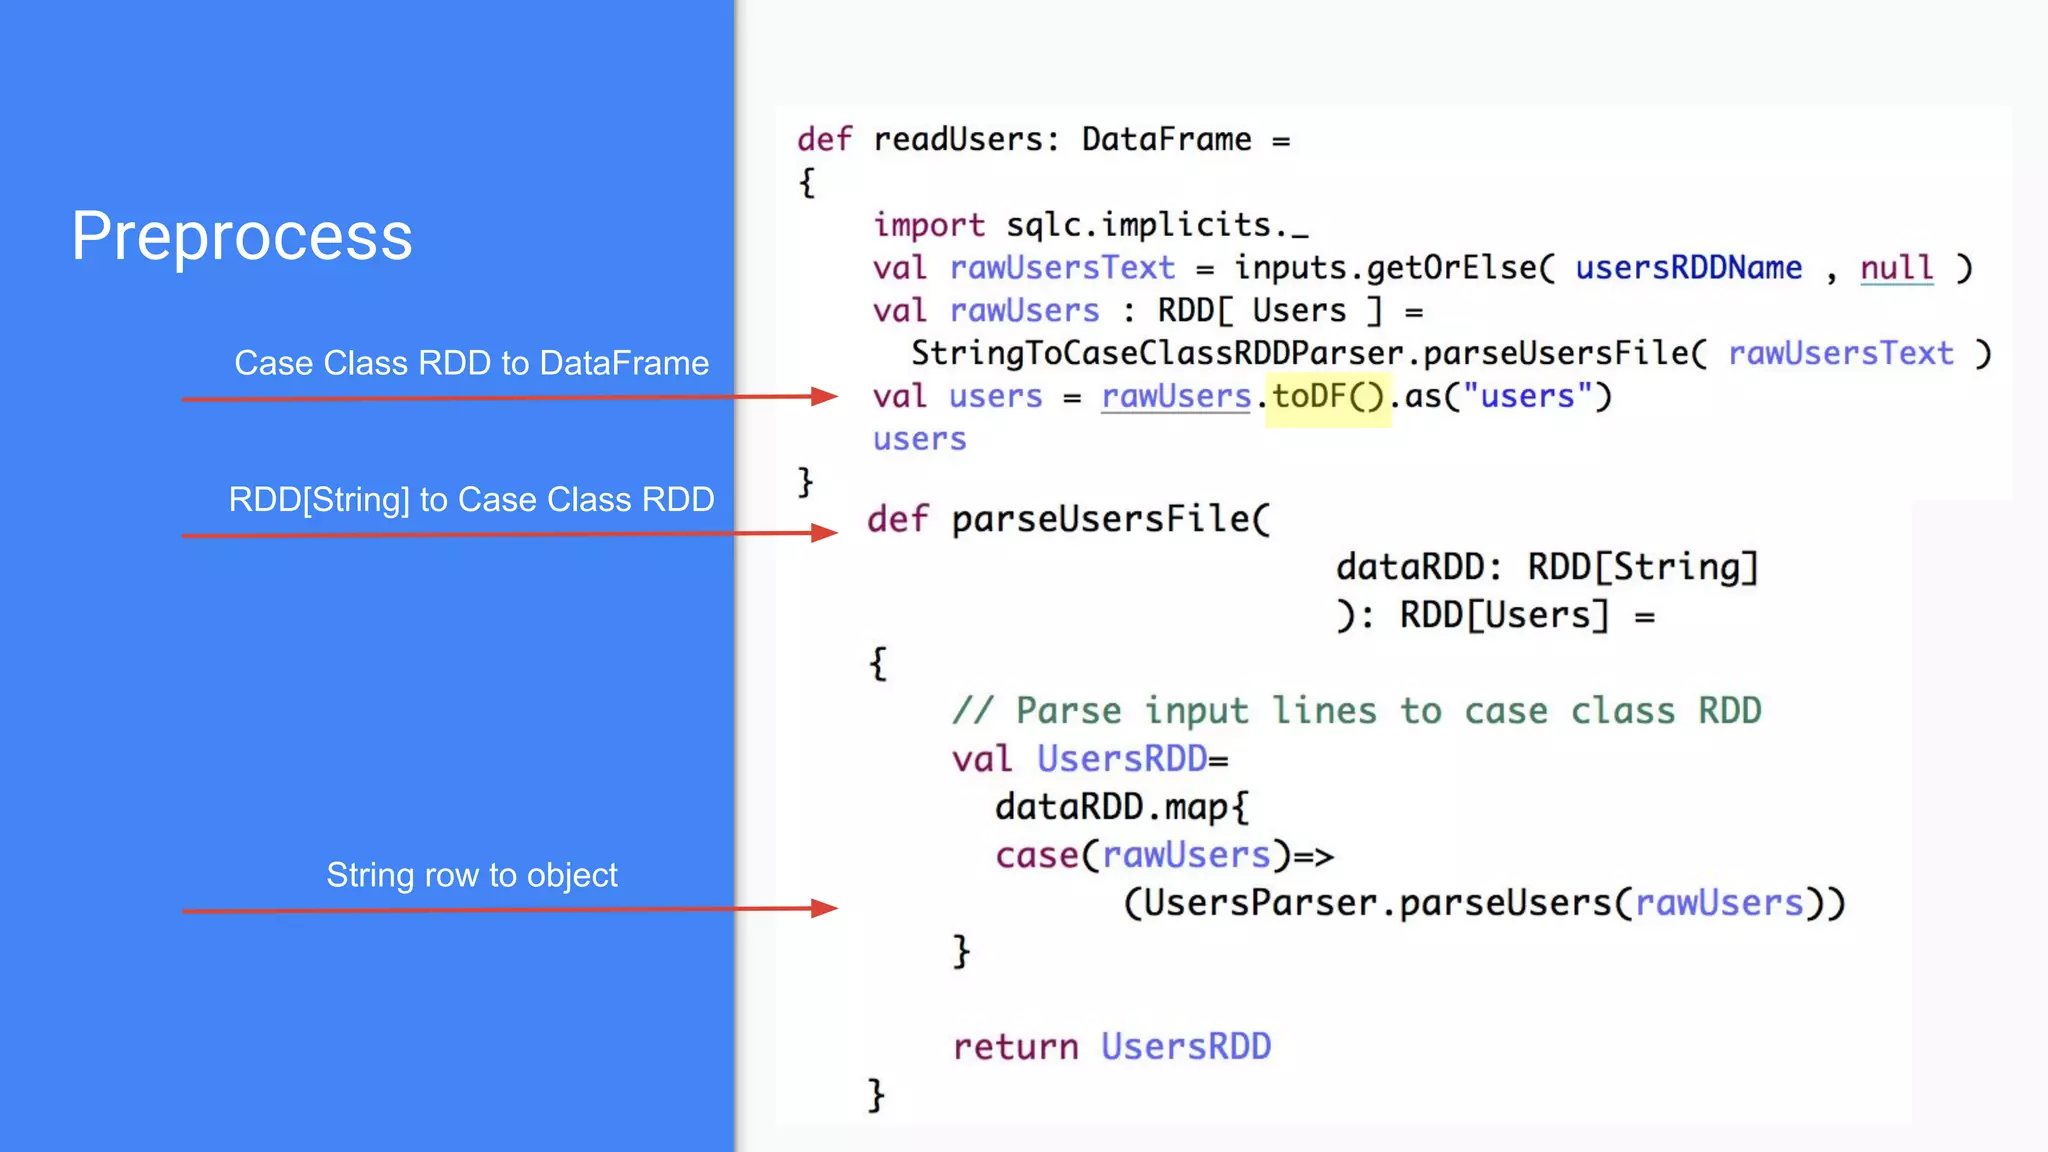
Case Class RDD to DataFrame
RDD[String] to Case Class RDD
String row to object](https://image.slidesharecdn.com/bigmlwithsparktoproduction-160530111447/75/Production-Ready-BIG-ML-Workflows-from-zero-to-hero-18-2048.jpg)
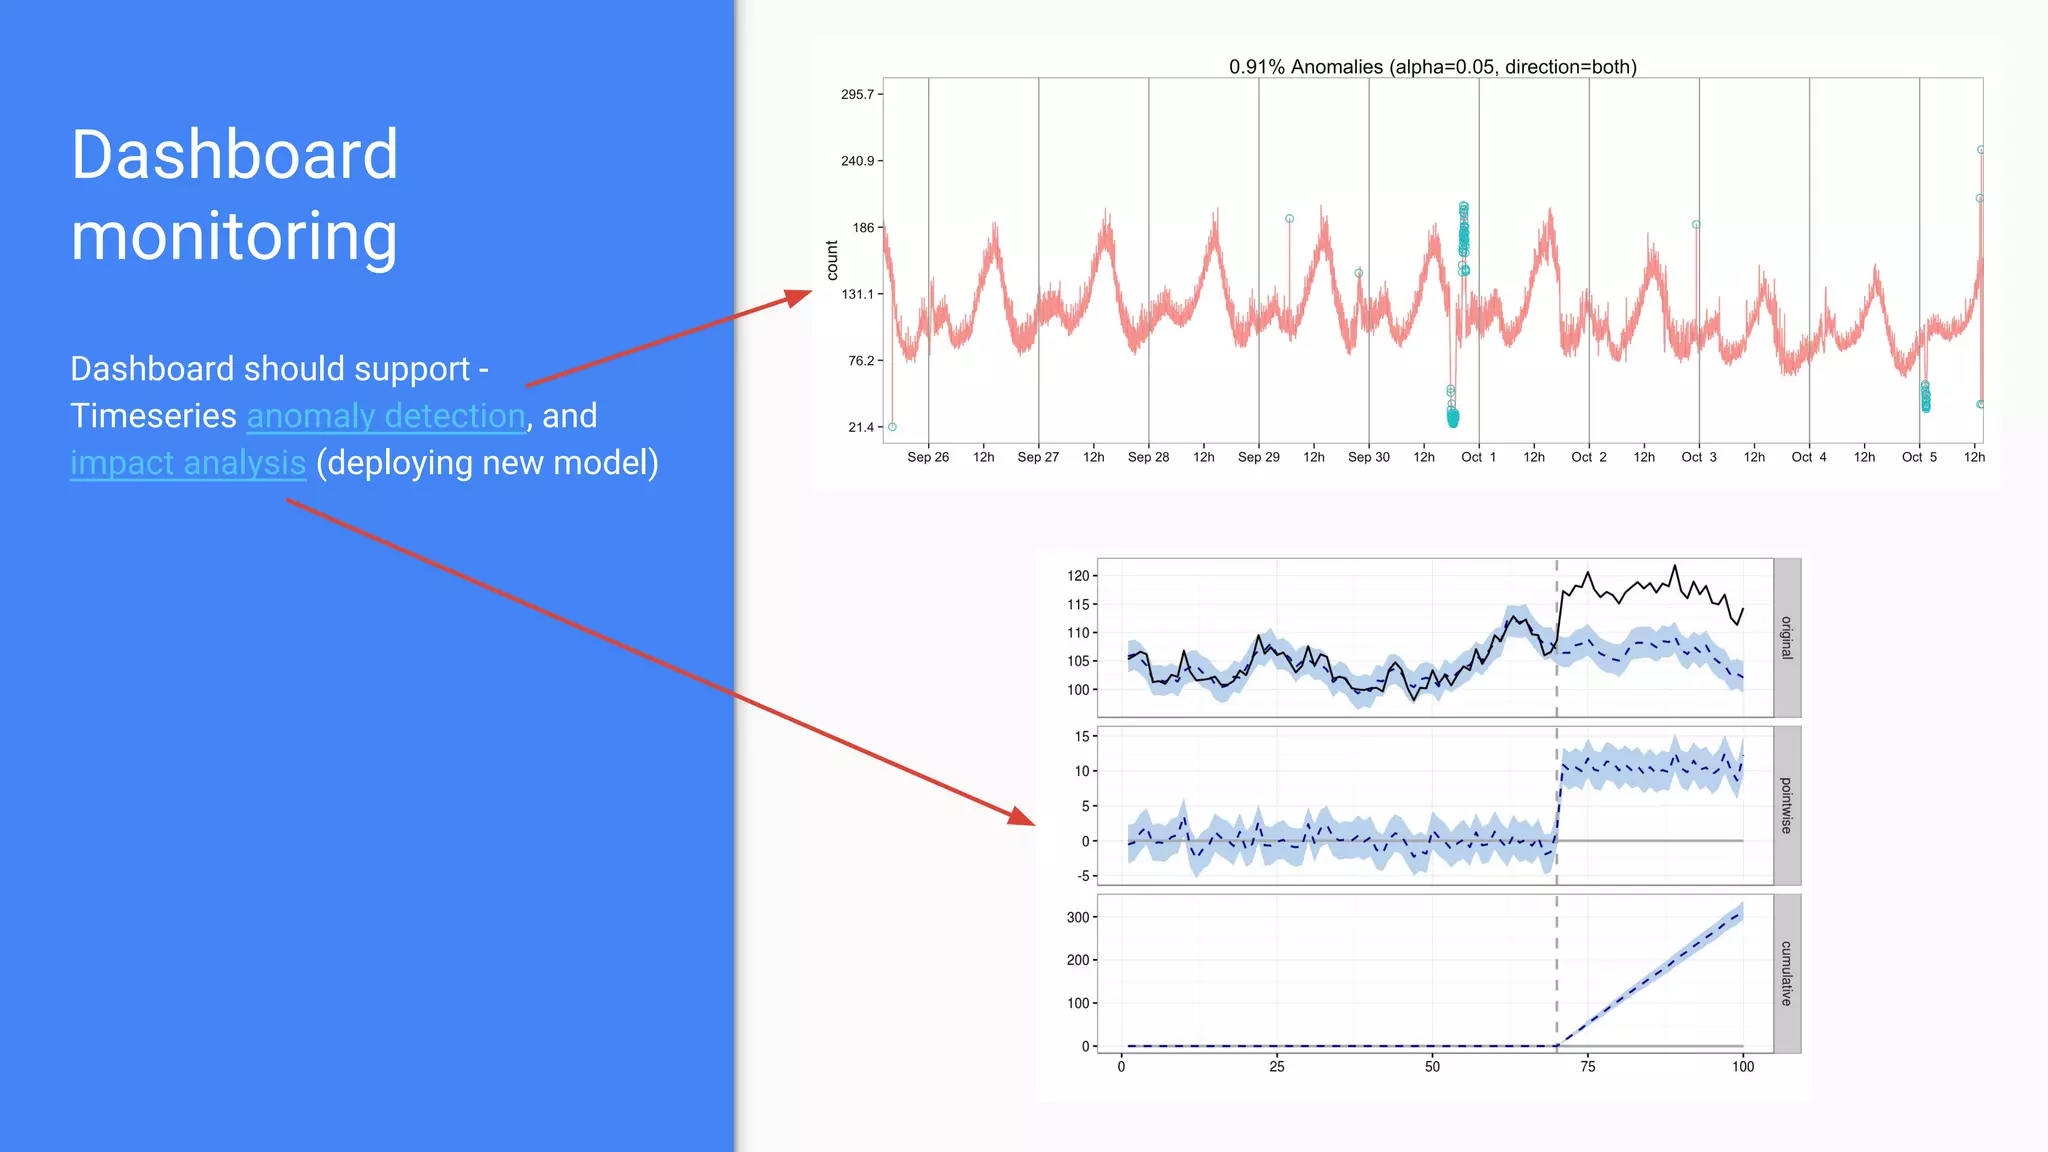


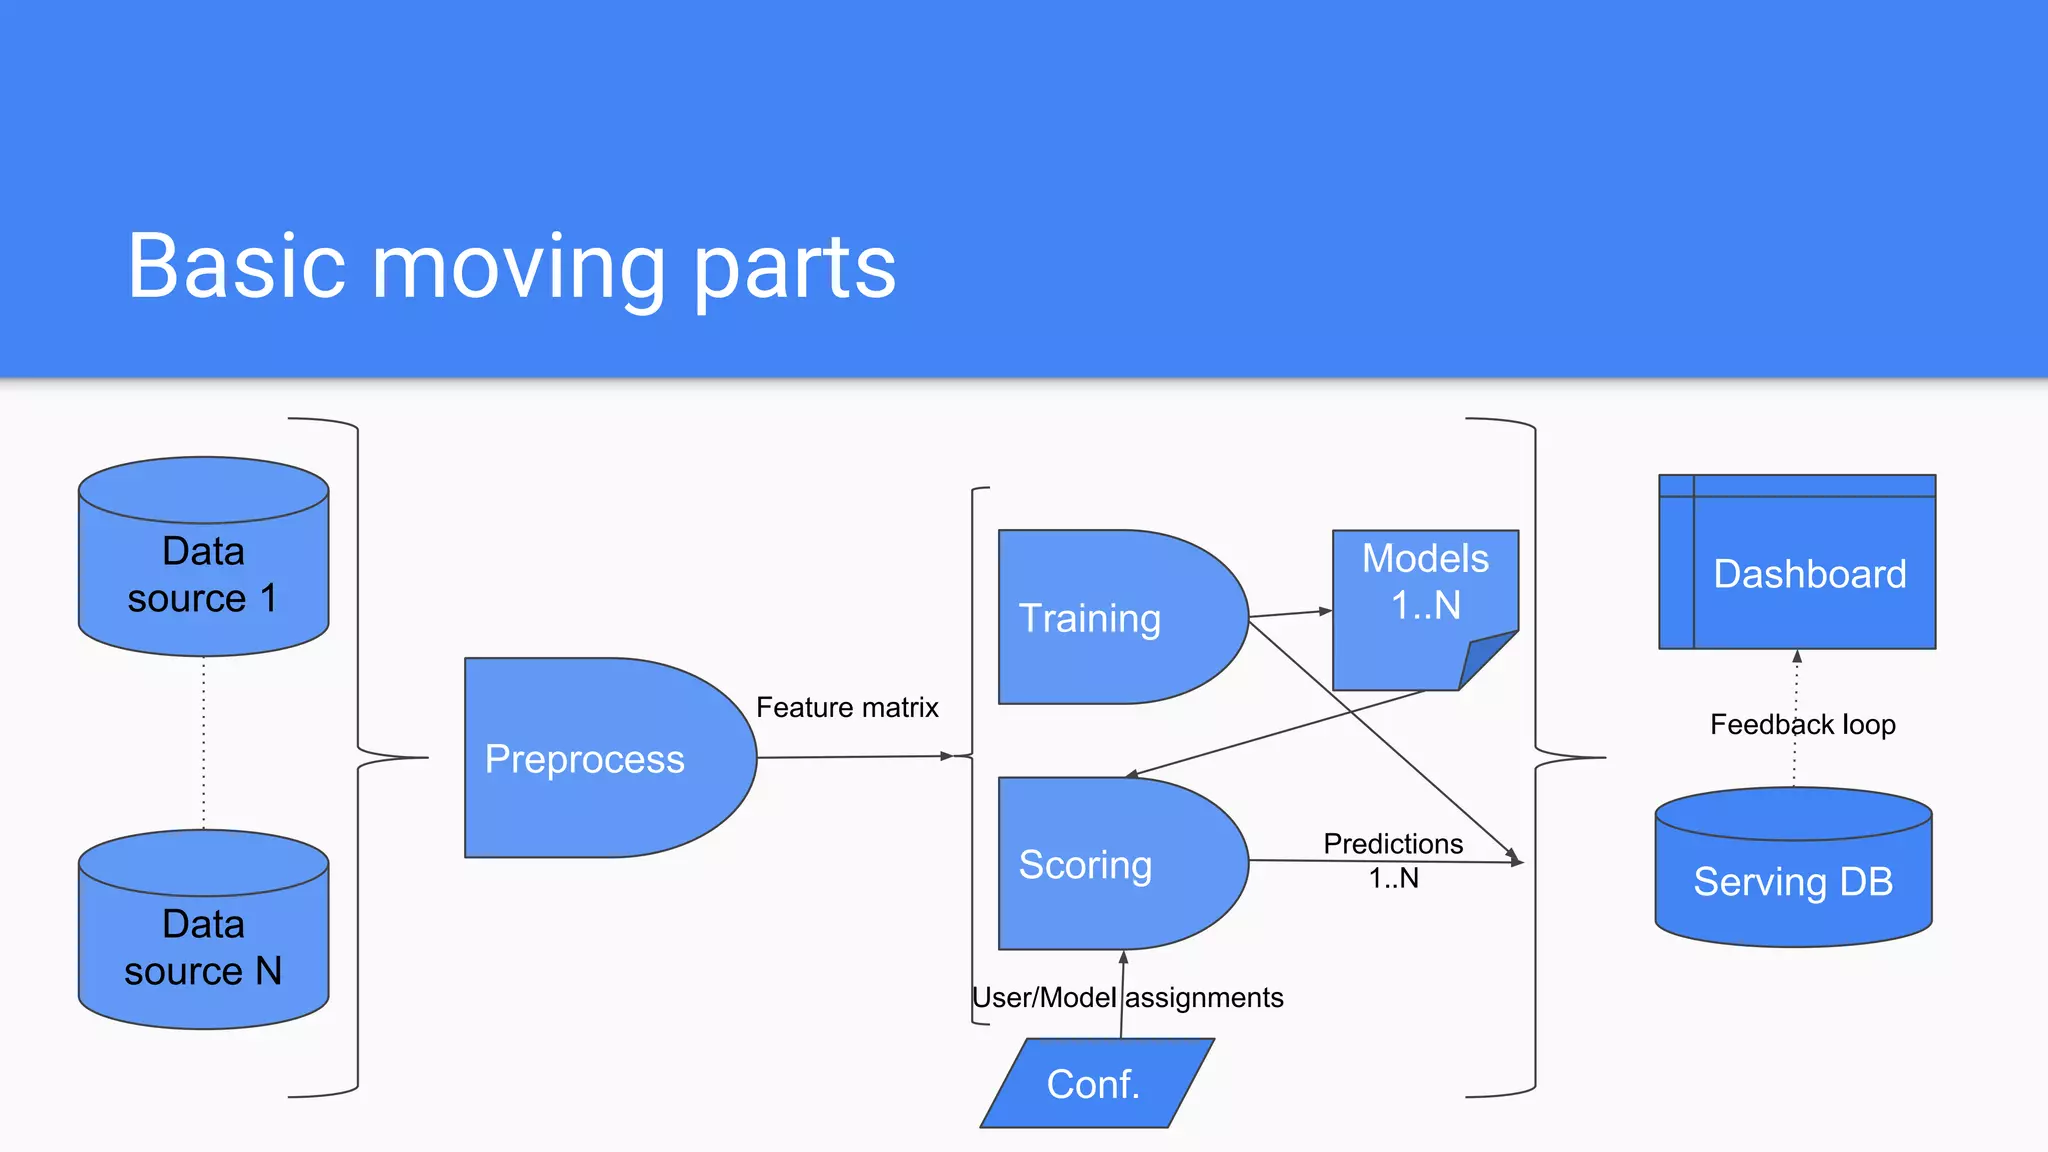
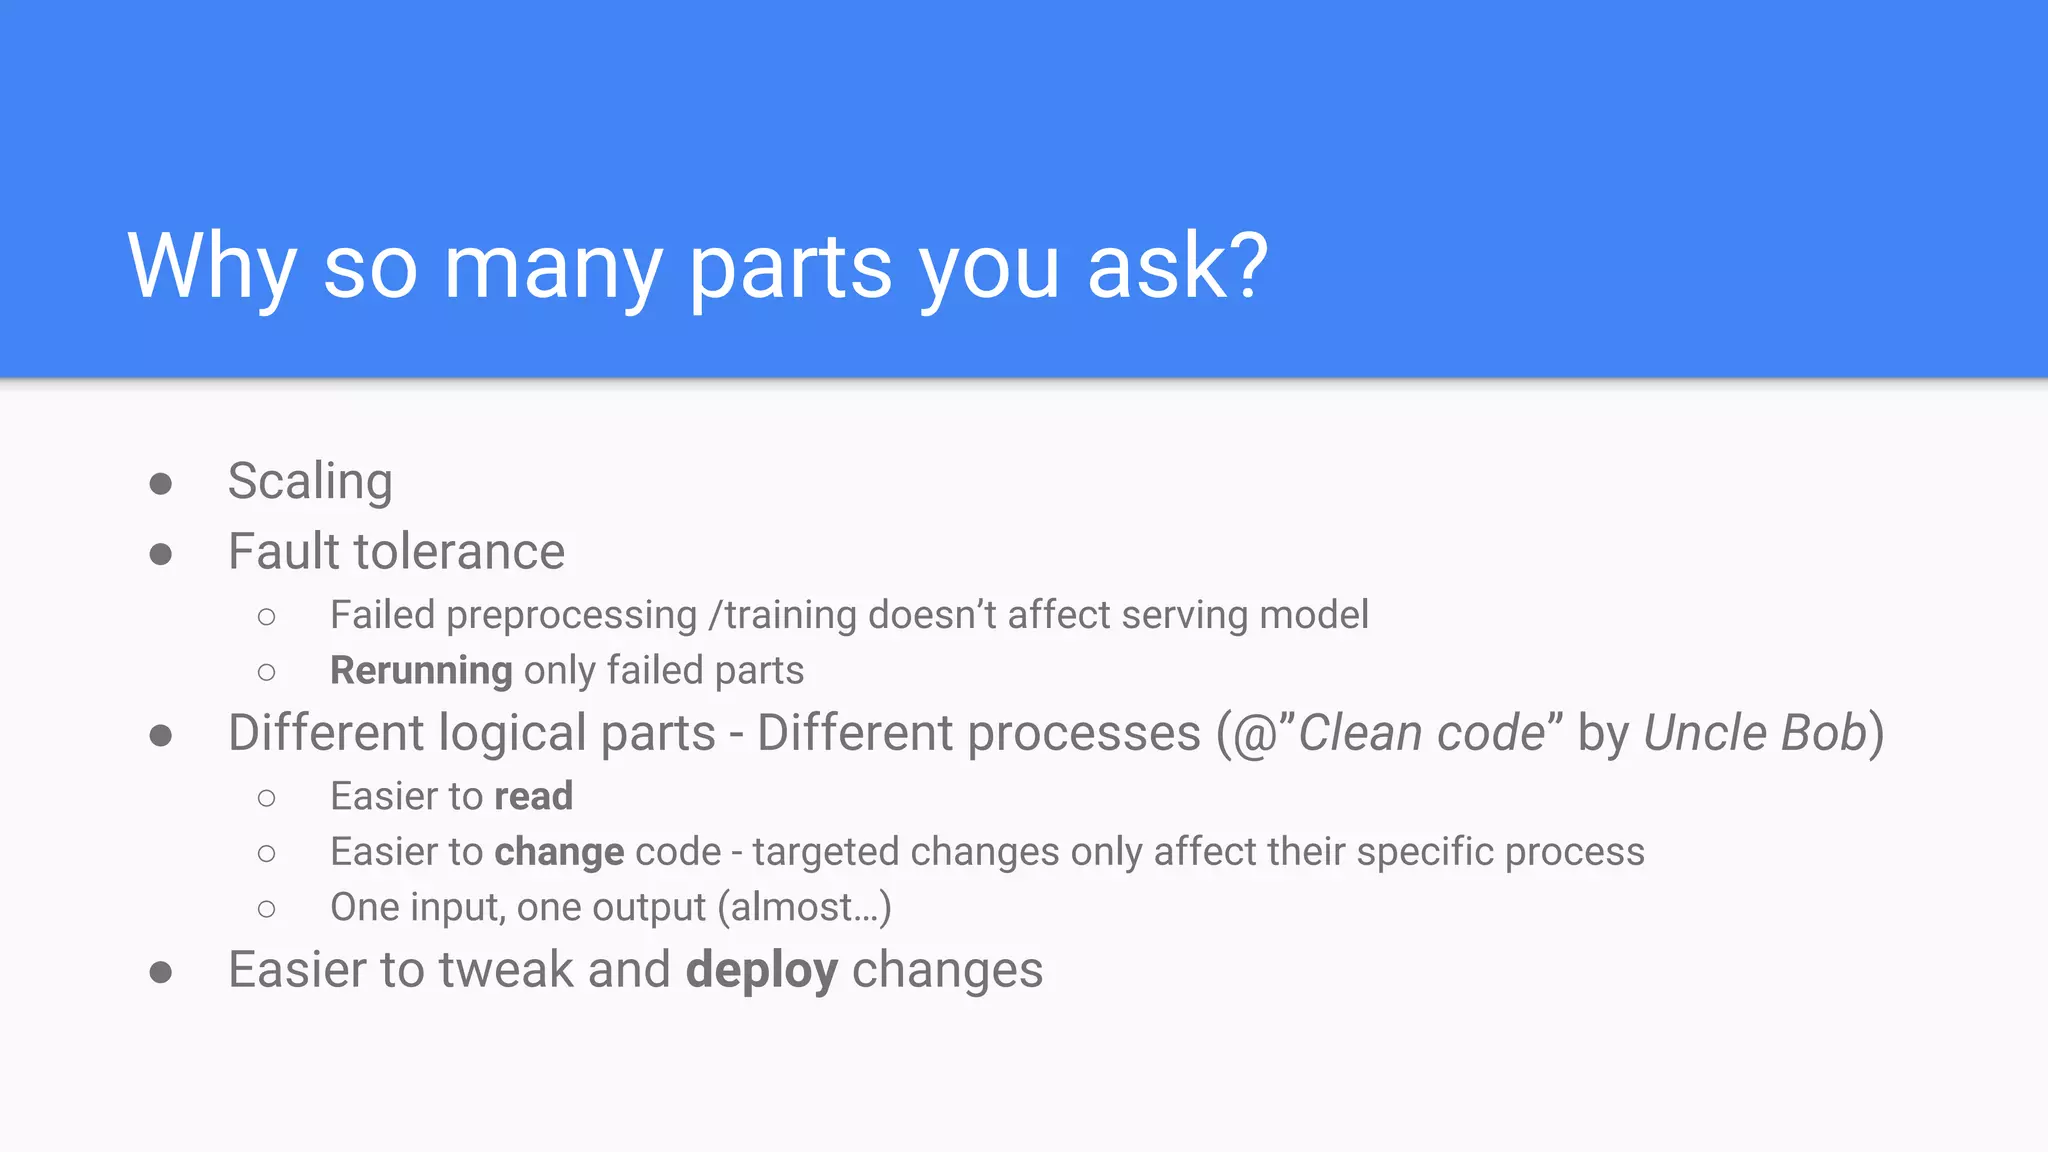


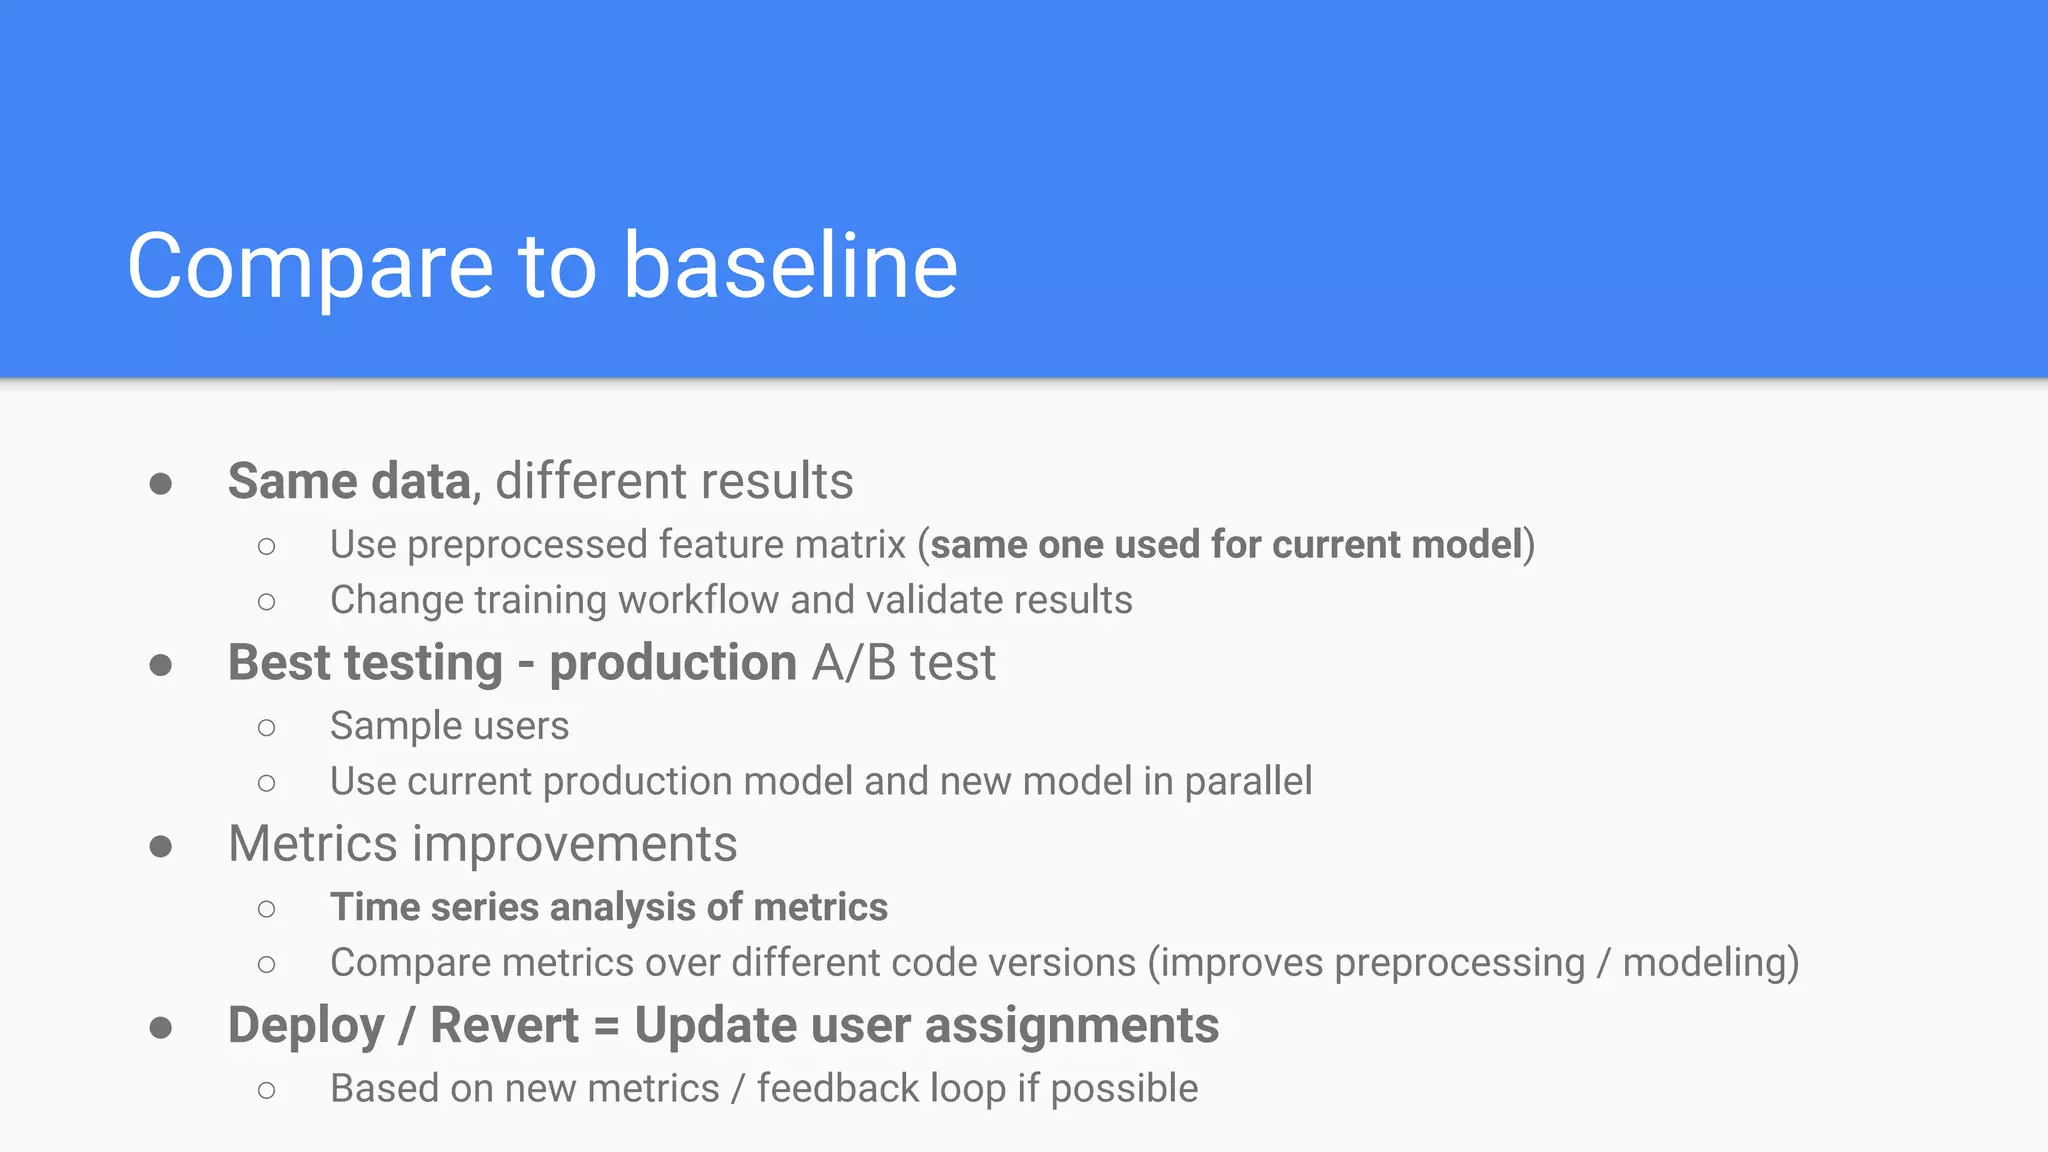


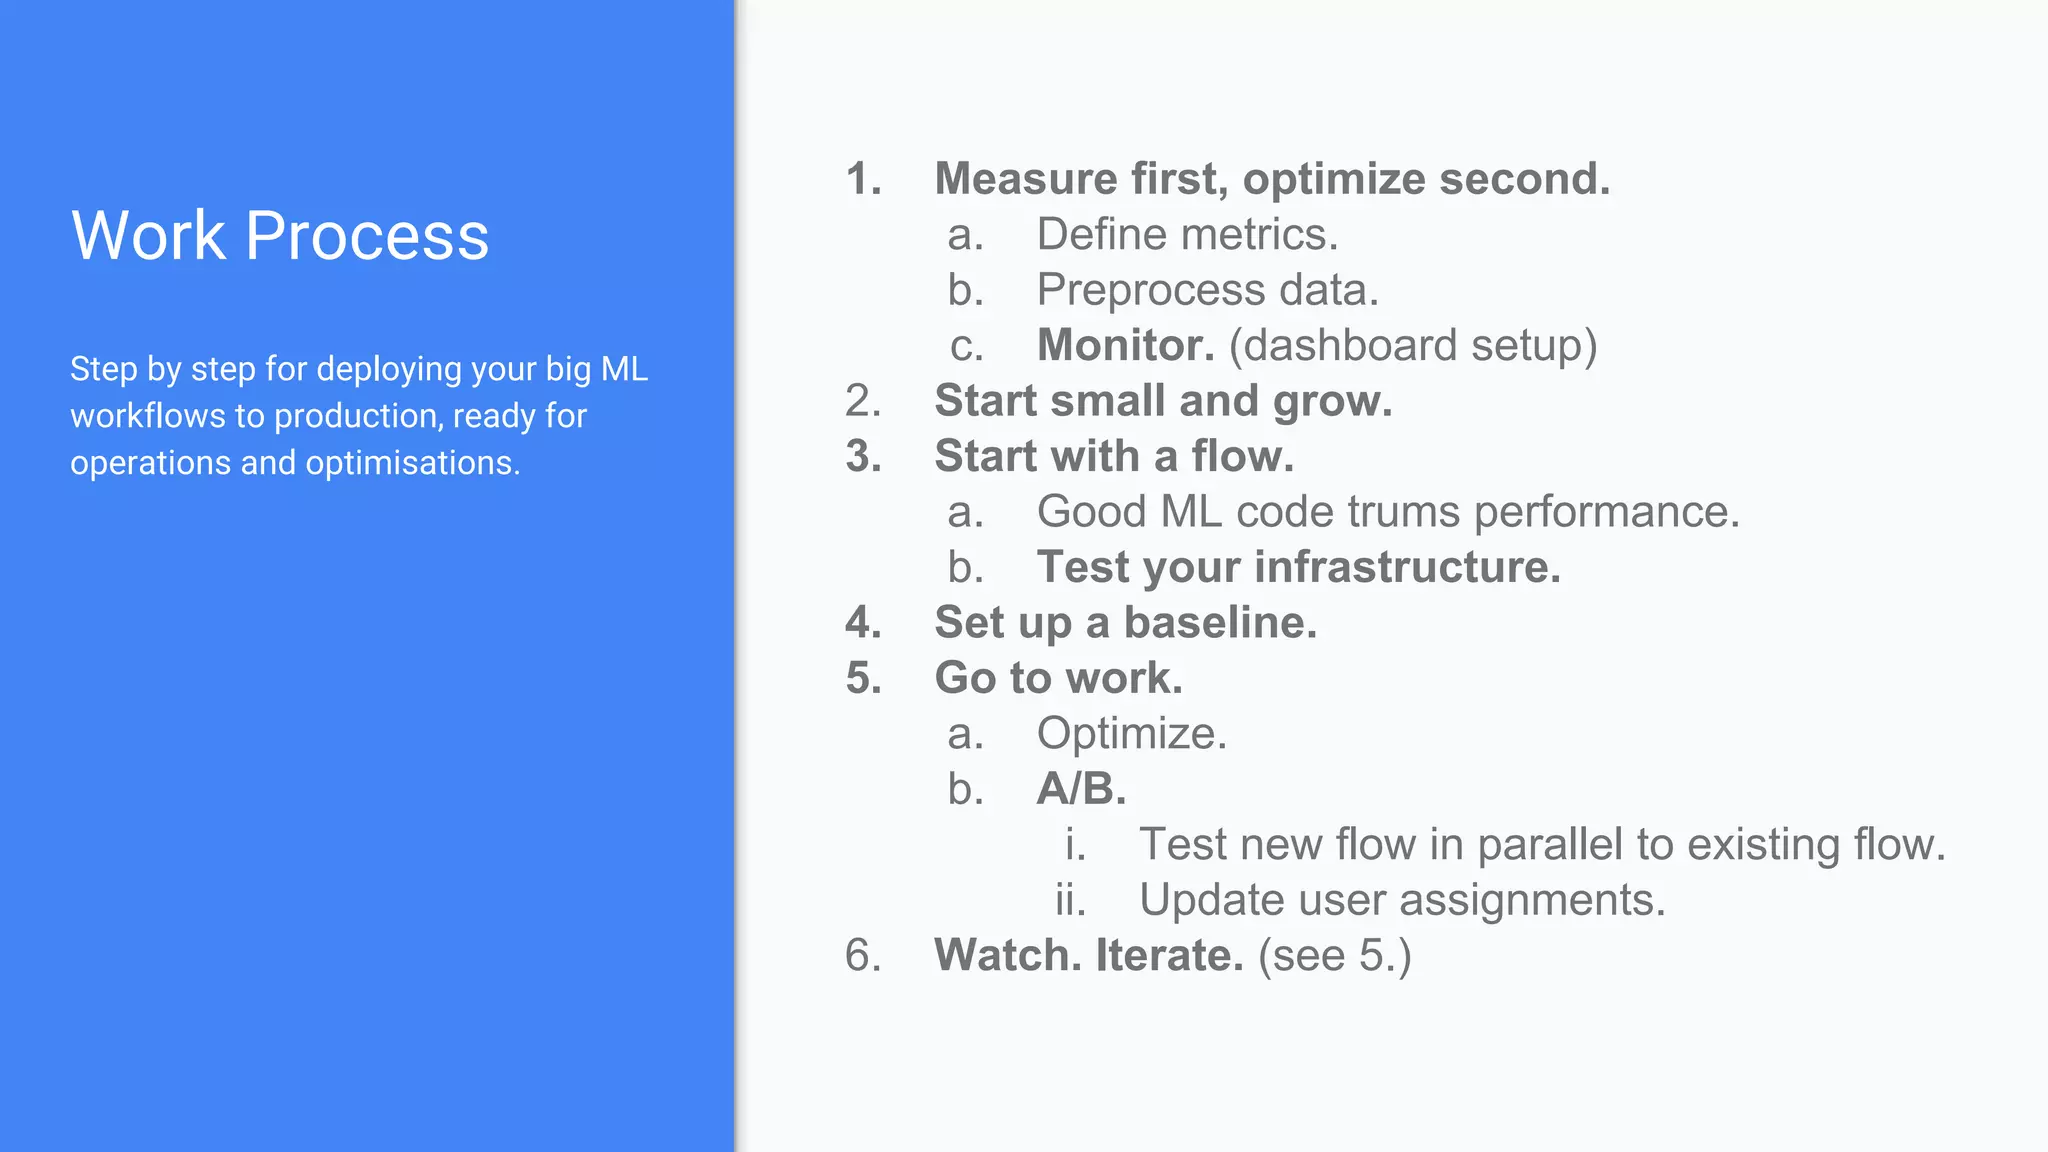


The document outlines a comprehensive approach to deploying big data analytics workflows in production, particularly through the use of Google’s Waze application. It emphasizes the importance of measuring and optimizing workflows, assessing various methodologies, and learning from both successes and failures. Key topics include data preprocessing, model evaluation, dashboard monitoring, and practical use cases for improving services like traffic management and anomaly detection.


![Waze - An introduction to Location Based Marketing on Waze [HUBFORUM]](https://cdn.slidesharecdn.com/ss_thumbnails/wazeedwardling-160526061034-thumbnail.jpg?width=640&height=640&fit=bounds)


![[DSC Europe 25] Milan Zdravkovic - The road less traveled in District Heating...](https://cdn.slidesharecdn.com/ss_thumbnails/nfaboniqwsz4ucyctnmy-2-milan-zdravkovic-dsc2025-the-road-less-traveled-in-district-heating-operation-251208151905-f56388a5-thumbnail.jpg?width=640&height=640&fit=bounds)

![[DSC Europe 25] Katherine Forrest - AI NOW: Understanding the Velocity of Cha...](https://cdn.slidesharecdn.com/ss_thumbnails/wvvbruqfrci0sfq9xwgb-4-251212104007-e5ad1987-thumbnail.jpg?width=640&height=640&fit=bounds)

![[DSC Europe 25] Imai Jen-La Plante - The New Generation: AI and the Future of...](https://cdn.slidesharecdn.com/ss_thumbnails/kxi8t2l5rggivgcenyba-1-jenlaplante-dsc-251208152532-d1e076c2-thumbnail.jpg?width=640&height=640&fit=bounds)
![[DSC Europe 25] Behzad Hosseini - AI Agents in the Wild: Deploying Models tha...](https://cdn.slidesharecdn.com/ss_thumbnails/3qtejajvsjqrzwfept2c-10-251212103250-7f2b1068-thumbnail.jpg?width=640&height=640&fit=bounds)
![[DSC Europe 25] Marko Krstic - Understanding the AI Threat Landscape - Risks,...](https://cdn.slidesharecdn.com/ss_thumbnails/tiyim1ins5jvbrvzpzla-2-251209104645-c69d3553-thumbnail.jpg?width=640&height=640&fit=bounds)


![[DSC Europe 25] Ivan Peric - Intelligence Swarm Logic and Techno-Functional M...](https://cdn.slidesharecdn.com/ss_thumbnails/7my7c97fsduiccadgavw-2-251212103249-5a03f7c6-thumbnail.jpg?width=640&height=640&fit=bounds)
![[DSC Europe 25] Kaja Kandare - LLM as a judge.pptx](https://cdn.slidesharecdn.com/ss_thumbnails/arxyccaxsdsd1ba99wjw-7-251212104007-2b4e3f64-thumbnail.jpg?width=640&height=640&fit=bounds)
![[DSC Europe 25] Dusan Nesic - Securing Tomorrow’s Infrastructure: Why Cyber-P...](https://cdn.slidesharecdn.com/ss_thumbnails/qikbszfftyowjm2q6duw-1-251211083848-8f2ead6b-thumbnail.jpg?width=640&height=640&fit=bounds)


![[DSC Europe 25] Nikolay Burlutskiy - Best Practices for Building Enterprise M...](https://cdn.slidesharecdn.com/ss_thumbnails/uirvaiuvq8y1w8hzd9tx-7-251212103249-2619edb4-thumbnail.jpg?width=640&height=640&fit=bounds)
![[DSC Europe 25] Dobrica Cosic - Savings by the Second: How Dynamic Pricing an...](https://cdn.slidesharecdn.com/ss_thumbnails/znp09f3smtqz3w2sq6wn-1-dobrica-cosic-savings-by-the-second-how-dynamic-pricing-and-smart-data-are-bu-251208151905-26e6f41e-thumbnail.jpg?width=640&height=640&fit=bounds)
