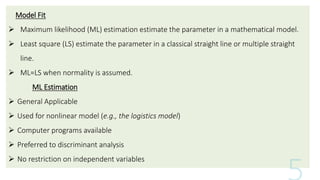
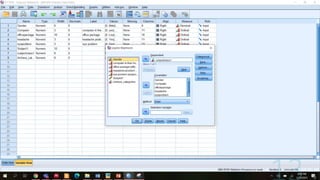
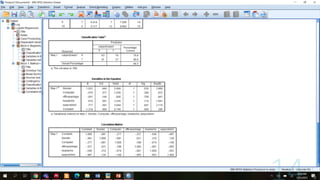
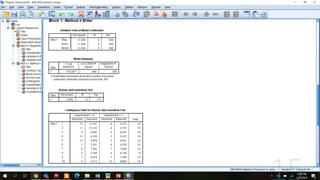
Logistics Regression Analysis
Presented By
Kishor Neupane
Outline of the Presentation
1. Logistics Regression
2. Model Equation of Regression Equation
3. Model Fit
4. Maximum likelihood Estimation
5. The Likelihood Ratio Test (LR- Test)
6. The Wald test
7. Interval Estimation
8. Odd ratio test (OR Test)
9. Chi-Square Hosmer and Lemeshow test
10. Data presented in SPSS
11. References
Logistic Regression Analysis
 Logistic Regression is the model used to predict the categorical
dependent variables to one or more independent variables by
estimating probabilities using logistic function.
 Types of logistics regression 1) Binary 2)Ordinal 3) multinomial.
 Binary logistics regression is used to observed the outcomes for
two categories. (i.e, pass/ fail, success/ failure, dead/ alive,
yes/no)
 Multinomial logistics regression is used to observed more than
two possible categories
 The logistics function defines 𝑓 𝑥 =
1
1+𝑒−𝑧 where domain of
f x is − ∞ ≤ 𝑧 ≤ +∞
 The range of logistics function is 0 ≤ 𝑓(𝑧) ≤ 1
Model Equation of Logistics Regression
 The logistics model is obtained to write z as the linear sum of
a+b1x1+b2x2+………..+bkxk where the x’s are independent variables of
interest and a and the bi are constant terms representing unknown
parameters.
 f z =
1
1+e−z =
1
1+e−(a+ bixi)
Models are
L1 =f1(x)= a+b1x1+b2x2 , L2 = f2(x)=a+b1x1+b2x2+b3x3,
L3=f3(x)= a+b1x1+b2x2+b3x3+b4x4+b5x5
Model Fit
 Maximum likelihood (ML) estimation estimate the parameter in a mathematical model.
 Least square (LS) estimate the parameter in a classical straight line or multiple straight
line.
 ML=LS when normality is assumed.
ML Estimation
 General Applicable
 Used for nonlinear model (e.g., the logistics model)
 Computer programs available
 Preferred to discriminant analysis
 No restriction on independent variables
The Likelihood Ratio Test (LR- Test)
 The likelihood ratio test assesses the goodness of model fit.
 Ho : parameter in full model equal to zero.
 df= number of parameters set equal to zero.
 LR = −𝟐𝐥𝐨 𝐠
𝑳𝟏
𝑳𝟐
,
 The LR-test is significant if their p- value is < ∝(critical region) at 95% of
confident interval.
The Wald test
 The statistics computed by dividing the estimated coefficient of
interest by its standard error.
 The Wald test is the another way to calculate the logistics regression
without using likelihood ratio test.
 H0: parameter in single model equal to zero( i.e, bi=0)
 Wald chi-square test =
𝐸𝑠𝑡𝑖𝑚𝑎𝑡𝑒
𝑆𝑡𝑎𝑛𝑑𝑎𝑟𝑑 𝑒𝑟𝑟𝑜𝑟
2
 Accept H0 if p-value < α at 95% confident interval
Interval Estimation
 The estimate of the parameter plus or minus a percentage point of
the normal distribution times the estimated standard error
Estimation±(percentage point of z×estimated standard errors)
Confidence interval for the odds ratio is obtained by exponentiation
the confidence limits obtained for the parameter.
 1 −∝ 100% confident interval for variables are b1±𝑧1−
∝
2
SE
Odd ratio test (OR Test)
The odds ratio(OR) is a statistics that quantifies the strength of the association
between two events.
Two events are independent iff their OR = 1.
 H0 : odd ratio =1 for independent variable
 H1: odd ratio ≠ 1 for independent variable
 Test criteria : odd ratio test
Chi-Square Hosmer and Lemeshow test
The Hosmer-Lemeshow test is statistical test for goodness of fit for logistics test.
It is used in risk prediction models.
H0: Observation Probability= Expected Probability
H1: Observation Probability≠ Expected Probability
Test criteria: Chi-square test
Decision: P-value for chi-square < ∝ then, Reject H0
References
Cox, D. R. (2006). Principles of statistical inference. Methods in molecular biology (Clifton,
N.J.). Cambridge University Press. https://doi.org/10.1007/978-1-59745-530-5_4
Hosmer, D. W., & Lemeshow, S. (2000). Applied Logistic Regression, Second Edition by David
W. Hosmer, Stanley Lemeshow(auth.), Walter A. Shewhart, Samuel S. Wilks(eds.) (z-
lib.org).pdf.
Khandelwal, K. (n.d.). Logistics regression. Retrieved January 15, 2021, from
https://www2.slideshare.net/KrishnaKhandelwal8/logistics-
regression?qid=0ee868c8-aeb1-4018-b6b4-31a86d38a3dd&v=&b=&from_search=1
Kuonen, D. (2004). Book Review: Regression modelling strategies: with applications to
linear models, logistic regression, and survival analysis. In Statistical Methods in
Medical Research

Logistics regression

  • 1.
  • 2.
    Outline of thePresentation 1. Logistics Regression 2. Model Equation of Regression Equation 3. Model Fit 4. Maximum likelihood Estimation 5. The Likelihood Ratio Test (LR- Test) 6. The Wald test 7. Interval Estimation 8. Odd ratio test (OR Test) 9. Chi-Square Hosmer and Lemeshow test 10. Data presented in SPSS 11. References
  • 3.
    Logistic Regression Analysis Logistic Regression is the model used to predict the categorical dependent variables to one or more independent variables by estimating probabilities using logistic function.  Types of logistics regression 1) Binary 2)Ordinal 3) multinomial.  Binary logistics regression is used to observed the outcomes for two categories. (i.e, pass/ fail, success/ failure, dead/ alive, yes/no)  Multinomial logistics regression is used to observed more than two possible categories  The logistics function defines 𝑓 𝑥 = 1 1+𝑒−𝑧 where domain of f x is − ∞ ≤ 𝑧 ≤ +∞  The range of logistics function is 0 ≤ 𝑓(𝑧) ≤ 1
  • 4.
    Model Equation ofLogistics Regression  The logistics model is obtained to write z as the linear sum of a+b1x1+b2x2+………..+bkxk where the x’s are independent variables of interest and a and the bi are constant terms representing unknown parameters.  f z = 1 1+e−z = 1 1+e−(a+ bixi) Models are L1 =f1(x)= a+b1x1+b2x2 , L2 = f2(x)=a+b1x1+b2x2+b3x3, L3=f3(x)= a+b1x1+b2x2+b3x3+b4x4+b5x5
  • 5.
    Model Fit  Maximumlikelihood (ML) estimation estimate the parameter in a mathematical model.  Least square (LS) estimate the parameter in a classical straight line or multiple straight line.  ML=LS when normality is assumed. ML Estimation  General Applicable  Used for nonlinear model (e.g., the logistics model)  Computer programs available  Preferred to discriminant analysis  No restriction on independent variables
  • 6.
    The Likelihood RatioTest (LR- Test)  The likelihood ratio test assesses the goodness of model fit.  Ho : parameter in full model equal to zero.  df= number of parameters set equal to zero.  LR = −𝟐𝐥𝐨 𝐠 𝑳𝟏 𝑳𝟐 ,  The LR-test is significant if their p- value is < ∝(critical region) at 95% of confident interval.
  • 7.
    The Wald test The statistics computed by dividing the estimated coefficient of interest by its standard error.  The Wald test is the another way to calculate the logistics regression without using likelihood ratio test.  H0: parameter in single model equal to zero( i.e, bi=0)  Wald chi-square test = 𝐸𝑠𝑡𝑖𝑚𝑎𝑡𝑒 𝑆𝑡𝑎𝑛𝑑𝑎𝑟𝑑 𝑒𝑟𝑟𝑜𝑟 2  Accept H0 if p-value < α at 95% confident interval
  • 8.
    Interval Estimation  Theestimate of the parameter plus or minus a percentage point of the normal distribution times the estimated standard error Estimation±(percentage point of z×estimated standard errors) Confidence interval for the odds ratio is obtained by exponentiation the confidence limits obtained for the parameter.  1 −∝ 100% confident interval for variables are b1±𝑧1− ∝ 2 SE
  • 9.
    Odd ratio test(OR Test) The odds ratio(OR) is a statistics that quantifies the strength of the association between two events. Two events are independent iff their OR = 1.  H0 : odd ratio =1 for independent variable  H1: odd ratio ≠ 1 for independent variable  Test criteria : odd ratio test
  • 10.
    Chi-Square Hosmer andLemeshow test The Hosmer-Lemeshow test is statistical test for goodness of fit for logistics test. It is used in risk prediction models. H0: Observation Probability= Expected Probability H1: Observation Probability≠ Expected Probability Test criteria: Chi-square test Decision: P-value for chi-square < ∝ then, Reject H0
  • 16.
    References Cox, D. R.(2006). Principles of statistical inference. Methods in molecular biology (Clifton, N.J.). Cambridge University Press. https://doi.org/10.1007/978-1-59745-530-5_4 Hosmer, D. W., & Lemeshow, S. (2000). Applied Logistic Regression, Second Edition by David W. Hosmer, Stanley Lemeshow(auth.), Walter A. Shewhart, Samuel S. Wilks(eds.) (z- lib.org).pdf. Khandelwal, K. (n.d.). Logistics regression. Retrieved January 15, 2021, from https://www2.slideshare.net/KrishnaKhandelwal8/logistics- regression?qid=0ee868c8-aeb1-4018-b6b4-31a86d38a3dd&v=&b=&from_search=1 Kuonen, D. (2004). Book Review: Regression modelling strategies: with applications to linear models, logistic regression, and survival analysis. In Statistical Methods in Medical Research