Download as KEY, PPTX
![General
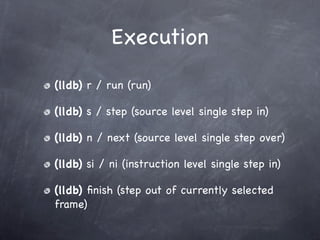
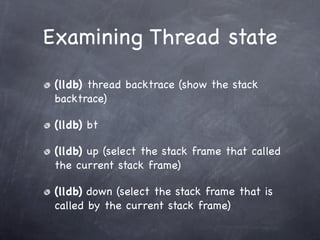
(lldb) help <command> <subcommand>
(lldb) <noun> <verb> [-options [option-value]]
[argument [argument...]]](https://image.slidesharecdn.com/lldb-121004041128-phpapp01/85/LLDB-Introduction-4-320.jpg)
![Breakpoint
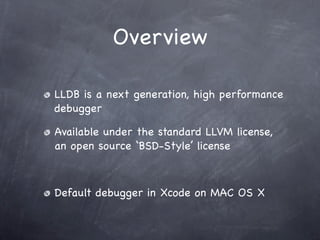
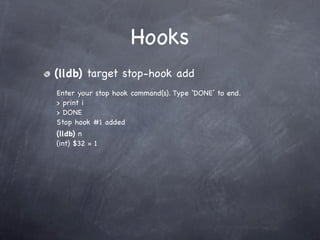
(lldb) b main (Set a break point at all function named
main)
(lldb) b test.c:12 (Set a breakpoint in file test.c at line
12)
(lldb) b -[NSString stringWithFormat:]
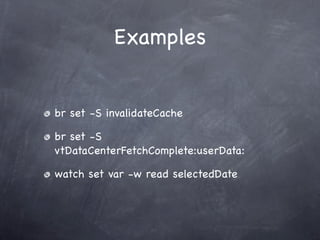
(lldb) br s -S count / br set -S
vtDataCenterFetchComplete:userData:
(lldb) br delete [n]](https://image.slidesharecdn.com/lldb-121004041128-phpapp01/85/LLDB-Introduction-7-320.jpg)

LLDB is a next generation, high performance debugger that is the default debugger in Xcode on Mac OS X. It supports modern multi-threaded programs and has up-to-date language support for C, C++, and Objective-C. LLDB is extensible through a Python scripting interface and plug-in architecture. It allows users to set breakpoints, watchpoints, and hooks to examine variables and threads.


![[TECHCON 2019: MOBILE - iOS]3.쉽고 재미있는 iOS 디버깅 - LLDB Command](https://cdn.slidesharecdn.com/ss_thumbnails/3-190712083226-thumbnail.jpg?width=640&height=640&fit=bounds)


![[Td 2015] what is new in visual c++ 2015 and future directions(ulzii luvsanba...](https://cdn.slidesharecdn.com/ss_thumbnails/td2015whatisnewinvisualc2015andfuturedirectionsulziiluvsanbatandaymanshoukly-151104050956-lva1-app6891-thumbnail.jpg?width=640&height=640&fit=bounds)