Downloaded 34 times


![void
$__lldb_expr(void *$__lldb_arg)
{
some_variable;
}
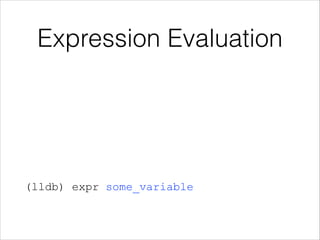
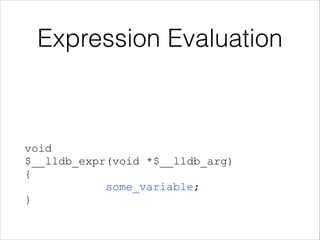
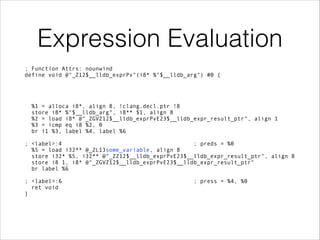
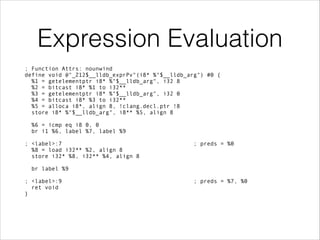
Expression Evaluation
ClangExpressionDeclMap::FindExternalVisibleDecls[2] for
'some_variable' in a 'TranslationUnit'
CEDM::FEVD[2] Searching the root namespace
CEDM::FEVD[2] Found variable some_variable,
returned static int &some_variable (original int)](https://image.slidesharecdn.com/eurobsdcon2014lldb-150111074814-conversion-gate02/85/The-LLDB-Debugger-in-FreeBSD-by-Ed-Maste-37-320.jpg)

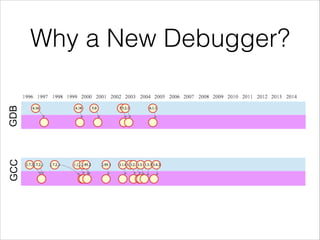
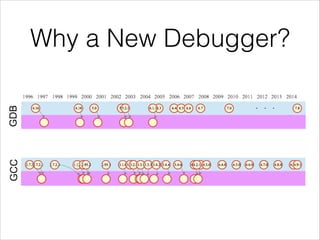
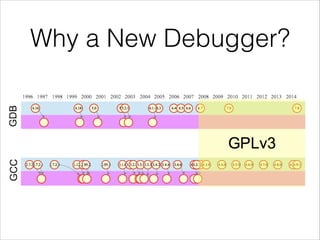
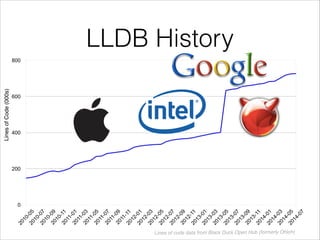
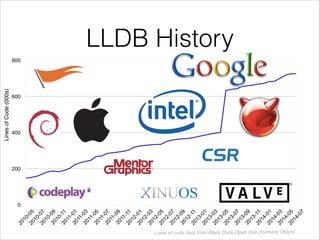
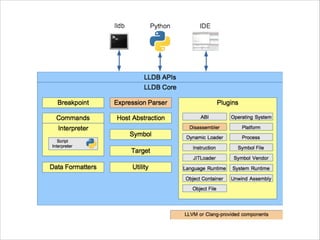
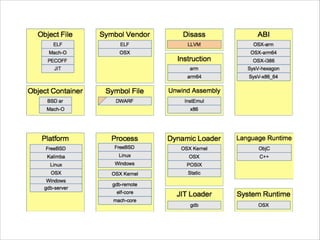
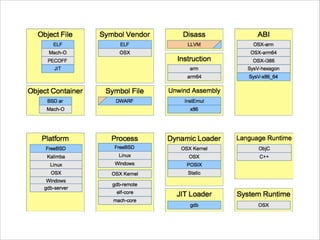
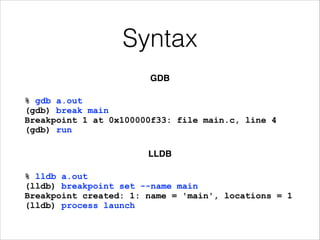
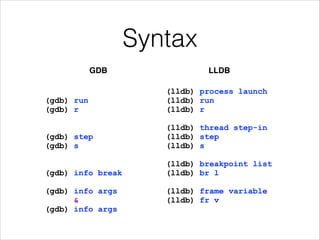
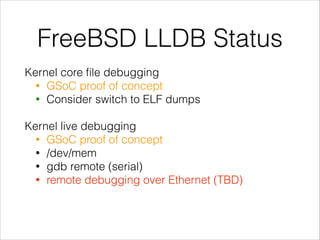
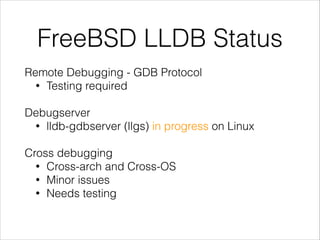
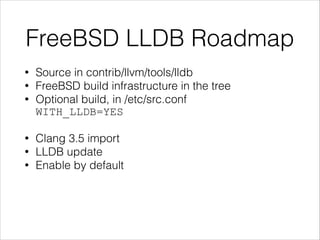
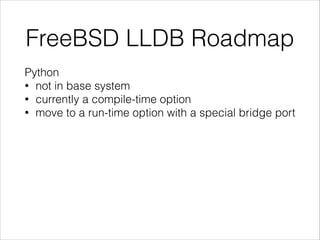
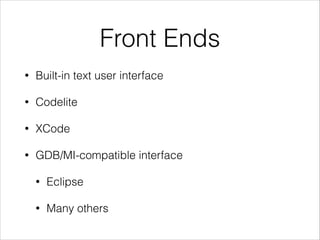
The document discusses the LLDB debugger in FreeBSD, covering its history, design, and status regarding various functionalities like userland and kernel core file debugging. It outlines the differences in syntax between LLDB and GDB, along with statuses of target support and remote debugging capabilities. Additionally, the roadmap for future development of LLDB within FreeBSD is presented, detailing updates and integration plans.


![[Td 2015] what is new in visual c++ 2015 and future directions(ulzii luvsanba...](https://cdn.slidesharecdn.com/ss_thumbnails/td2015whatisnewinvisualc2015andfuturedirectionsulziiluvsanbatandaymanshoukly-151104050956-lva1-app6891-thumbnail.jpg?width=640&height=640&fit=bounds)


![[TECHCON 2019: MOBILE - iOS]3.쉽고 재미있는 iOS 디버깅 - LLDB Command](https://cdn.slidesharecdn.com/ss_thumbnails/3-190712083226-thumbnail.jpg?width=640&height=640&fit=bounds)


![5G Explained! A High Level Overview [Introduction]](https://cdn.slidesharecdn.com/ss_thumbnails/5gexplainedahighleveloverview-260119165306-cc137a3e-thumbnail.jpg?width=640&height=640&fit=bounds)


