This document provides an overview of a presentation on Linux networking. The agenda includes topics like ARP, interface manipulation, network troubleshooting, routing, network bonding, network namespaces, kernel network parameters, and interview questions. It notes that the presentation will demonstrate over 30 commands related to networking and that there are often multiple ways to solve exercises. It encourages asking questions to aid learning.


![ping - test the reachability of a host
[arie@fedora ~]$ ping 8.8.8.8
64 bytes from 8.8.8.8: icmp_seq=1 ttl=120 time=66.2 ms
64 bytes from 8.8.8.8: icmp_seq=2 ttl=120 time=66.2 ms
64 bytes from 8.8.8.8: icmp_seq=3 ttl=120 time=66.1 ms
[arie@
What protocol does the
‘ping’ command uses?
Do you know?
● Used to check whether a given host is reachable
● By default, it will not stop until sending an interrupt
[arie@fedora ~]$ ping 8.8.8.8
64 bytes from 8.8.8.8: icmp_seq=1 ttl=120 time=66.1 ms
--- 8.8.8.8 ping statistics ---
^C
1 packets transmitted, 1 received, 0% packet loss, time 0ms
rtt min/avg/max/mdev = 66.130/66.130/66.130/0.000 ms](https://image.slidesharecdn.com/linuxnetworking-180905200006/85/Linux-networking-5-320.jpg)
![ping - more examples
[arie@fedora ~]$ ping -s 250 8.8.8.8
258 bytes from 8.8.8.8: icmp_seq=1 ttl=120 time=66.2 ms
● Control packet size
[arie@
Will a packet size of
2000 will work?
Do you know?
[arie@fedora ~]$ ping -c 2 8.8.8.8
64 bytes from 8.8.8.8: icmp_seq=1 ttl=120 time=66.2 ms
64 bytes from 8.8.8.8: icmp_seq=2 ttl=120 time=66.2 ms
● Control number of packets
● Try ‘ping -a 8.8.8.8’
○ What it does?](https://image.slidesharecdn.com/linuxnetworking-180905200006/85/Linux-networking-6-320.jpg)
![List network interfaces
[arie@fedora ~]$ ip link show # you can also use ‘ip l’
1: lo: <LOOPBACK,UP,LOWER_UP> mtu 65536 qdisc noqueue state UNKNOWN
mode DEFAULT group default qlen 1000
link/loopback 00:00:00:00:00:00 brd 00:00:00:00:00:00
2: enp0s31f6: <BROADCAST,MULTICAST,UP,LOWER_UP> mtu 1500 qdisc fq_codel
state UP mode DEFAULT group default qlen 1000
link/ether 8c:16:45:32:99:d7 brd ff:ff:ff:ff:ff:ff
● Do not use ‘ifconfig’. It’s deprecated!
● Why do we need the loopback device?
● There is a separate manual for ‘ip link’ (man ip-link)
● List devices and show their attributes
○ You can learn a lot of from the output: MTU, MAC, state](https://image.slidesharecdn.com/linuxnetworking-180905200006/85/Linux-networking-7-320.jpg)
![List network interfaces with their addresses
[arie@fedora ~]$ ip addr # You can also use ‘ip a’
1: lo: <LOOPBACK,UP,LOWER_UP> mtu 65536 qdisc noqueue state UNKNOWN
group default qlen 1000
link/loopback 00:00:00:00:00:00 brd 00:00:00:00:00:00
inet 127.0.0.1/8 scope host lo
valid_lft forever preferred_lft forever
inet6 ::1/128 scope host
valid_lft forever preferred_lft forever
2: enp0s25f5: <BROADCAST,MULTICAST,UP,LOWER_UP> mtu 1500 qdisc fq_codel
state UP group default qlen 1000
link/ether 2b:12:63:62:55:d4 brd ff:ff:ff:ff:ff:ff
inet 190.40.2.126/24 brd 190.40.2.255 scope global dynamic noprefixroute enp0s31f6
valid_lft 83174sec preferred_lft 83174sec
● Show network interfaces but this time with their IP addresses](https://image.slidesharecdn.com/linuxnetworking-180905200006/85/Linux-networking-8-320.jpg)
![ethtool - query and manipulate driver and hardware settings
[arie@fedora ~]$ sudo ethtool my_interface
Settings for my_interface:
Supported ports: [ TP ]
Supported link modes: 10baseT/Half 10baseT/Full
100baseT/Half 100baseT/Full
1000baseT/Full
Supported pause frame use: No
Supports auto-negotiation: Yes
...
Current message level: 0x00000007 (7)
drv probe link
Link detected: yes](https://image.slidesharecdn.com/linuxnetworking-180905200006/85/Linux-networking-9-320.jpg)
![ethtool - The Cool Features
[arie@fedora ~]$ sudo ethtool -p interface_name
● Don’t know which physical port a specific interface is using? Make the
interface led blinking!
[arie@fedora ~]$ sudo ethtool -t interface_name
● Run tests to check your network interface
[arie@fedora ~]$ sudo ethtool -S interface_name
● Tons of statistics!
● We’ll see more of ethtool later on](https://image.slidesharecdn.com/linuxnetworking-180905200006/85/Linux-networking-10-320.jpg)
![lshw - the hardware perspective
● You can use lshw to get the hardware information on your network devices
[arie@fedora ~]$ lshw -class network
*-network
description: Ethernet interface
product: Ethernet Connection (2) I219-LM
vendor: Intel Corporation
physical id: 1f.6
logical name: enp0s31f6
serial: 2b:12:55:17:25:c2
size: 1Gbit/s
capacity: 1Gbit/s
capabilities: bus_master cap_list ethernet physical tp 10bt 10bt-fd
configuration: autonegotiation=on driver=e1000e driverversion=3.2.6-k duplex=full
● You can obtain interesting information like:
○ Type of the card (product + vendor)
○ Configuration and capabilities (duplex, driver, …)](https://image.slidesharecdn.com/linuxnetworking-180905200006/85/Linux-networking-11-320.jpg)
![lspci - the hardware perspective 2
● You can also use lspci
[arie@fedora ~]$ lspci | grep -E -i 'network|ethernet'
00:1f.6 Ethernet controller: Intel Corporation Ethernet Connection (2) I219-LM (rev 31)
04:00.0 Network controller: Intel Corporation Wireless 8260 (rev 3a)
● As you can see, ‘lshw’ might be a better choice :)](https://image.slidesharecdn.com/linuxnetworking-180905200006/85/Linux-networking-12-320.jpg)
![Network Interfaces - The Proc Way
● You can see network interfaces list by looking at ‘/proc/net/dev’
[arie@fedora ~]$ cat /proc/net/dev
Inter-| Receive | Transmit
face |bytes packets errs drop fifo frame compressed multicast|bytes
enp0s31f6: 686290777 697340 0 0 0 0 0 0
virbr0: 0 0 0 0 0 0 0 0 0 0
● It provides basic statistics like how many packets sent and received](https://image.slidesharecdn.com/linuxnetworking-180905200006/85/Linux-networking-13-320.jpg)

![Display ARP cache
● ARP is used for converting an IP address to a physical address
● ARP cache is where such coversion entries are stored
● Use ‘ip neigh’ to display the ARP cache
○ It replaced the ‘arp’ command
[arie@fedora ~]$ ip neigh
190.41.2.25 dev enp0s31f6 lladdr 15:b1:52:5c:25:17 STALE
10.52.21.52 dev wlp4s0 lladdr 12:3a:45:b2:ab:55 STALE
● You can also use ‘dev <device_name>’ to see ARP entries related to a specific
device
● Now try reading ‘/proc/net/arp’
○ Does it contains a different data?](https://image.slidesharecdn.com/linuxnetworking-180905200006/85/Linux-networking-15-320.jpg)
![Add ARP entry
● ip neigh can be used to insert a permanent ARP cache
[arie@fedora ~]$ ip neigh add 2.2.2.2 lladdr 00:b1:6a:6a:11:c2 dev eth0 nud permanent
● You can change an ARP entry after it was added
[arie@fedora ~]$ ip neigh change 2.2.2.2 lladdr 00:c1:6a:6a:11:c3 dev eth0](https://image.slidesharecdn.com/linuxnetworking-180905200006/85/Linux-networking-16-320.jpg)
![Remove ARP Entry
● You can remove a specific ARP entry by specifying the IP address and device
[arie@fedora ~]$ ip neigh del 2.2.2.2 dev eth0
● You can also flush all the learned (not permanent) entries
[arie@fedora ~]$ ip neigh flush dev eth0](https://image.slidesharecdn.com/linuxnetworking-180905200006/85/Linux-networking-17-320.jpg)


![The Basics - Exercise Solution
[arie@fedora ~]$ ip a
[arie@fedora ~]$ ping -c 3 -s 100 x.x.x.x
[arie@fedora ~]$ arp | grep <MAC>
[arie@fedora ~]$ ip neigh add 3.3.3.3 lladdr 00:b1:6b:6b:11:c6 dev eth0 nud permanent](https://image.slidesharecdn.com/linuxnetworking-180905200006/85/Linux-networking-20-320.jpg)

![Network Manager
● The default manager for networking service in RHEL 7
● In older releases you might need to install the package ‘NetworkManager’
● You can also install a similar version on Ubuntu
● NM provides you the following tools
○ nmcli (terminal)
○ nmtui (tui, if not installed you can install ‘NetworkManager-tui’ to get it)
○ nm-connection-editor (GUI)
● The network manager daemon is called ‘NetworkManager’
[arie@ubuntu ~]$ sudo apt-get install network-manager
[arie@fedora ~]$ sudo systemctl status NetworkManager
● NetworkManager.service - Network Manager
Loaded: loaded (/usr/lib/systemd/system/NetworkManager.servi…)
Active: active (running) since Tue 2005-09-04 09:15:08 IDT; 34min ago](https://image.slidesharecdn.com/linuxnetworking-180905200006/85/Linux-networking-22-320.jpg)
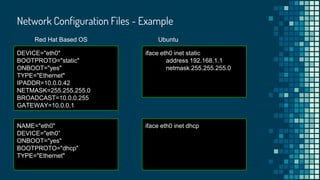
![Network Configuration Files
● You can change network configuration by editing network configuration files
instead of using the tui or gui tools
● Red Hat based operating systems
○ /etc/sysconfig/network-scripts/ifcfg-<interface_name>
● Ubuntu
○ /etc/network/interfaces
○ etc/network/interfaces.d/*
● Once you added/modified an interface
[arie@fedora ~]$ sudo ip link set <interface> down
[arie@fedora ~]$ sudo ip link set <interface> up
● Where NM is used, you can also do the following
[arie@fedora ~]$ sudo nmcli connection reload # for all interfaces
[arie@fedora ~]$ sudo nmcli con load <interface_configuration_file> # for a specific interfacce](https://image.slidesharecdn.com/linuxnetworking-180905200006/85/Linux-networking-23-320.jpg)
![Add a dummy interface
[arie@fedora ~]$ sudo ip link add dumdum type dummy
● Add a dummy interface
[arie@fedora ~]$ sudo ip link set dumdum up
● Bring up the dummy interface
● Is it up? How to check?](https://image.slidesharecdn.com/linuxnetworking-180905200006/85/Linux-networking-25-320.jpg)
![Assign an IP address
[arie@fedora ~]$ sudo ip addr add 192.168.0.50/24 dev dumdum
● Assign an IP address to our dummy interface
[arie@fedora ~]$ sudo ip addr add 192.168.0.50/255.255.255.0 dev dumdum
● Is the following command different from the previous one?
● Verify it has an IP address and ping it
[arie@fedora ~]$ ip a show dumdum && ping -c 1192.168.0.50
dumdum: <BROADCAST,NOARP> mtu 1500 qdisc noop state DOWN group default
qlen 1000
link/ether 06:f1:a6:1b:c9:f5 brd ff:ff:ff:ff:ff:ff
inet 192.168.0.50/24 scope global dumdum
valid_lft forever preferred_lft forever](https://image.slidesharecdn.com/linuxnetworking-180905200006/85/Linux-networking-26-320.jpg)
![Set broadcast address
[arie@fedora ~]$ sudo ip addr add broadcast 192.168.0.255 dev dumdum
● Set broadcast address
● You can also do it while assigning an IP address
[arie@fedora ~]$ sudo ip addr add 192.168.0.50/24 broadcast 192.168.0.255 dev dumdum](https://image.slidesharecdn.com/linuxnetworking-180905200006/85/Linux-networking-27-320.jpg)
![Change MTU size
[arie@fedora ~]$ sudo ip link set dumdum mtu 1800
● Verify it’s the new MTU size
● Will it survive a reboot?
● Set it permanently for Red Hat based OSs
NAME="enp0s31f6"
MTU=”1800”
BOOTPROTO="static" # IMPORTANT
● Set it permanently for interface in Ubuntu
iface eth0 inet static
address 192.168.0.1
...
netmask 255.255.255.0
mtu 1800](https://image.slidesharecdn.com/linuxnetworking-180905200006/85/Linux-networking-28-320.jpg)
![Change speed
[arie@fedora ~]$ sudo ethtool -s eth0 speed 100
● Set it permanently for Red Hat based OSs
NAME="enp0s31f6"
MTU=”1800”
BOOTPROTO="static"
ETHTOOL_OPTS="speed 100”
● Set it permanently for interface in Ubuntu
pre-up /usr/sbin/ethtool -s eth0 100](https://image.slidesharecdn.com/linuxnetworking-180905200006/85/Linux-networking-29-320.jpg)
![Remove an interface
[arie@fedora ~]$ sudo ip link set dumdum down
● Bring down the dummy interface we created
[arie@fedora ~]$ sudo ip link del dumdum
● Delete the dummy interface](https://image.slidesharecdn.com/linuxnetworking-180905200006/85/Linux-networking-30-320.jpg)


![Interfaces Manipulation - Exercise Solution
[arie@fedora ~]$ sudo ip link add pita type dummy
[arie@fedora ~]$ sudo ip addr add 192.168.1.4/24 dev pita
[arie@fedora ~]$ ping -c 4 -s 140 192.168.1.4
[arie@fedora ~]$ sudo ip link set pita mtu 1900
[arie@fedora ~]$ sudo ip link set pita down
[arie@fedora ~]$ sudo ip link del pita](https://image.slidesharecdn.com/linuxnetworking-180905200006/85/Linux-networking-33-320.jpg)

![Recap
● Some of the tools we have seen so far can be used to obtain some information
on what is going on in our system from networking perspective. Let’s recall what
we saw
● Ethtool statistics
[arie@fedora ~]$ sudo ethtool -S <interface_name>
● ethtool interface testing
[arie@fedora ~]$ sudo ethtool -t <interface_name>
● Looking at /proc/net/dev
● Time to move to the next level](https://image.slidesharecdn.com/linuxnetworking-180905200006/85/Linux-networking-35-320.jpg)
![netstat - network connections
● Display information about the networking subsystem
○ By default it displays a list of open sockets
[arie@fedora ~]$ netstat
Proto Recv-Q Send-Q Local Address Foreign Address State
tcp 0 0 mario-p8-kvm-03-gue:39240 api.ohsnap.io:https ESTABLISHED
tcp 0 0 luigi-p8-kvm-03-gue:42310 tumtum.shlipshlop.:http TIME_WAIT
● Common arguments
○ -n to use IP addresses instead of hostname
○ -t to show only tcp connections
○ -p to show the pid of the program
○ -l to show only listening sockets
● Try it yourself: ‘netstat -tnlp’](https://image.slidesharecdn.com/linuxnetworking-180905200006/85/Linux-networking-36-320.jpg)
![netstat - statistics and routing
● Netstat is also able to show you information on routing tables
[arie@fedora ~]$ netstat -r
Destination Gateway Genmask Flags MSS Window irtt Iface
default Box.Home 0.0.0.0 UG 0 0 0 wlp4s0
192.168.14.0 0.0.0.0 255.255.255.0 U 0 0 0 wlp4s0
● And a LOT of statistics
[arie@fedora ~]$ netstat -s](https://image.slidesharecdn.com/linuxnetworking-180905200006/85/Linux-networking-37-320.jpg)
![lsof
● Lists open files
○ Isn’t it a storage tool? Perhaps, but everything in Linux is a file and
that includes a network socket
[arie@fedora ~]$ lsof -i
chrome 9827 abregman 133u IPv4 170 0t0 TCP localhost:57654->ec2-54om:https (ESTABLISHED)
chrome 9827 abregman 179u IPv4 02 0t0 TCP localhost:51928->ec2s.com:https (ESTABLISHED)
● You can make it more specific by specifying hostname, port or a service
[arie@fedora ~]$ lsof -i :openflow
[arie@fedora ~]$ lsof -i :smtp
[arie@fedora ~]$ lsof -i :2312
[arie@fedora ~]$ lsof -i @google.com](https://image.slidesharecdn.com/linuxnetworking-180905200006/85/Linux-networking-38-320.jpg)
![lsof - continue
● Side question: How to know which network services exists and what are their ports?
[arie@fedora ~]$ cat /etc/services
tcpmux 1/tcp # TCP port service multiplexer
tcpmux 1/udp # TCP port service multiplexer
rje 5/tcp # Remote Job Entry
rje 5/udp # Remote Job Entry
● You can see all the open files owned by a specific process
[arie@fedora ~]$ lsof -p <pid>](https://image.slidesharecdn.com/linuxnetworking-180905200006/85/Linux-networking-39-320.jpg)

![Packet Sniffers - tcpdump
● Probably the most popular one
● Installed by default
● Easy start using:
[arie@fedora ~]$ sudo tcpdump
19:48:04.393650 IP 10.0.2.15.ssh > 10.0.2.2.34154: Flags [P.], seq 2880236:2880288, ack 5797, win
36192, length 52
19:48:04.393703 IP 10.0.2.15.ssh > 10.0.2.2.34154: Flags [P.], seq 2880288:2880340, ack 5797, win
36192, length 52
● Overwhelmed already? :)](https://image.slidesharecdn.com/linuxnetworking-180905200006/85/Linux-networking-41-320.jpg)
![Packet Sniffers - tcpdump
● Capture packets from all interfaces
[arie@fedora ~]$ sudo tcpdump -i any
● Capture packets from a specific interface
[arie@fedora ~]$ sudo tcpdump -i eth0
● Track only SSH traffic
[arie@fedora ~]$ sudo tcpdump port 22
● Port range
[arie@fedora ~]$ sudo tcpdump port 22-50](https://image.slidesharecdn.com/linuxnetworking-180905200006/85/Linux-networking-42-320.jpg)
![Packet Sniffers - tcpdump - more examples
● Looking for pings?
[arie@fedora ~]$ sudo tcpdump icmp
● Traffic related to host x.x.x.x
[arie@fedora ~]$ sudo tcpdump host x.x.x.x
● Traffic related to host x.x.x.x (when it’s the source)
[arie@fedora ~]$ sudo tcpdump src x.x.x.x
● Traffic related to host x.x.x.x (when it’s the destination)
[arie@fedora ~]$ sudo tcpdump dst x.x.x.x](https://image.slidesharecdn.com/linuxnetworking-180905200006/85/Linux-networking-43-320.jpg)
![Packet Sniffers - wireshark
● Similar to tcpdump by concept
● Known for its GUI
● Both wireshark and tcpdump use libpcap for capturing packets
[arie@fedora ~]$ sudo wireshark # for launching GUI
[arie@fedora ~]$ sudo tshark # for using CLI
1 0.000000000 10.0.2.2 → 10.0.2.15 SSH 90 Client: Encrypted packet (len=36)
2 0.000271278 10.0.2.15 → 10.0.2.2 SSH 90 Server: Encrypted packet (len=36)
3 0.000724602 10.0.2.2 → 10.0.2.15 TCP 60 34154 → 22 [ACK] Seq=37 Ack=37 Win=65535
4 0.216305358 10.0.2.2 → 10.0.2.15 SSH 90 Client: Encrypted packet (len=36)
5 0.216633149 10.0.2.15 → 10.0.2.2 SSH 90 Server: Encrypted packet (len=36)
6 0.217004223 10.0.2.2 → 10.0.2.15 TCP 60 34154 → 22 [ACK] Seq=73 Ack=73 Win=65535
7 0.399682715 10.0.2.2 → 10.0.2.15 SSH 90 Client: Encrypted packet (len=36)](https://image.slidesharecdn.com/linuxnetworking-180905200006/85/Linux-networking-44-320.jpg)
![Packet Sniffers - wireshark
● Capture packet from all interfaces
[arie@fedora ~]$ sudo tshark -i any
● Capture packets from a specific interface
[arie@fedora ~]$ sudo tshark -i eth0 -w output.pcap
● Track only SSH traffic
[arie@fedora ~]$ sudo tshark port 22
● All packets related to host x.x.x.x
[arie@fedora ~]$ sudo tshark host x.x.x.x](https://image.slidesharecdn.com/linuxnetworking-180905200006/85/Linux-networking-45-320.jpg)


![Network Troubleshooting - Exercise Solution
[arie@fedora ~]$ netstat -an | wc -l
[arie@fedora ~]$ sudo tcpdump port 53 -w dns_traffic
[arie@fedora ~]$ sudo tcpdump udp -w udp_traffic
[arie@fedora ~]$ sudo tcpdump dst x.x.x.x -w dgw_traffic](https://image.slidesharecdn.com/linuxnetworking-180905200006/85/Linux-networking-48-320.jpg)

![Display Routing Table
[arie@fedora ~]$ ip route # You can also use ‘ip r’
default via 10.55.125.254 dev wlp4s0 proto dhcp metric 600
10.31.6.0/21 dev enp0s31f6 proto kernel scope link src 10.31.6.126 metric 100
10.22.66.0/24 dev wlp4s0 proto kernel scope link src 10.22.66.177 metric 600
192.168.1.0/24 dev virbr0 proto kernel scope link src 192.168.1.1 linkdown
● Ip can be used also for displaying the routing table
● First field - destination. Where the packet is sent.
● dev - through which device they will be sent
● proto - who or what added the route entry
● src - the IP source address
● Scope - an indicator to the distance to the destination address
○ Link - LAN
○ Default is global
[arie@
Can you have more
than one default entry?
Do you know?](https://image.slidesharecdn.com/linuxnetworking-180905200006/85/Linux-networking-50-320.jpg)
![Add Routes
[arie@fedora ~]$ sudo ip route add 190.40.5.1 via 10.0.2.15
● Add a static route to a host IP address
[arie@fedora ~]$ sudo ip route add 190.40.5.0/24 via 10.0.2.15
● Add a static route to a network
[arie@fedora ~]$ vi /etc/sysconfig/network
190.20.1.0/24 via 192.168.2.1 eth0
● Permanently in a file (Red Hat):](https://image.slidesharecdn.com/linuxnetworking-180905200006/85/Linux-networking-51-320.jpg)
![Add Routes - continue
[arie@fedora ~]$ sudo vi /etc/network/interfaces
iface eth0 inet static
address 192.168.2.2
netmask 255.255.255.0
up route add -net 192.168.2.0 netmask 255.255.255.0 gw 192.168.1.254
● Permanently in a file (Ubuntu):
[arie@fedora ~]$ sudo ip route add default via 192.168.1.254
● Add a default gateway
● How to verify a route is working?](https://image.slidesharecdn.com/linuxnetworking-180905200006/85/Linux-networking-52-320.jpg)
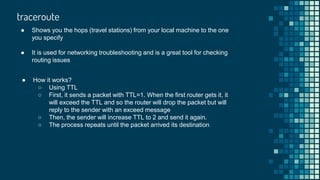
![traceroute - usage
● The usage is quite straightforward
[arie@fedora ~]$ traceroute redhat.com
traceroute to redhat.com (10.1.2.3), 30 hops max, 60 byte packets
1 blabla.redhat.com (10.52.36.252) 2.042 ms 2.244 ms 2.468 ms
2 190.40.2.10 (190.40.2.10) 0.308 ms 0.300 ms 0.426 ms
3 180.50.5.1 (180.50.5.1) 202.564 ms 202.587 ms 202.596 ms
● First line in the output specifies the destination IP, number of maximal
hops and size of packets that will be used
● Rest of the lines describe: hop (name and IP) and packet round trip times
● If you three asterisks (* * *) it means hop is not reachable
○ Firewall
○ Network Congestion](https://image.slidesharecdn.com/linuxnetworking-180905200006/85/Linux-networking-54-320.jpg)
![mtr - the best of both
● mtr = ping + traceroute
[arie@fedora ~]$ mtr --report redhat.com
Start: 2018-09-05T15:45:32+0300
HOST: dblabla.ran.redhat.com Loss% Snt Last Avg Best Wrst StDev
1.|-- blabla.ran.redhat 0.0% 10 1.3 1.7 0.7 2.6 0.6
2.|-- 194.40.2.10 0.0% 10 22.8 37.6 12.1 94.5 36.0
3.|-- 190.55.2.1 0.0% 10 0.7 0.6 0.4 0.7 0.1](https://image.slidesharecdn.com/linuxnetworking-180905200006/85/Linux-networking-55-320.jpg)

![Network Bonding
[arie@fedora ~]$ sudo modprobe bonding
● Bind two or more network interfaces together into a one logical interface
● Why?
○ Increasing bandwidth
○ Redundancy
● Requirements
○ Kernel bonding module
● Terminology
○ Master - the logical new interface
○ Slaves - the existing interfaces used for the bonding](https://image.slidesharecdn.com/linuxnetworking-180905200006/85/Linux-networking-57-320.jpg)


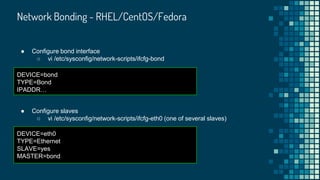
![Network Bonding - How To in RHEL/CentOS/Fedora
● Define mode
○ vi /etc/modprobe.d/bonding.conf
alias bond bonding
Options bond mode=1
● Bring the new bond interface up
[arie@fedora ~]$ sudo ip link set bond up](https://image.slidesharecdn.com/linuxnetworking-180905200006/85/Linux-networking-61-320.jpg)

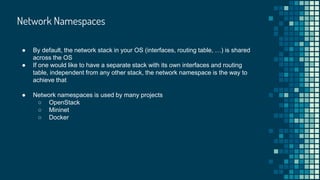
![Network Namespaces - Usage
● Create your first network namespace
[arie@fedora ~]$ sudo ip netns add ns1
● List namespaces
[arie@fedora ~]$ sudo ip netns list
ns1
[arie@fedora ~]$ sudo ip netns del ns1
● Remove a network namespace](https://image.slidesharecdn.com/linuxnetworking-180905200006/85/Linux-networking-65-320.jpg)
![● Once a network namespace was created a corresponding file is created at
/var/run/netns
● You can execute commands inside a network namespace with ‘ip nents exec’
[arie@fedora ~]$ sudo ip netns exec ns1 ip a
1: lo: <LOOPBACK> mtu 65536 qdisc noop state DOWN group default qlen 1
link/loopback 00:00:00:00:00:00 brd 00:00:00:00:00:00
[arie@
Are network namespaces
persistent across system
reboots?
Do you know?
Network Namespaces - Usage
● You can work fluently inside a namespace by running a shell
[arie@fedora ~]$ sudo ip netns exec ns1 bash
[root@fedora ~]$](https://image.slidesharecdn.com/linuxnetworking-180905200006/85/Linux-networking-66-320.jpg)
![● You can assign an interface from the default namespace to your newly created
namespace
[arie@fedora ~]$ sudo ip link set eth0 netns ns1
Network Namespaces - Usage](https://image.slidesharecdn.com/linuxnetworking-180905200006/85/Linux-networking-67-320.jpg)
![● Special type that provides you a pair of two interfaces (you can’t have one
without the other)
● Perfect for namespace scenarios as it allows you to have one end in a network
namespace and the other in another network namespace or in the global
namespace
● You can add veth interfaces with the ip command
[arie@fedora ~]$ sudo ip link add v0 type veth peer name v1
Side topic: veth interfaces](https://image.slidesharecdn.com/linuxnetworking-180905200006/85/Linux-networking-68-320.jpg)

![Kernel Parameters
● You can modify over thousand of kernel runtime parameters that will allow you
to change drastically the behaviour of your OS
● Many of them are network related parameters
● Use the following command to see exactly how many parameters you can
change
[arie@fedora ~]$ sudo sysctl -a | wc -l
1684
● We’ll review some of the more common and interesting parameters you can change
○ For a full list (with an explanation) I recommend to visit the following site](https://image.slidesharecdn.com/linuxnetworking-180905200006/85/Linux-networking-70-320.jpg)
![Changing Kernel Parameters
[arie@fedora ~]$ sysctl net.ipv4.ip_forward
● Obtain the value of a specific kernel parameter
[arie@fedora ~]$ sysctl -w net.ipv4.ip_forward=1
net.ipv4.ip_forward=1
● Modify a kernel parameter
● We can also do it with writing to proc
[arie@fedora ~]$ echo 1 > /proc/sys/net/ipv4/ip_forward
● To change it permanently (reboot persistent) write to /etc/sysctl.conf
[arie@fedora ~]$ echo “net.ipv4.ip_forward=1” >> /etc/sysctl.conf](https://image.slidesharecdn.com/linuxnetworking-180905200006/85/Linux-networking-71-320.jpg)
![Forward Packets
● Some kernels will not forward automatically packets that meant for someone
else
● In order to turn our server into a kind of router, we need to enable packet
forwarding
[arie@fedora ~]$ sysctl -w net.ipv4.ip_forward=1
net.ipv4.ip_forward=1
● Note that this is not the only step required for turning our Linux server into a router
○ Modification of iptables rules is also needed but we’ll not cover it here](https://image.slidesharecdn.com/linuxnetworking-180905200006/85/Linux-networking-72-320.jpg)
![Ignore Broadcast Messages
● Broadcast messages can be bad for your (server’s) health
○ Smurf Attack
● One can ignore such messages by setting the following parameter to 1
[arie@fedora ~]$ echo 1 > /proc/sys/net/ipv4/icmp_echo_ignore_broadcasts](https://image.slidesharecdn.com/linuxnetworking-180905200006/85/Linux-networking-73-320.jpg)


![Final Exercise - Solution
[arie@fedora ~]$ sudo ip netns add ns1
[arie@fedora ~]$ sudo ip netns add ns2
[arie@fedora ~]$ sudo ip link add v1 type veth peer name v2
[root@fedora ~]$ sudo ip link set v1 netns ns1
[root@fedora ~]$ sudo ip link set v2 netns ns2
[root@fedora ~]$ sudo ip netns exec ns1 ip addr add 10.1.1.3/16 dev v1
[root@fedora ~]$ sudo ip netns exec ns2 ip addr add 10.1.1.4/16 dev v2
[root@fedora ~]$ sudo ip netns exec ns1 ip link set v1 up
[root@fedora ~]$ sudo ip netns exec ns2 ip link set v2 up
[root@fedora ~]$ sysctl -w net.ipv4.ip_forward=1 # this step is not required. Just
wanted you to practice setting kernel parameters :P
[root@fedora ~]$ sudo ip netns exec ns1 ping 10.1.1.4
[root@fedora ~]$ sudo ip netns exec ns2 ping 10.1.1.3](https://image.slidesharecdn.com/linuxnetworking-180905200006/85/Linux-networking-76-320.jpg)