Downloaded 13 times


For hyperlinks to
resources & further
assistance
**bold text**
*italic text*
You can use asterix’s to bold
or italic your text. This can
help raise awareness to
insights or
recommendations you have
discovered
Contact information for
feedback, further
reporting and clarification
if required.](https://image.slidesharecdn.com/adambsv2-181023101820/85/Life-As-a-Brandwatch-Analyst-31-320.jpg)

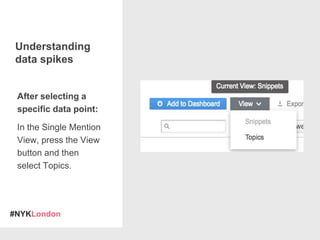
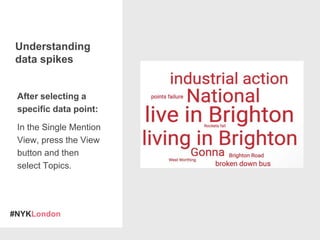
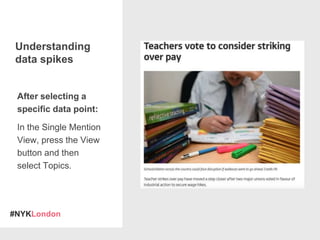
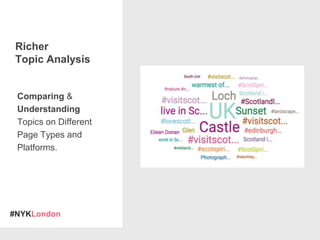
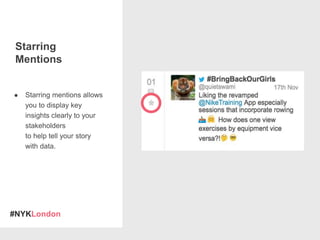
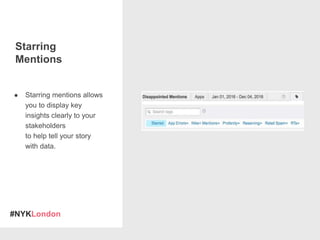
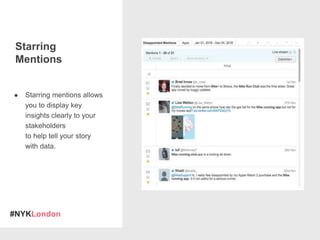
The document discusses tips for using the Brandwatch analytics tool to discover insights and tell stories with data. It provides advice on maximizing data through storytelling, understanding data spikes by analyzing topics, filtering topics by page type, starring key mentions, and creating effective dashboards for communicating insights. The document emphasizes balancing clarity with context, closely integrating data and description, and using annotation components and effective dashboard usage to guide the audience.


