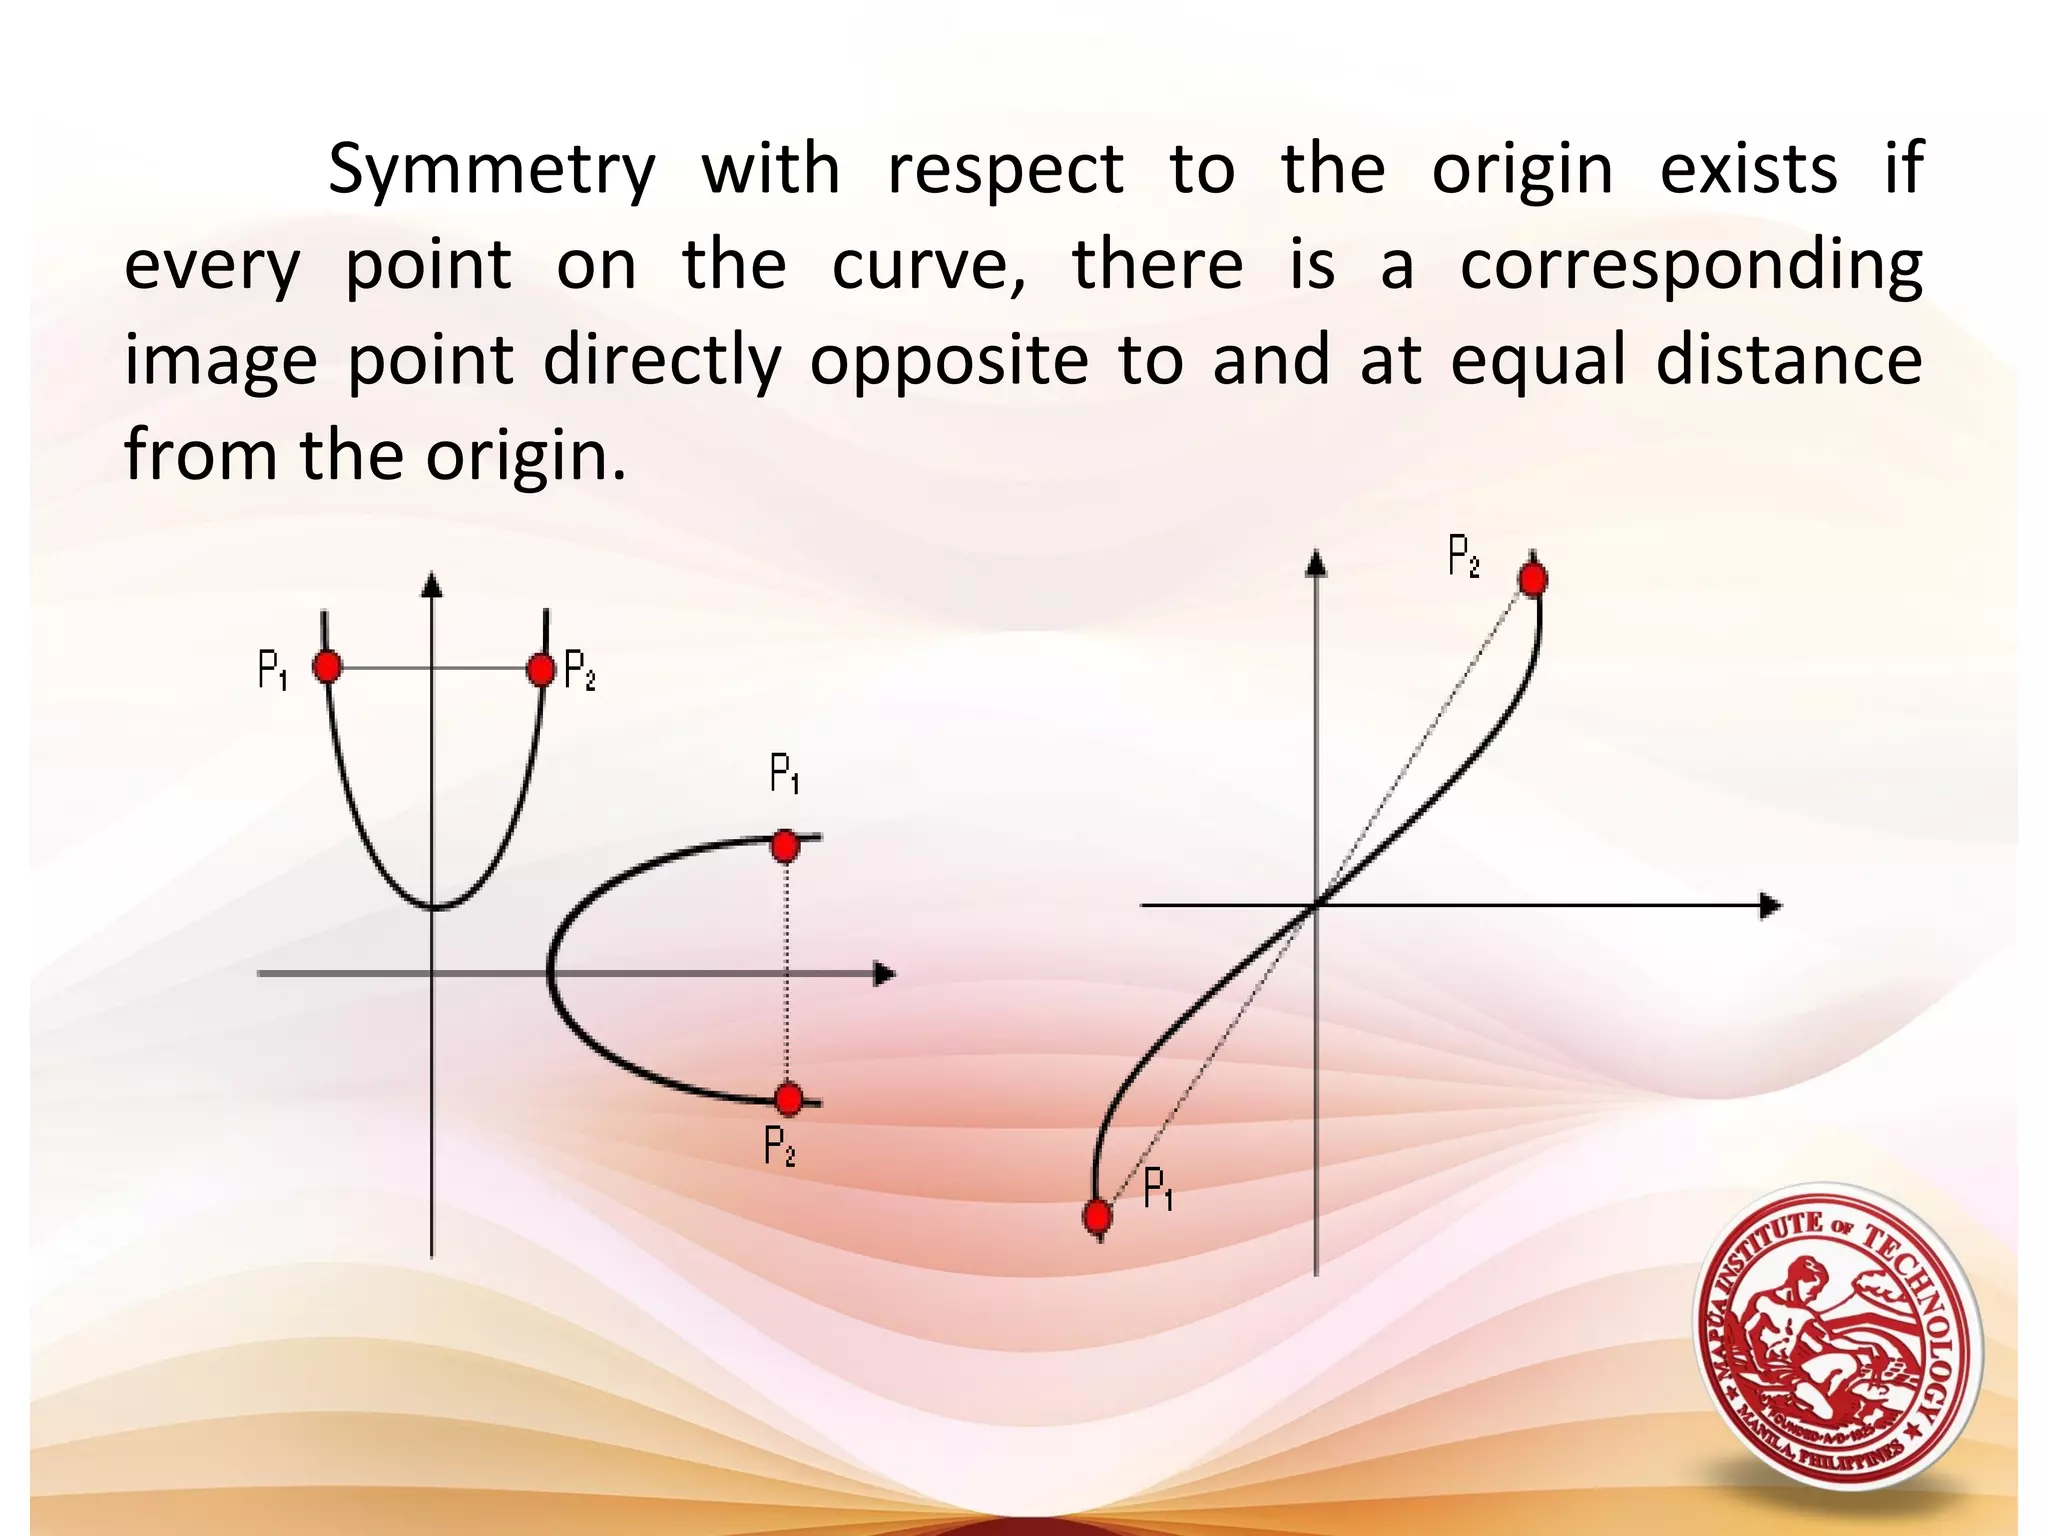
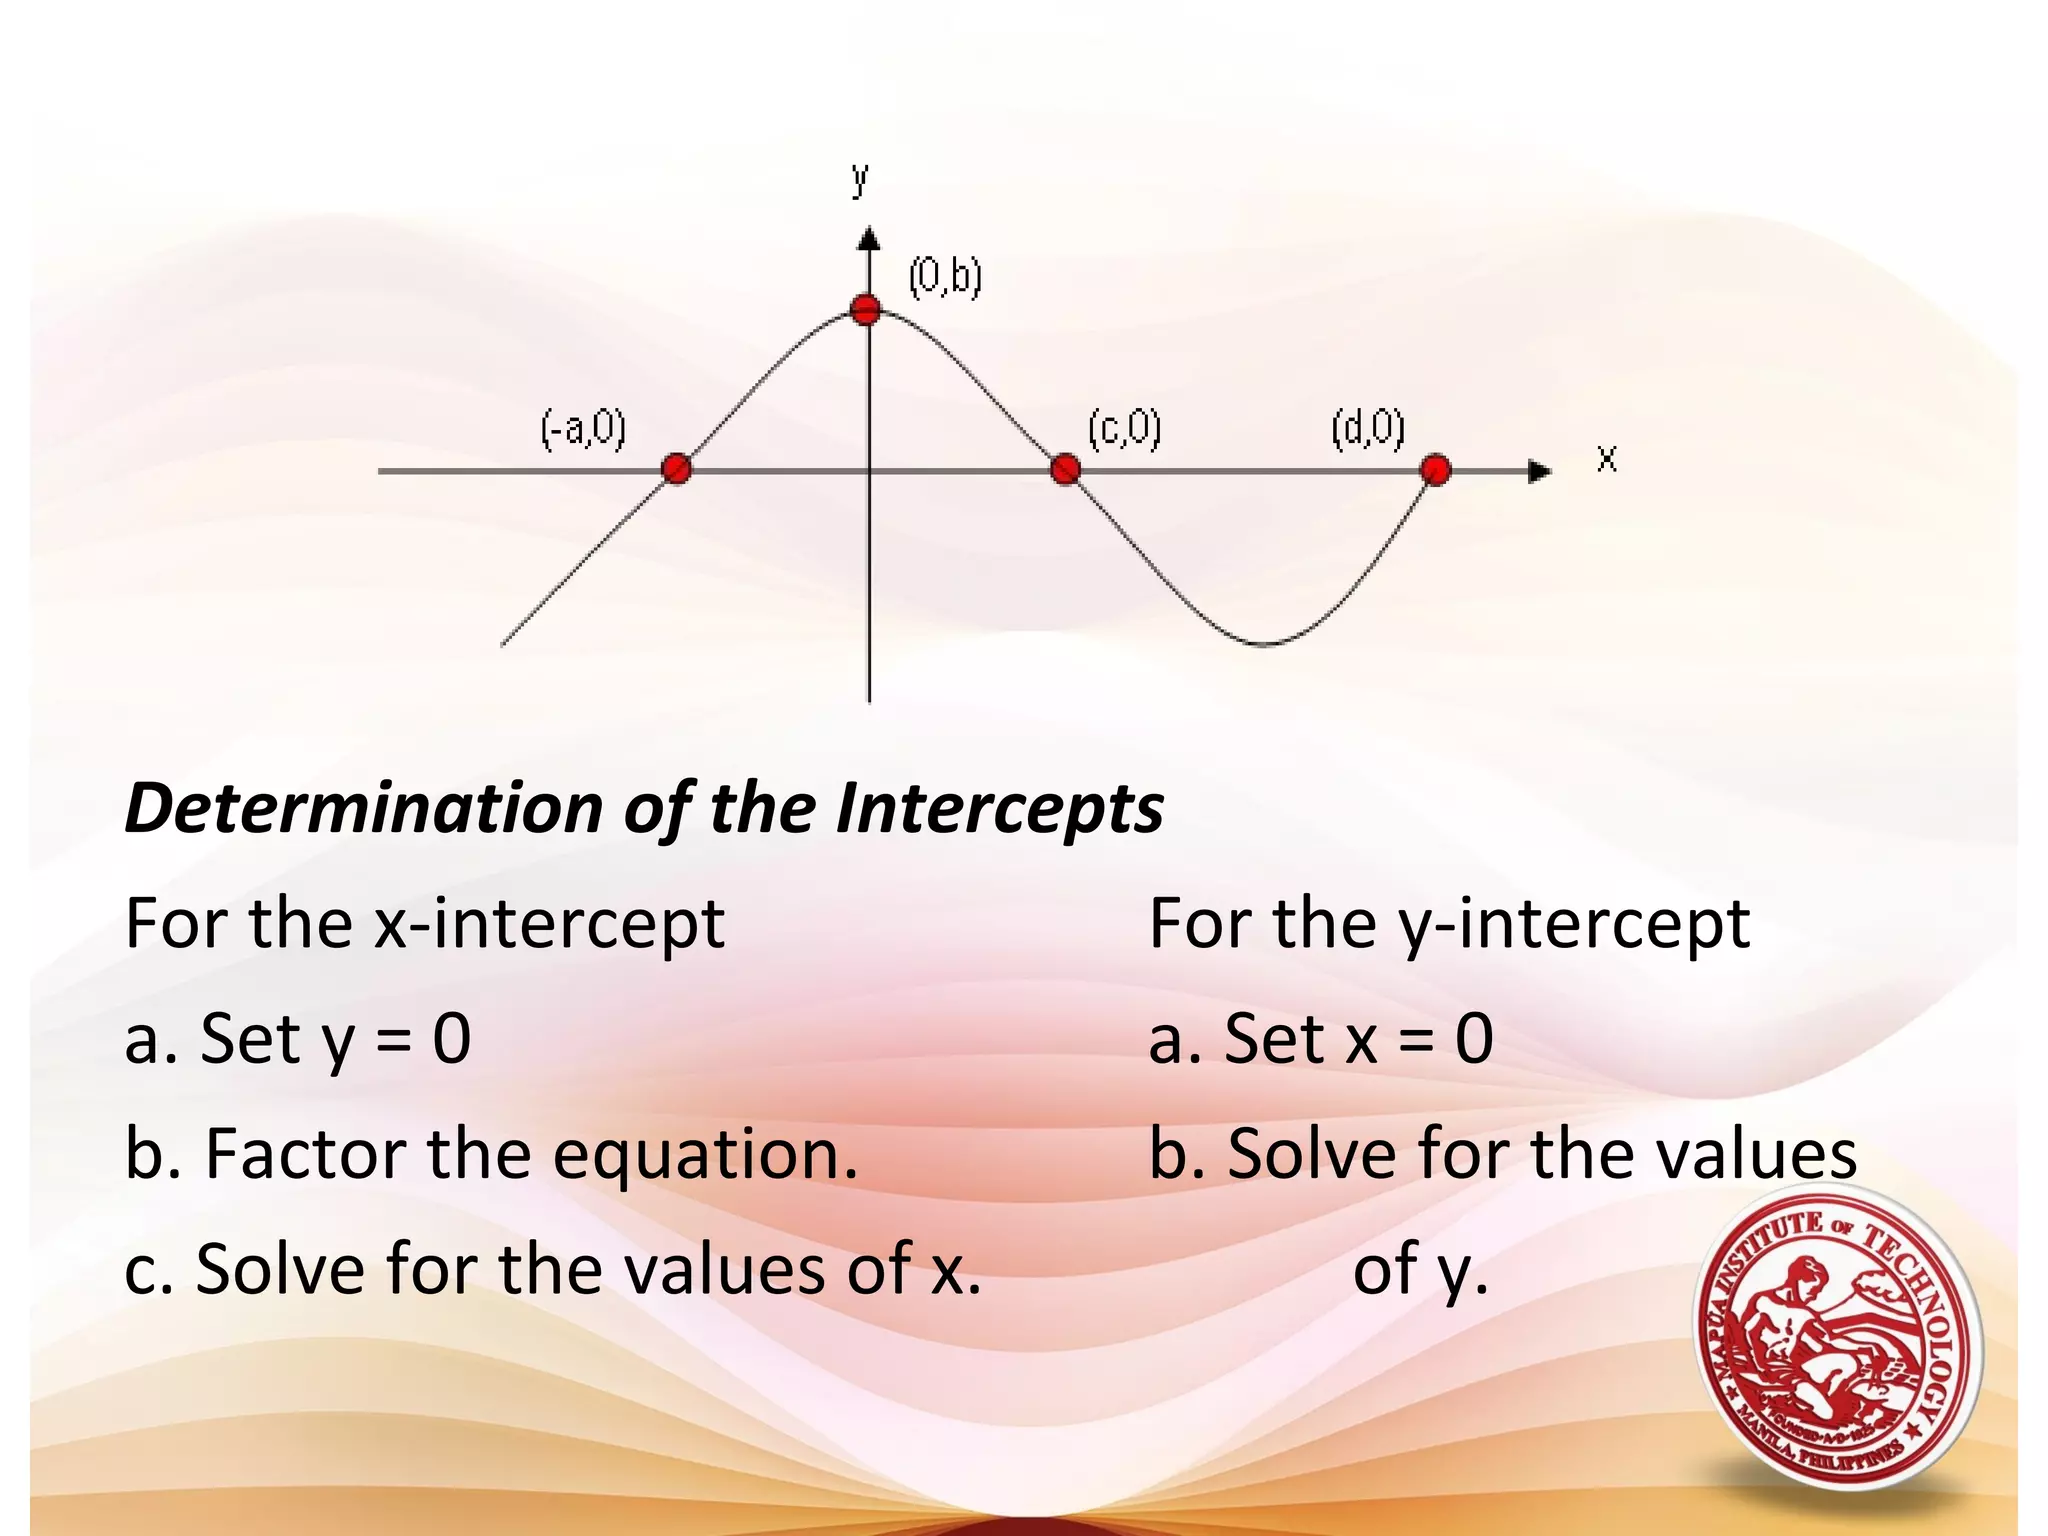
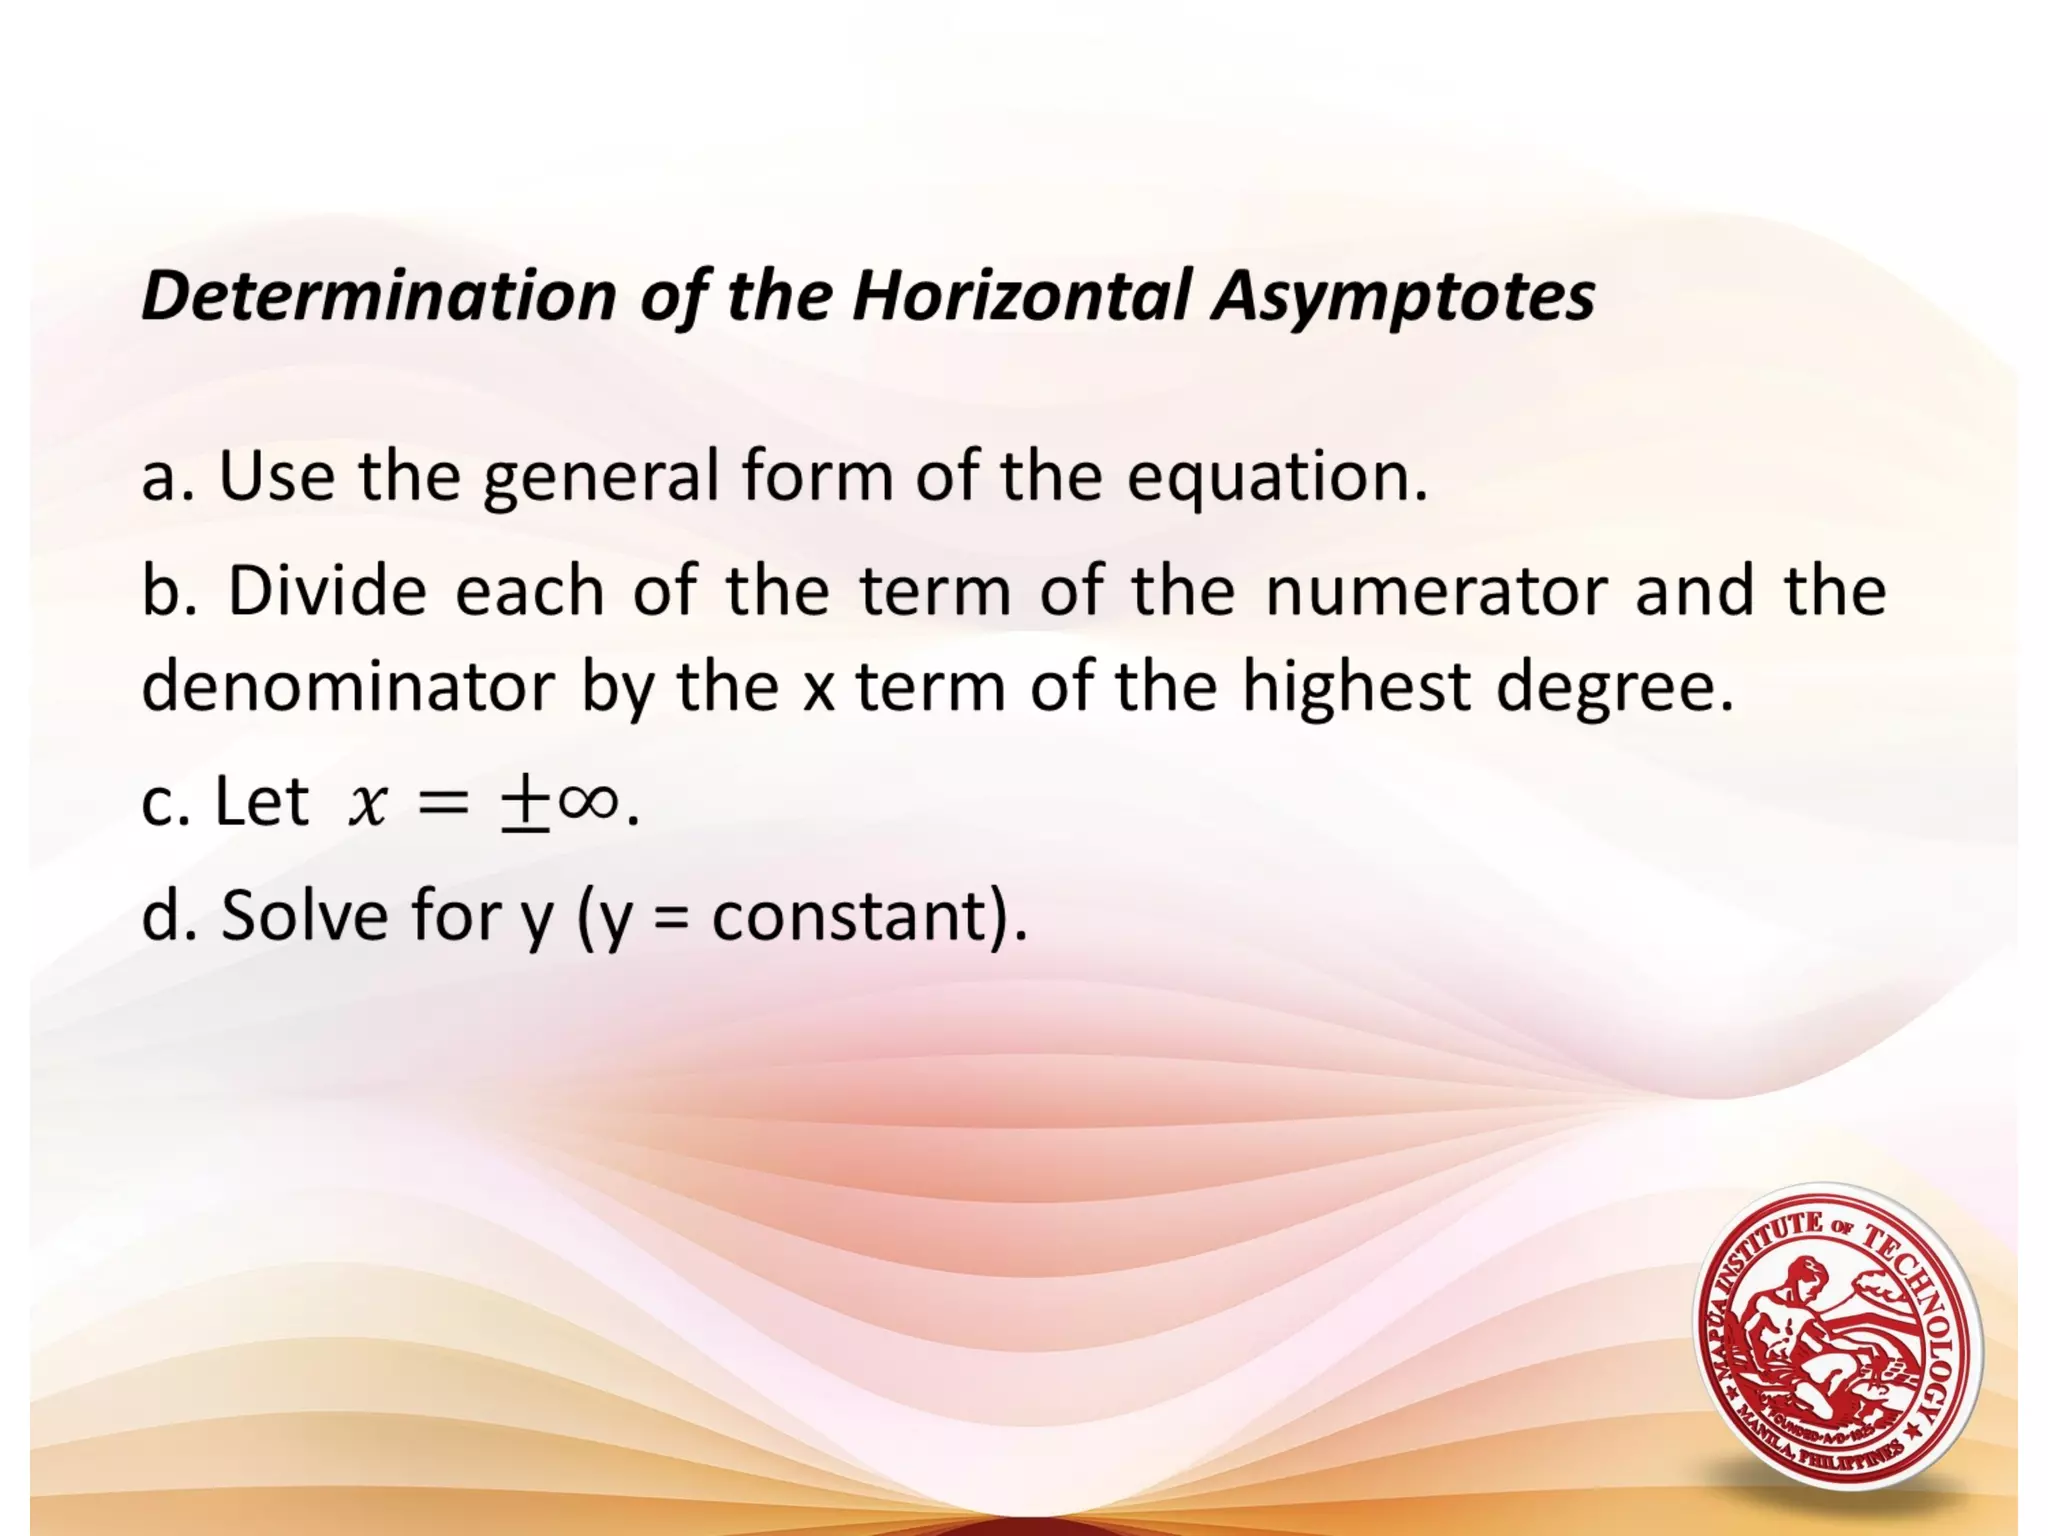
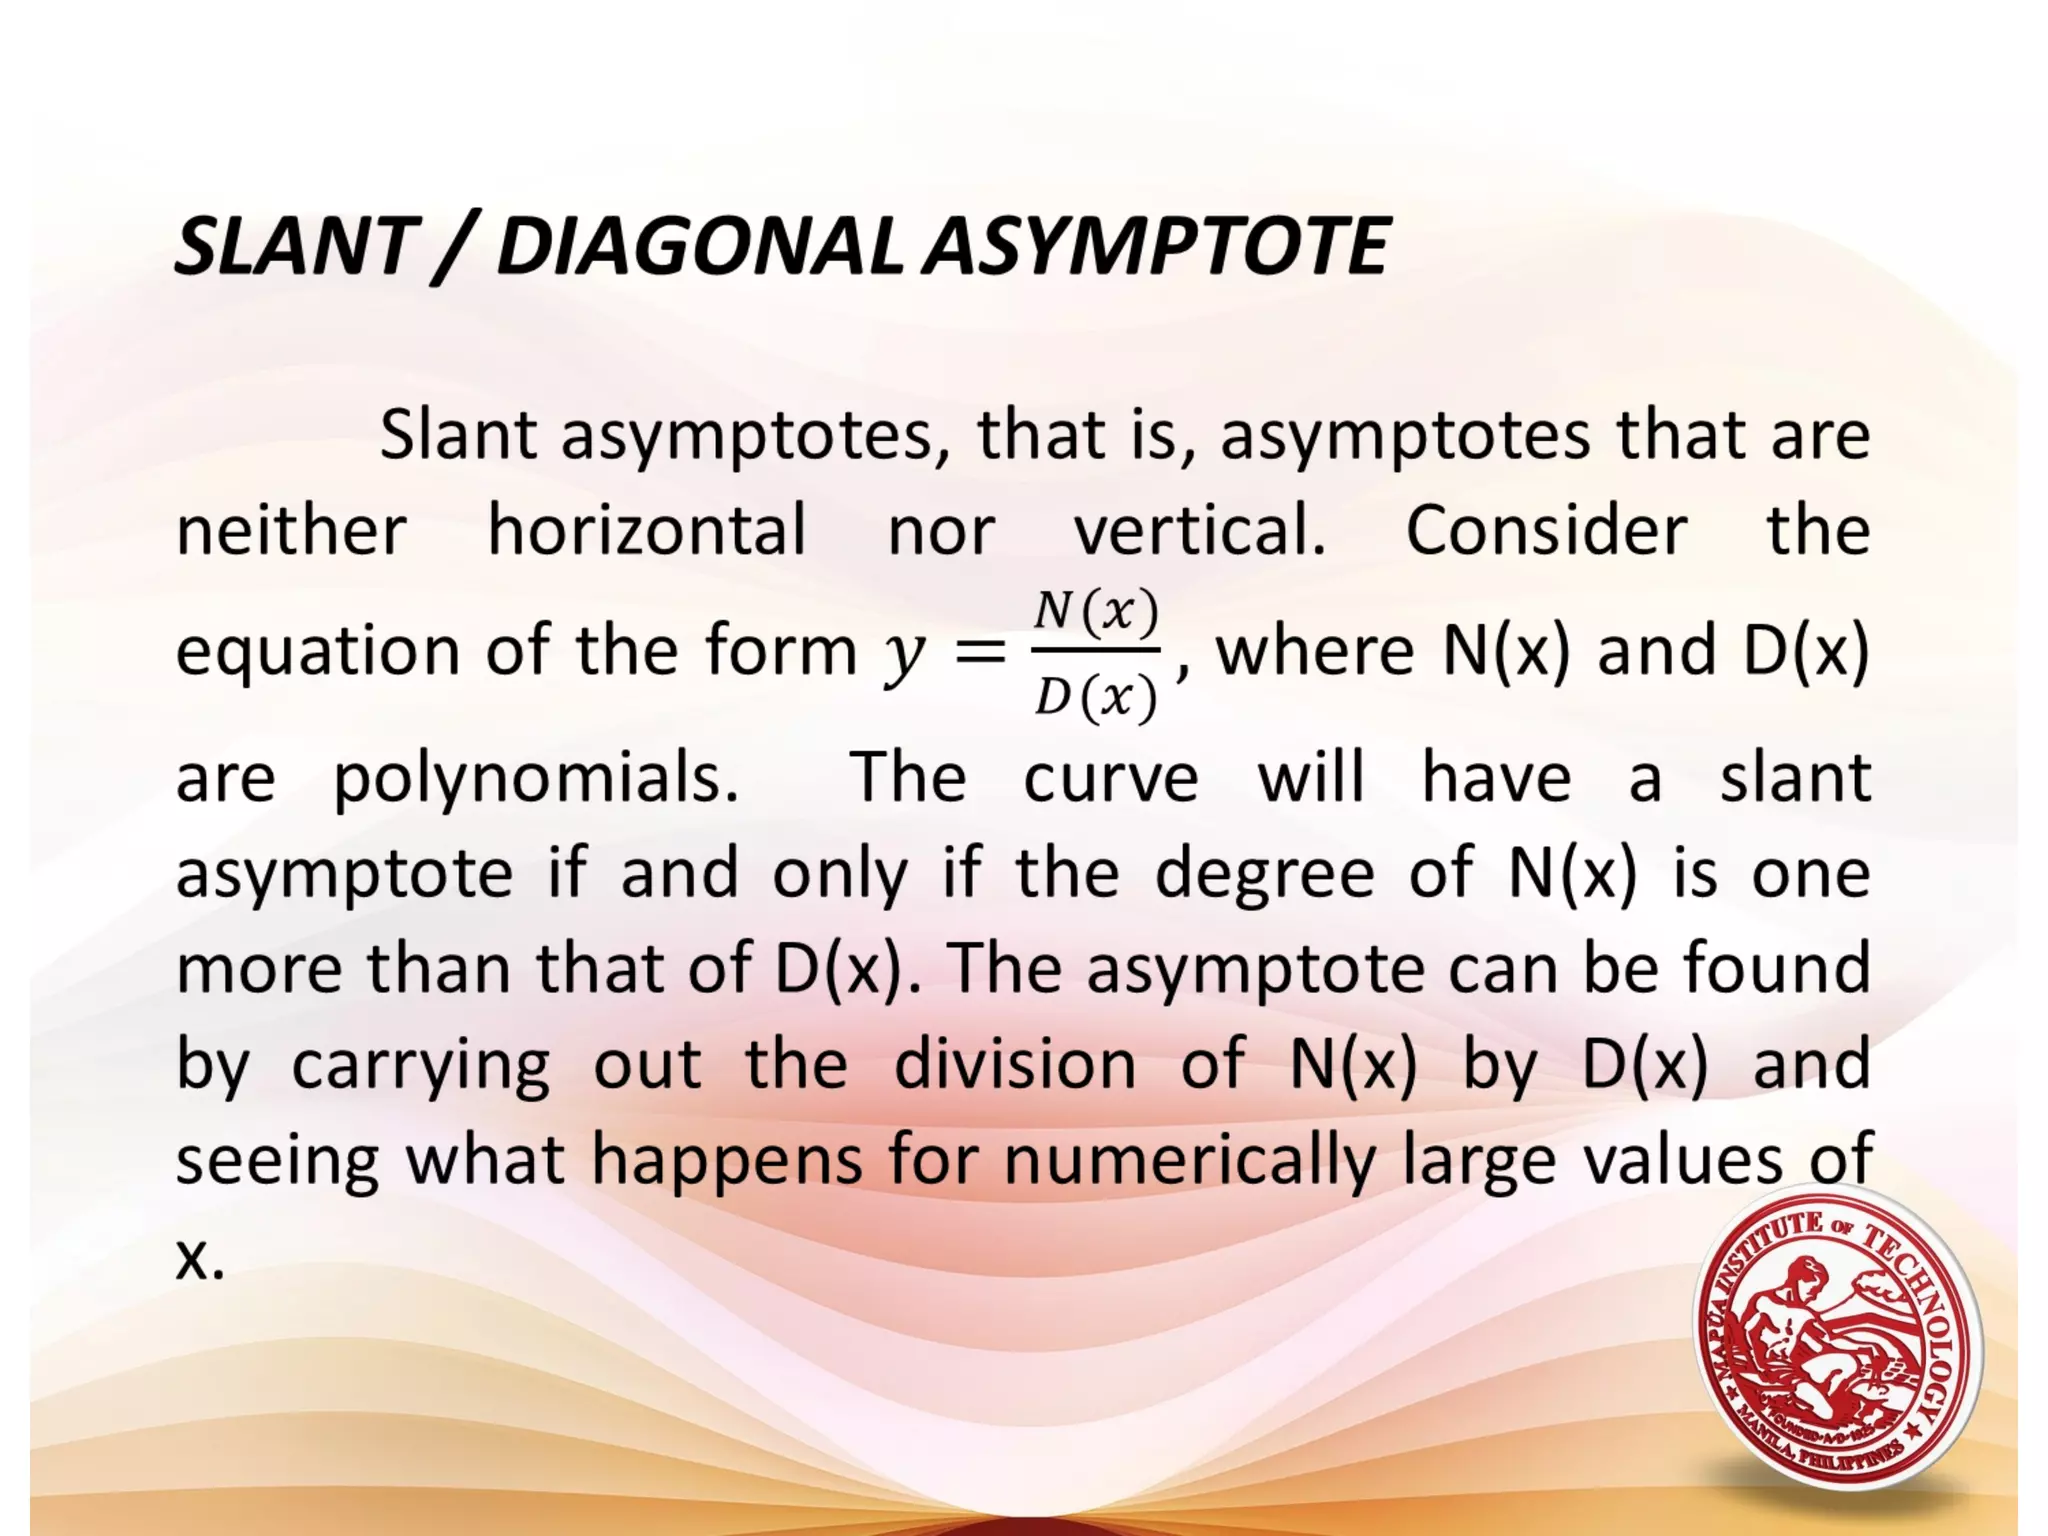
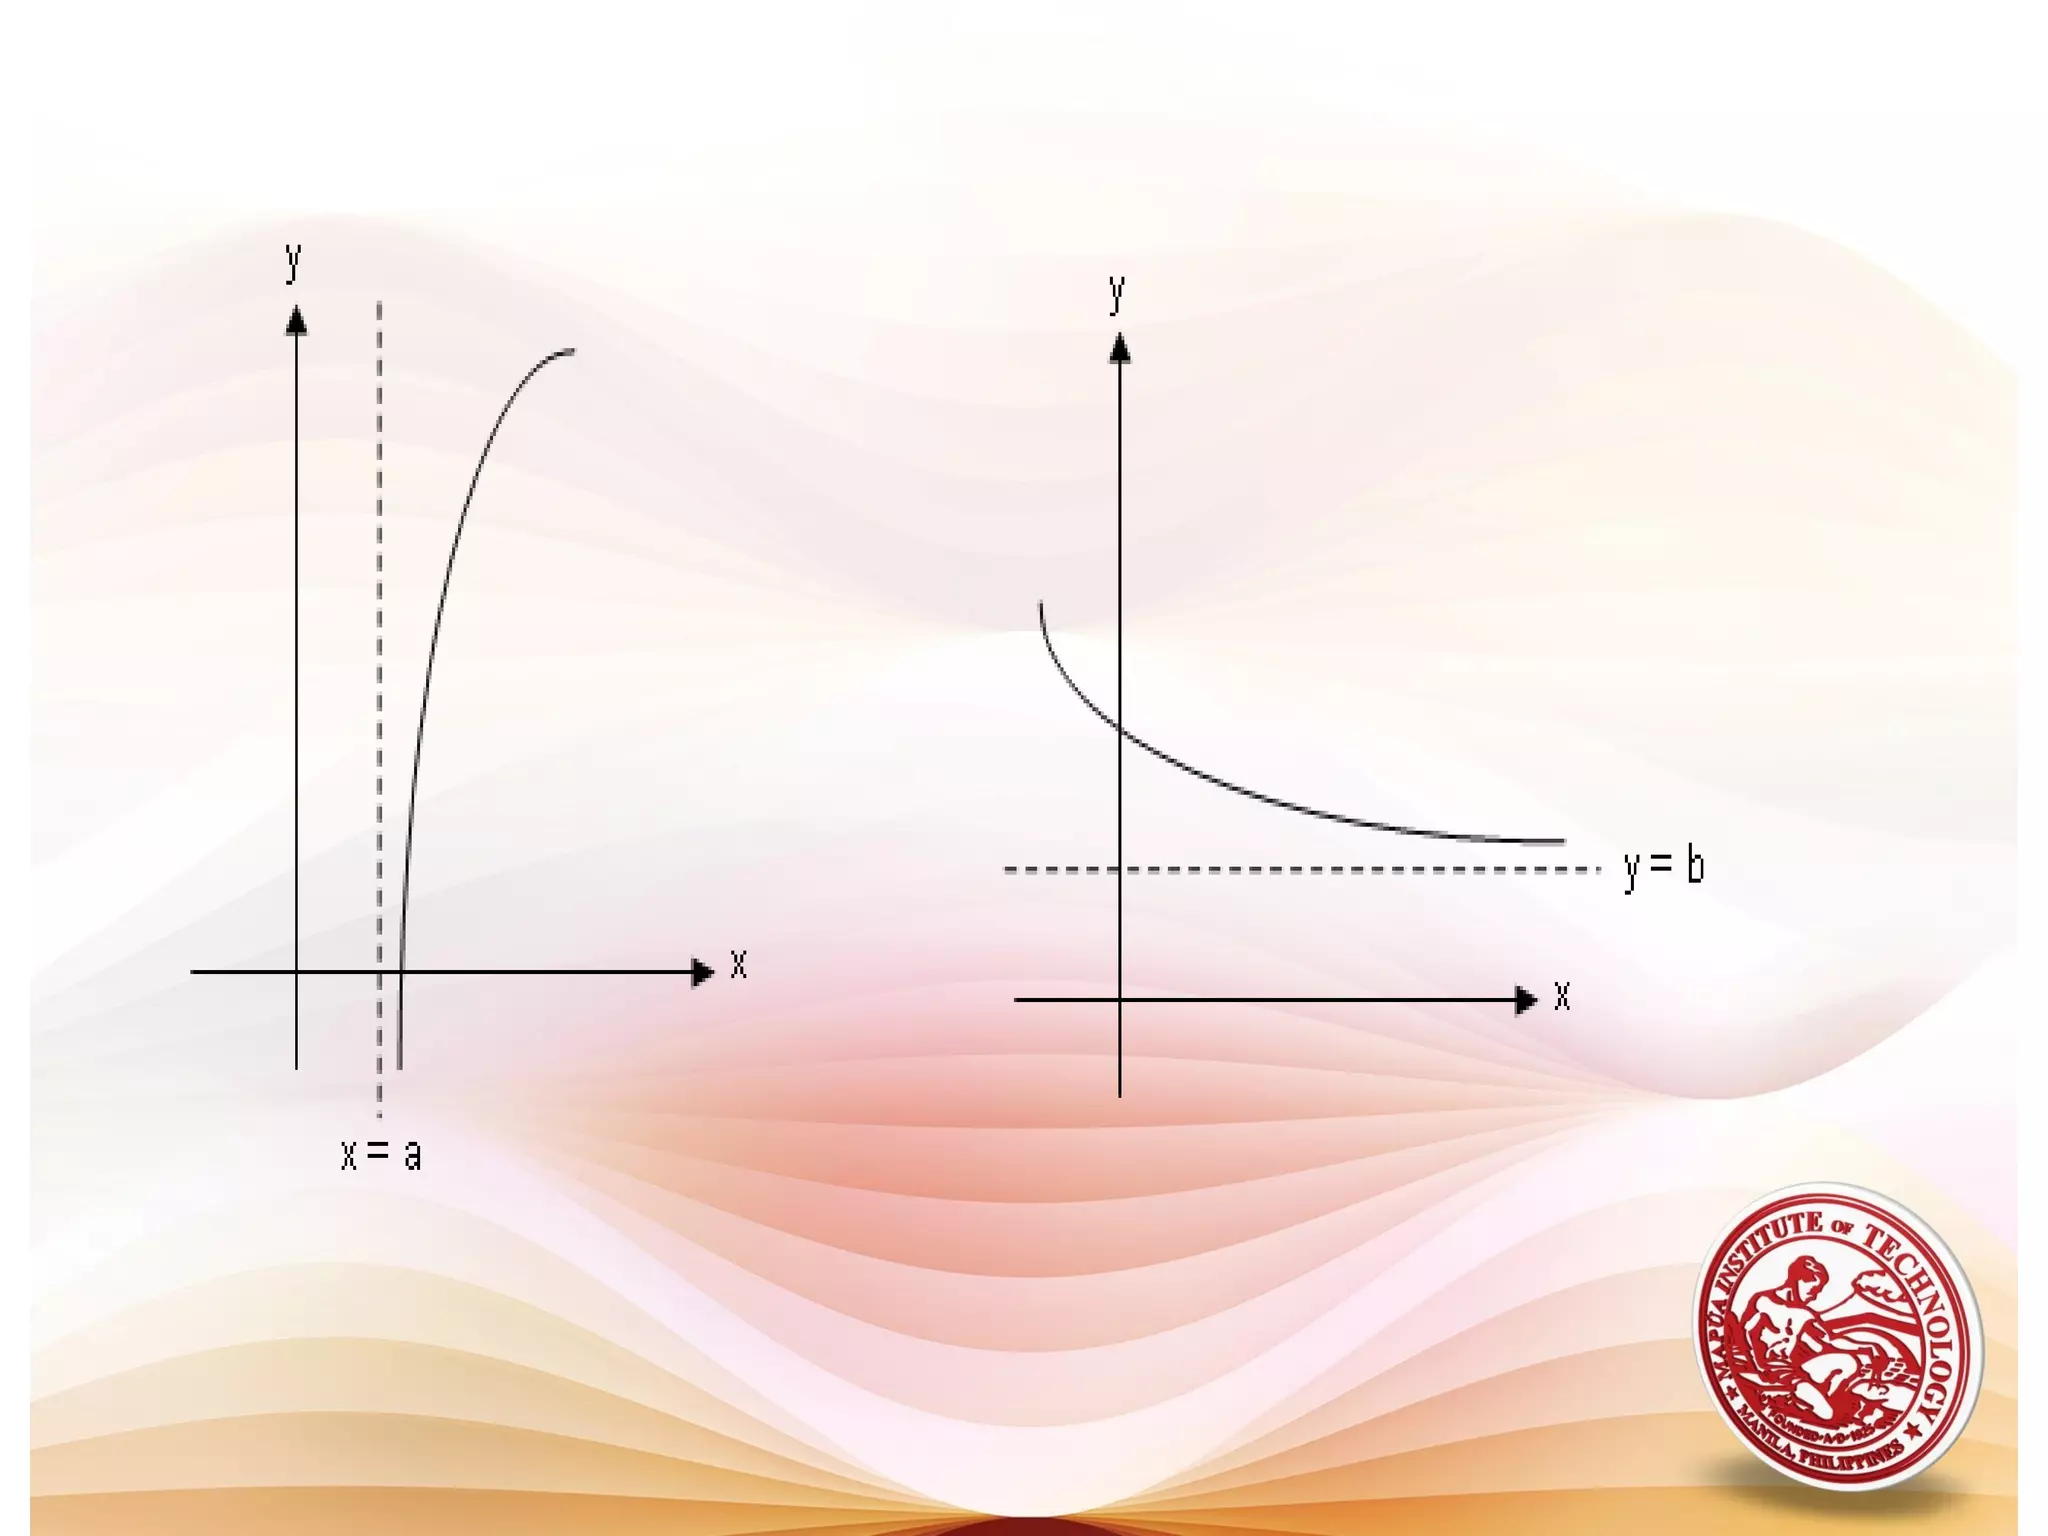
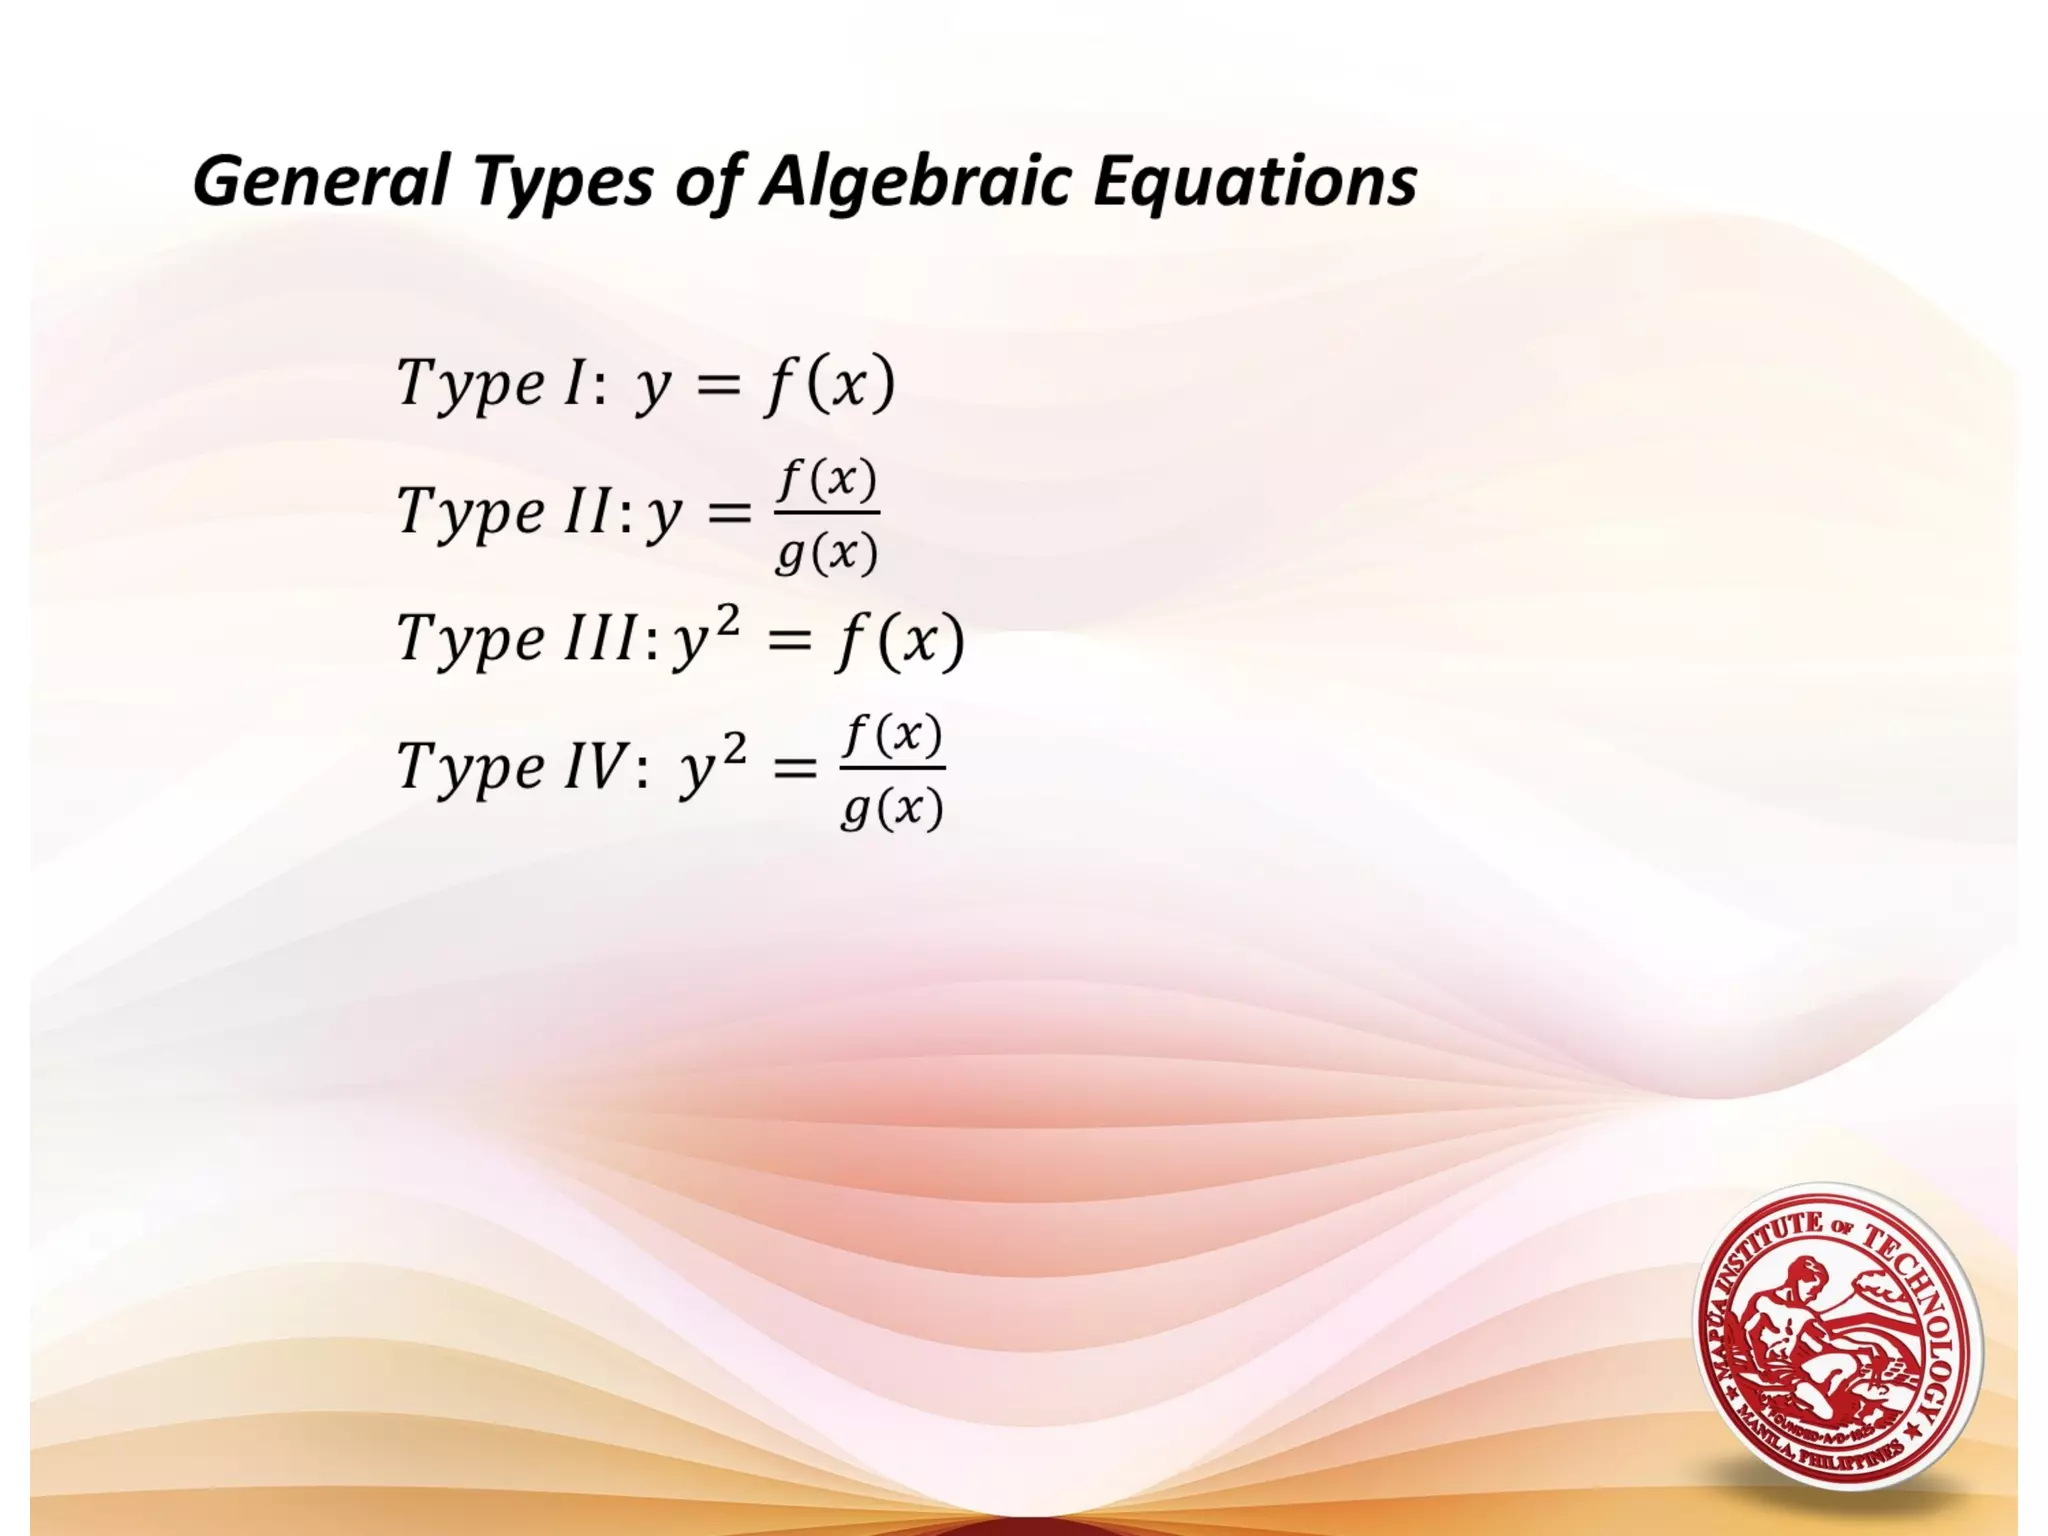
1) The document defines algebraic curves as geometric figures formed by the set of points satisfying a given equation relating x and y.
2) Key properties of algebraic curves include their extent (domain and range), symmetry, intercepts, and asymptotes. Symmetry can be tested by substituting -x or -y. Intercepts are where the curve crosses the axes. Asymptotes are lines a curve approaches but never touches.
3) Tracing a curve involves determining its region, testing for symmetry, finding intercepts and asymptotes, and plotting points to sketch the curve.
Basic geometrical constuctions is how to construct angle by using compass and ruler.
this slide can help students or teachers to construct any angles especially for special angles they are 90 degree, 60 degree, 45 degree and 30 degree.
Basic geometrical constuctions is how to construct angle by using compass and ruler.
this slide can help students or teachers to construct any angles especially for special angles they are 90 degree, 60 degree, 45 degree and 30 degree.
By this end of the presentation you will be able to:
Identify and model points, lines, and planes.
Identify collinear and coplanar points.
Identify non collinear and non coplanar points.
21 - GRAPHS THE SYSTEMS OF LINEAR EQUATIONS IN TWO VARIABLES.pptxbernadethvillanueva1
GRAPHS THE SYSTEMS OF LINEAR EQUATIONS IN TWO VARIABLES
Lesson 6: Polar, Cylindrical, and Spherical coordinatesMatthew Leingang
"The fact that space is three-dimensional is due to nature. The way we measure it is due to us." Cartesian coordinates are one familiar way to do that, but other coordinate systems exist which are more useful in other situations.
APEX INSTITUTE has been established with sincere and positive resolve to do something rewarding for ENGG. / PRE-MEDICAL aspirants. For this the APEX INSTITUTE has been instituted to provide a relentlessly motivating and competitive atmosphere.
GDG Cloud Southlake #33: Boule & Rebala: Effective AppSec in SDLC using Deplo...James Anderson
Effective Application Security in Software Delivery lifecycle using Deployment Firewall and DBOM
The modern software delivery process (or the CI/CD process) includes many tools, distributed teams, open-source code, and cloud platforms. Constant focus on speed to release software to market, along with the traditional slow and manual security checks has caused gaps in continuous security as an important piece in the software supply chain. Today organizations feel more susceptible to external and internal cyber threats due to the vast attack surface in their applications supply chain and the lack of end-to-end governance and risk management.
The software team must secure its software delivery process to avoid vulnerability and security breaches. This needs to be achieved with existing tool chains and without extensive rework of the delivery processes. This talk will present strategies and techniques for providing visibility into the true risk of the existing vulnerabilities, preventing the introduction of security issues in the software, resolving vulnerabilities in production environments quickly, and capturing the deployment bill of materials (DBOM).
Speakers:
Bob Boule
Robert Boule is a technology enthusiast with PASSION for technology and making things work along with a knack for helping others understand how things work. He comes with around 20 years of solution engineering experience in application security, software continuous delivery, and SaaS platforms. He is known for his dynamic presentations in CI/CD and application security integrated in software delivery lifecycle.
Gopinath Rebala
Gopinath Rebala is the CTO of OpsMx, where he has overall responsibility for the machine learning and data processing architectures for Secure Software Delivery. Gopi also has a strong connection with our customers, leading design and architecture for strategic implementations. Gopi is a frequent speaker and well-known leader in continuous delivery and integrating security into software delivery.
Kubernetes & AI - Beauty and the Beast !?! @KCD Istanbul 2024Tobias Schneck
As AI technology is pushing into IT I was wondering myself, as an “infrastructure container kubernetes guy”, how get this fancy AI technology get managed from an infrastructure operational view? Is it possible to apply our lovely cloud native principals as well? What benefit’s both technologies could bring to each other?
Let me take this questions and provide you a short journey through existing deployment models and use cases for AI software. On practical examples, we discuss what cloud/on-premise strategy we may need for applying it to our own infrastructure to get it to work from an enterprise perspective. I want to give an overview about infrastructure requirements and technologies, what could be beneficial or limiting your AI use cases in an enterprise environment. An interactive Demo will give you some insides, what approaches I got already working for real.
Accelerate your Kubernetes clusters with Varnish CachingThijs Feryn
A presentation about the usage and availability of Varnish on Kubernetes. This talk explores the capabilities of Varnish caching and shows how to use the Varnish Helm chart to deploy it to Kubernetes.
This presentation was delivered at K8SUG Singapore. See https://feryn.eu/presentations/accelerate-your-kubernetes-clusters-with-varnish-caching-k8sug-singapore-28-2024 for more details.
Key Trends Shaping the Future of Infrastructure.pdfCheryl Hung
Keynote at DIGIT West Expo, Glasgow on 29 May 2024.
Cheryl Hung, ochery.com
Sr Director, Infrastructure Ecosystem, Arm.
The key trends across hardware, cloud and open-source; exploring how these areas are likely to mature and develop over the short and long-term, and then considering how organisations can position themselves to adapt and thrive.
JMeter webinar - integration with InfluxDB and GrafanaRTTS
Watch this recorded webinar about real-time monitoring of application performance. See how to integrate Apache JMeter, the open-source leader in performance testing, with InfluxDB, the open-source time-series database, and Grafana, the open-source analytics and visualization application.
In this webinar, we will review the benefits of leveraging InfluxDB and Grafana when executing load tests and demonstrate how these tools are used to visualize performance metrics.
Length: 30 minutes
Session Overview
-------------------------------------------
During this webinar, we will cover the following topics while demonstrating the integrations of JMeter, InfluxDB and Grafana:
- What out-of-the-box solutions are available for real-time monitoring JMeter tests?
- What are the benefits of integrating InfluxDB and Grafana into the load testing stack?
- Which features are provided by Grafana?
- Demonstration of InfluxDB and Grafana using a practice web application
To view the webinar recording, go to:
https://www.rttsweb.com/jmeter-integration-webinar
Connector Corner: Automate dynamic content and events by pushing a buttonDianaGray10
Here is something new! In our next Connector Corner webinar, we will demonstrate how you can use a single workflow to:
Create a campaign using Mailchimp with merge tags/fields
Send an interactive Slack channel message (using buttons)
Have the message received by managers and peers along with a test email for review
But there’s more:
In a second workflow supporting the same use case, you’ll see:
Your campaign sent to target colleagues for approval
If the “Approve” button is clicked, a Jira/Zendesk ticket is created for the marketing design team
But—if the “Reject” button is pushed, colleagues will be alerted via Slack message
Join us to learn more about this new, human-in-the-loop capability, brought to you by Integration Service connectors.
And...
Speakers:
Akshay Agnihotri, Product Manager
Charlie Greenberg, Host
LF Energy Webinar: Electrical Grid Modelling and Simulation Through PowSyBl -...DanBrown980551
Do you want to learn how to model and simulate an electrical network from scratch in under an hour?
Then welcome to this PowSyBl workshop, hosted by Rte, the French Transmission System Operator (TSO)!
During the webinar, you will discover the PowSyBl ecosystem as well as handle and study an electrical network through an interactive Python notebook.
PowSyBl is an open source project hosted by LF Energy, which offers a comprehensive set of features for electrical grid modelling and simulation. Among other advanced features, PowSyBl provides:
- A fully editable and extendable library for grid component modelling;
- Visualization tools to display your network;
- Grid simulation tools, such as power flows, security analyses (with or without remedial actions) and sensitivity analyses;
The framework is mostly written in Java, with a Python binding so that Python developers can access PowSyBl functionalities as well.
What you will learn during the webinar:
- For beginners: discover PowSyBl's functionalities through a quick general presentation and the notebook, without needing any expert coding skills;
- For advanced developers: master the skills to efficiently apply PowSyBl functionalities to your real-world scenarios.
Software Delivery At the Speed of AI: Inflectra Invests In AI-Powered QualityInflectra
In this insightful webinar, Inflectra explores how artificial intelligence (AI) is transforming software development and testing. Discover how AI-powered tools are revolutionizing every stage of the software development lifecycle (SDLC), from design and prototyping to testing, deployment, and monitoring.
Learn about:
• The Future of Testing: How AI is shifting testing towards verification, analysis, and higher-level skills, while reducing repetitive tasks.
• Test Automation: How AI-powered test case generation, optimization, and self-healing tests are making testing more efficient and effective.
• Visual Testing: Explore the emerging capabilities of AI in visual testing and how it's set to revolutionize UI verification.
• Inflectra's AI Solutions: See demonstrations of Inflectra's cutting-edge AI tools like the ChatGPT plugin and Azure Open AI platform, designed to streamline your testing process.
Whether you're a developer, tester, or QA professional, this webinar will give you valuable insights into how AI is shaping the future of software delivery.
Transcript: Selling digital books in 2024: Insights from industry leaders - T...BookNet Canada
The publishing industry has been selling digital audiobooks and ebooks for over a decade and has found its groove. What’s changed? What has stayed the same? Where do we go from here? Join a group of leading sales peers from across the industry for a conversation about the lessons learned since the popularization of digital books, best practices, digital book supply chain management, and more.
Link to video recording: https://bnctechforum.ca/sessions/selling-digital-books-in-2024-insights-from-industry-leaders/
Presented by BookNet Canada on May 28, 2024, with support from the Department of Canadian Heritage.
Transcript: Selling digital books in 2024: Insights from industry leaders - T...
Lesson 13 algebraic curves
1. ALGEBRAIC CURVES
Prepared by:
Prof. Teresita P. Liwanag – Zapanta
B.S.C.E., M.S.C.M., M.Ed. (Math-units), PhD-TM (on-going)
2. SPECIFIC OBJECTIVES
At the end of the lesson, the student is
expected to be able to:
• define and describe the properties of algebraic
curves
• identify the intercepts of a curve
• test the equation of a curve for symmetry
• identify the vertical and horizontal asymptotes
• sketch algebraic curves
3. ALGEBRAIC CURVES
An equation involving the variables x and y
is satisfied by an infinite number of values of x
and y, and each pair of values corresponds to a
point. When plotted on the Cartesian plane, these
points follow a pattern according to the given
equation and form a definite geometric figure
called the CURVE or LOCUS OF THE EQUATION.
4. The method of drawing curves by point-
plotting is a tedious process and usually difficult.
The general appearance of a curve may be
developed by examining some of the properties of
curves.
PROPERTIES OF CURVES
The following are some properties of an algebraic
curve:
1. Extent
2. Symmetry
7.Intercepts
8.Asymptotes
5. 1. EXTENT
The extent of the graph of an algebraic curve
involves its domain and range. The domain is the
set of permissible values for x and the range is the
set of permissible values for y.
Regions on which the curve lies and which is
bounded by broken or light vertical lines through
the intersection of the curve with the x-axis.
To determine whether the curve lies above
and/or below the x-axis, solve for the equation of y
or y2 and note the changes of the sign of the right
hand member of the equation.
6. 2. SYMMETRY
Symmetry with respect to the coordinate axes
exists on one side of the axis if for every point of the
curve on one side of the axis, there is a
corresponding image on the opposite side of the axis.
Symmetry with respect to the origin exists if
every point on the curve, there is a corresponding
image point directly opposite to and at equal
distance from the origin.
7. Symmetry with respect to the origin exists if
every point on the curve, there is a corresponding
image point directly opposite to and at equal distance
from the origin.
8. Test for Symmetry
1. Substitute –y for y, if the equation is unchanged
then the curve is symmetrical with respect to the
x-axis.
2. Substitute –x for x, if the equation is unchanged
the curve is symmetrical with respect to the y- axis.
3. Substitute – x for x and –y for y, if the equation is
unchanged then the curve is symmetrical with
respect to the origin.
9. Simplified Test for Symmetry
1. If all y terms have even exponents therefore the
curve is symmetrical with respect to the x-axis.
2. If all x terms have even exponents therefore the
curve is symmetrical with respect to the y-axis.
3. If all terms have even exponents therefore the
curve is symmetrical with respect to the origin.
10. 3. INTERCEPTS
These are the points which the curve crosses
the coordinate axes.
a. x-intercepts – abscissa of the points at which the
curve crosses the x-axis.
b. y-intercepts – ordinate of the points at which the
curve crosses the y-axis.
11. Determination of the Intercepts
For the x-intercept For the y-intercept
a. Set y = 0 a. Set x = 0
b. Factor the equation. b. Solve for the values
c. Solve for the values of x. of y.
12. 4. Asymptotes
A straight line is said to be an asymptote of a
curve if the curve approaches such a line more and
more closely but never really touches it except as a
limiting position at infinity. Not all curves have
asymptotes.
Types of Asymptotes
6.Vertical Asymptote
7.Horizontal Asymptote
8.Slant/Diagonal Asymptote
13.
14.
15.
16.
17.
18.
19. Steps in Curve Tracing
1. If the equation is given in the form of f( x, y) = 0,
solve for y (or y2) to express the equation in a form
identical with the one of the four general types of
the equation.
2. Subject the equation to the test of symmetry.
3. Determine the x and y intercepts.
4. Determine the asymptotes if any. Also determine
the intersection of the curve with the horizontal
asymptotes.
Note: The curve may intercept the horizontal
asymptotes but not the vertical asymptotes.
20. 5. Divide the plane into regions by drawing light
vertical lines through the intersection on the x-axis.
Note: All vertical asymptotes must be considered as
dividing lines.
6. Find the sign of y on each region using the
factored form of the equation to determine whether
the curve lies above and/or below the x-axis.
7. Trace the curve. Plot a few points if necessary.