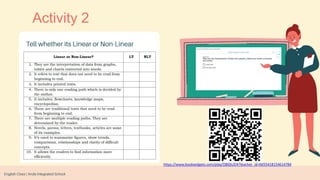
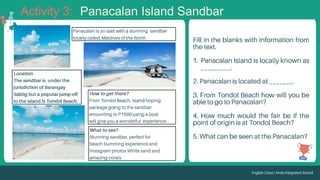
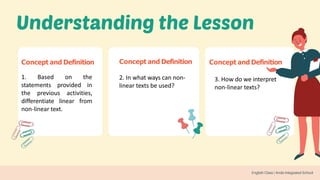
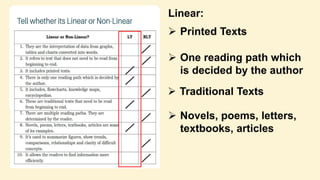
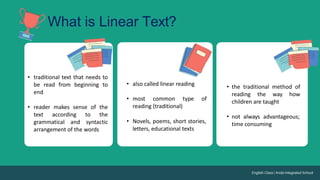
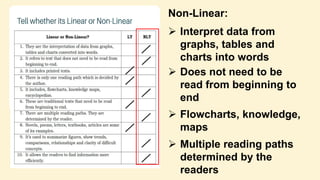
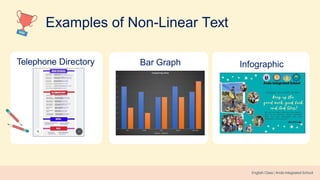
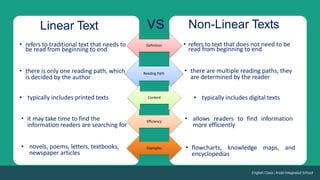
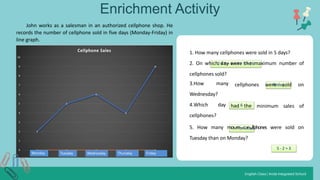
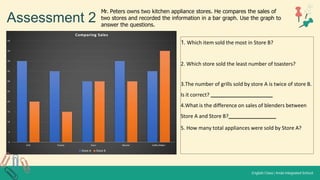
English 7
Linear and Non-Linear Texts
Opening
Prayer
Good afternoon!
Welcome back to class!
Good afternoon!
Welcome back to class!
T
oday'slesson
•
• identify linear and non-linear texts;
• differentiate linear from non-linear text;
• interpret data in non-linear texts
Activity 1: Vocabulary Check
https://www.bookwidgets.com/play/RB6VMRG?teacher_id=6655418154614784
Activity 1: Vocabulary Check
Activity 2
https://www.bookwidgets.com/play/DB6SUD4?teacher_id=6655418154614784
Activity 2
Activity 3: Panacalan Island Sandbar
Panacalan Island Sandbar
Activity 3:
Panacalan Island Sandbar: How to get there
Concept and Definition
1. Based
statements
on the
provided in
the previous activities,
differentiate linear from
non-linear text.
2. In what ways can non-
linear texts be used?
3. How do we interpret
non-linear texts?
Concept and Definition Concept and Definition
Linear:
 Printed Texts
 One reading path which
is decided by the author
 Traditional Texts
 Novels, poems, letters,
textbooks, articles
• traditional text that needs to
be read from beginning to
end
• reader makes sense of the
text according to the
grammatical and syntactic
arrangement of the words
• the traditional method of
reading the way how
children are taught
• not always advantageous;
time consuming
What is Linear Text?
• also called linear reading
• most common type of
reading (traditional)
• Novels, poems, short stories,
letters, educational texts
Examples of Linear Text
Essay Article Poem
Non-Linear:
 Interpret data from
graphs, tables and
charts into words
 Does not need to be
read from beginning to
end
 Flowcharts, knowledge,
maps
 Multiple reading paths
determined by the
readers
Non-Linear:
 Summarize figures,
show trends,
comparisons,
relationships, clarity of
difficult concepts
 Allows the readers to
find information more
efficiently
What is Non-Linear Text?
• opposite of linear text; non
sequential
• reader makes sense of the
text in many different paths
• includes texts with visuals or
graphs
• flowcharts, charts, and
graphs, graphical organizers
(knowledge maps and story
maps)
• any text that is read not
from beginning to end
• encyclopedia, telephone
directory
• follows skimming to obtain
specific information
Examples of Non-Linear Text
Telephone Directory Bar Graph Infographic
Examples of Non-Linear Text
Flow Chart Histogram Pie Chart
•
•
•
•
•
vs
Linear Text
• refers to traditional text that needs to
be read from beginning to end
• there is only one reading path, which
is decided by the author
• typically includes printed texts
• it may take time to find the
information readers are searching for
• novels, poems, letters, textbooks,
newspaper articles
Non-Linear Texts
• refers to text that does not need to be
read from beginning to end
• there are multiple reading paths, they
are determined by the reader
• typically includes digital texts
• allows readers to find information
more efficiently
• flowcharts, knowledge maps, and
encyclopedias
Definition
Reading Path
Examples
Efficiency
Content
Ready for a
quiz?
Clarified?
Enrichment Activity
cellphones were sold on
cellphones sold?
3. How many
Wednesday?
the minimum sales of
4. Which day had
cellphones?
5. How many more cellphones were sold on
Tuesday than on Monday?
John works as a salesman in an authorized cellphone shop. He
records the number of cellphone sold in five days (Monday-Friday) in
line graph.
1. How many cellphones were sold in 5 days?
2. On which day were the maximum number of
Monday Tuesday Wednesday Thursday Friday
Enrichment Activity
minimum sales of
cellphones sold?
3.How many
Wednesday?
4.Which day
cellphones?
Monday Tuesday Wednesday Thursday Friday
John works as a salesman in an authorized cellphone shop. He
records the number of cellphone sold in five days (Monday-Friday) in
line graph.
1. How many cellphones were sold in 5 days?
2. On which2d
+a
5y
+ 6
w+
e4
re
+ 9
th
=e
26maximum number of
cellphones werF
e
riday
sold on
had 6 the
5. How many moMreoncdeayllphones were sold on
Tuesday than on Monday?
5 - 2 = 3
Ready for a
quiz now?
Assessment 1
Answer the given questions
1. How many kids liked apples? _
2.Which fruit did the most kids like?
3.Which fruit did the kids like the least? _
4.How many kids liked bananas?
5.How many kids liked either pear or bananas?
_
6.How many kids liked either oranges or apples?
_
Assessment 1
Answer the given questions
1. How many kids liked apples?
2. Which fruit did the most kids like? _
3.Which fruit did the kids like the least?
4.How many kids liked bananas?
4
Orange
Banana
2
5.How many kids liked either pear or bananas?
6.How 5many kids liked either oranges or apples?
_
6 + 4 = 10
Assessment 2
1. Which item sold the most in Store B?
2. Which store sold the least number of toasters?
3.The number of grills sold by store A is twice of store B.
Is it correct?
4.What is the difference on sales of blenders between
Store A and Store B?
5. How many total appliances were sold by Store A?
Mr. Peters owns two kitchen appliance stores. He compares the sales of
two stores and recorded the information in a bar graph. Use the graph to
answer the questions.
Assessment 2
Mr. Peters owns two kitchen appliance stores. He compares the sales of
two stores and recorded the information in a bar graph. Use the graph to
answer the questions.
1. Which item sold the most in Store B?
Coffee Maker
2. Which store sold the least number of toasters?
3.The numbS
eto
rr
oe
fB
grills sold by store A is twice of store B.
Is it correct?
4.What is the difference on sales of blenYe
ds
ersbetween
Store A and Store B?
5. How many total appliances were sold b
4
y
0 –
St
3
o
0
r=
e1
A
0
?
20 + 15 + 30 + 30 + 45 = 140
Assignment
Use the line graph to answer the following
questions about the data.
1. How many cars were sold during May?
2. How many cars were sold in the first
3 months of the year?
3. How many more cars were sold in
July than May?
4. Which month had 26 car sales?
5.Answer TRUE, FALSE, or CAN’T TELL to each
of the statement below:
Here is a graph showing the sales of used cars
at the Salamander Autos.
Assignment
3 months of the year?
Here is a graph showing the sales of used cars
at the Salamander Autos.
Use the line graph to answer the following
questions about the data.
1. How many cars were sold during May?
20
2. How many cars were sold in the first
59
3. How many more cars were sold in
July than May? 6 _
4. Which month had 26 car sales?
5.An6swer TRUE, FALSE, or CAN’T TELL to each
of the statement below:
Yes
Yes
Yes
False
False
English7 T
eacher

linearandnon-lineartexts-ppt.pptx

  • 1.
    English 7 Linear andNon-Linear Texts
  • 2.
  • 3.
  • 4.
    Good afternoon! Welcome backto class! T oday'slesson • • identify linear and non-linear texts; • differentiate linear from non-linear text; • interpret data in non-linear texts
  • 5.
    Activity 1: VocabularyCheck https://www.bookwidgets.com/play/RB6VMRG?teacher_id=6655418154614784
  • 6.
  • 7.
  • 8.
  • 9.
    Activity 3: PanacalanIsland Sandbar
  • 10.
  • 11.
    Panacalan Island Sandbar:How to get there
  • 12.
    Concept and Definition 1.Based statements on the provided in the previous activities, differentiate linear from non-linear text. 2. In what ways can non- linear texts be used? 3. How do we interpret non-linear texts? Concept and Definition Concept and Definition
  • 13.
    Linear:  Printed Texts One reading path which is decided by the author  Traditional Texts  Novels, poems, letters, textbooks, articles
  • 14.
    • traditional textthat needs to be read from beginning to end • reader makes sense of the text according to the grammatical and syntactic arrangement of the words • the traditional method of reading the way how children are taught • not always advantageous; time consuming What is Linear Text? • also called linear reading • most common type of reading (traditional) • Novels, poems, short stories, letters, educational texts
  • 15.
    Examples of LinearText Essay Article Poem
  • 16.
    Non-Linear:  Interpret datafrom graphs, tables and charts into words  Does not need to be read from beginning to end  Flowcharts, knowledge, maps  Multiple reading paths determined by the readers
  • 17.
    Non-Linear:  Summarize figures, showtrends, comparisons, relationships, clarity of difficult concepts  Allows the readers to find information more efficiently
  • 18.
    What is Non-LinearText? • opposite of linear text; non sequential • reader makes sense of the text in many different paths • includes texts with visuals or graphs • flowcharts, charts, and graphs, graphical organizers (knowledge maps and story maps) • any text that is read not from beginning to end • encyclopedia, telephone directory • follows skimming to obtain specific information
  • 19.
    Examples of Non-LinearText Telephone Directory Bar Graph Infographic
  • 20.
    Examples of Non-LinearText Flow Chart Histogram Pie Chart • • • • •
  • 21.
    vs Linear Text • refersto traditional text that needs to be read from beginning to end • there is only one reading path, which is decided by the author • typically includes printed texts • it may take time to find the information readers are searching for • novels, poems, letters, textbooks, newspaper articles Non-Linear Texts • refers to text that does not need to be read from beginning to end • there are multiple reading paths, they are determined by the reader • typically includes digital texts • allows readers to find information more efficiently • flowcharts, knowledge maps, and encyclopedias Definition Reading Path Examples Efficiency Content
  • 24.
  • 25.
    Enrichment Activity cellphones weresold on cellphones sold? 3. How many Wednesday? the minimum sales of 4. Which day had cellphones? 5. How many more cellphones were sold on Tuesday than on Monday? John works as a salesman in an authorized cellphone shop. He records the number of cellphone sold in five days (Monday-Friday) in line graph. 1. How many cellphones were sold in 5 days? 2. On which day were the maximum number of Monday Tuesday Wednesday Thursday Friday
  • 26.
    Enrichment Activity minimum salesof cellphones sold? 3.How many Wednesday? 4.Which day cellphones? Monday Tuesday Wednesday Thursday Friday John works as a salesman in an authorized cellphone shop. He records the number of cellphone sold in five days (Monday-Friday) in line graph. 1. How many cellphones were sold in 5 days? 2. On which2d +a 5y + 6 w+ e4 re + 9 th =e 26maximum number of cellphones werF e riday sold on had 6 the 5. How many moMreoncdeayllphones were sold on Tuesday than on Monday? 5 - 2 = 3
  • 27.
  • 28.
    Assessment 1 Answer thegiven questions 1. How many kids liked apples? _ 2.Which fruit did the most kids like? 3.Which fruit did the kids like the least? _ 4.How many kids liked bananas? 5.How many kids liked either pear or bananas? _ 6.How many kids liked either oranges or apples? _
  • 29.
    Assessment 1 Answer thegiven questions 1. How many kids liked apples? 2. Which fruit did the most kids like? _ 3.Which fruit did the kids like the least? 4.How many kids liked bananas? 4 Orange Banana 2 5.How many kids liked either pear or bananas? 6.How 5many kids liked either oranges or apples? _ 6 + 4 = 10
  • 30.
    Assessment 2 1. Whichitem sold the most in Store B? 2. Which store sold the least number of toasters? 3.The number of grills sold by store A is twice of store B. Is it correct? 4.What is the difference on sales of blenders between Store A and Store B? 5. How many total appliances were sold by Store A? Mr. Peters owns two kitchen appliance stores. He compares the sales of two stores and recorded the information in a bar graph. Use the graph to answer the questions.
  • 31.
    Assessment 2 Mr. Petersowns two kitchen appliance stores. He compares the sales of two stores and recorded the information in a bar graph. Use the graph to answer the questions. 1. Which item sold the most in Store B? Coffee Maker 2. Which store sold the least number of toasters? 3.The numbS eto rr oe fB grills sold by store A is twice of store B. Is it correct? 4.What is the difference on sales of blenYe ds ersbetween Store A and Store B? 5. How many total appliances were sold b 4 y 0 – St 3 o 0 r= e1 A 0 ? 20 + 15 + 30 + 30 + 45 = 140
  • 32.
    Assignment Use the linegraph to answer the following questions about the data. 1. How many cars were sold during May? 2. How many cars were sold in the first 3 months of the year? 3. How many more cars were sold in July than May? 4. Which month had 26 car sales? 5.Answer TRUE, FALSE, or CAN’T TELL to each of the statement below: Here is a graph showing the sales of used cars at the Salamander Autos.
  • 33.
    Assignment 3 months ofthe year? Here is a graph showing the sales of used cars at the Salamander Autos. Use the line graph to answer the following questions about the data. 1. How many cars were sold during May? 20 2. How many cars were sold in the first 59 3. How many more cars were sold in July than May? 6 _ 4. Which month had 26 car sales? 5.An6swer TRUE, FALSE, or CAN’T TELL to each of the statement below: Yes Yes Yes False False
  • 34.