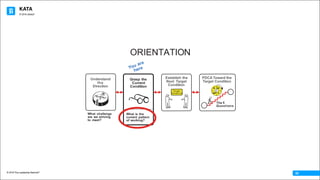
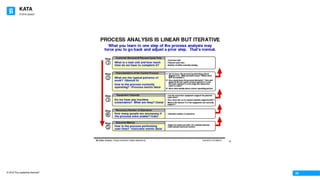
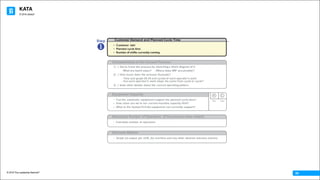
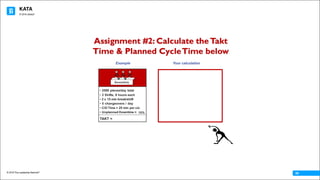
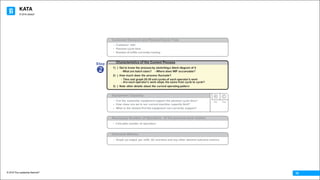
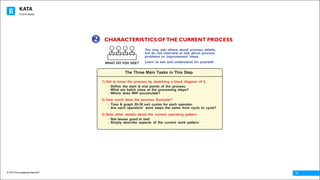
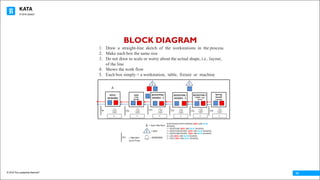
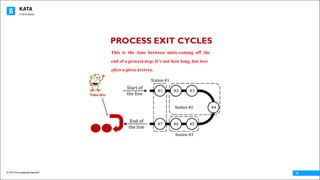
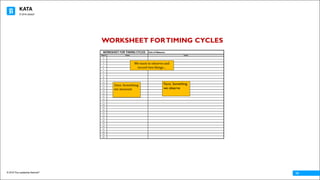
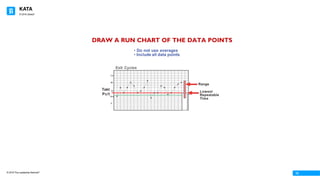
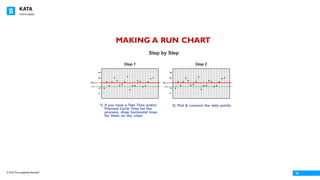
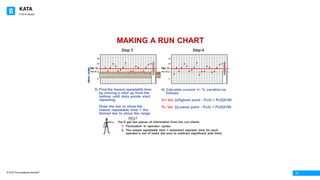
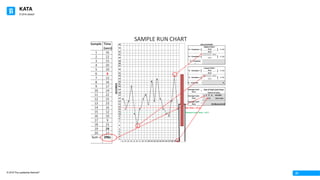
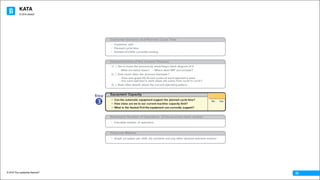
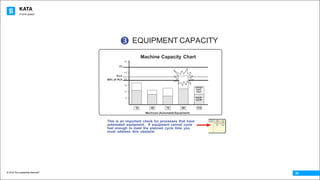
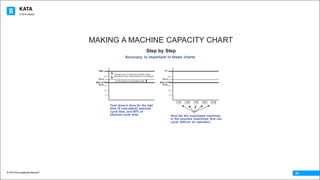
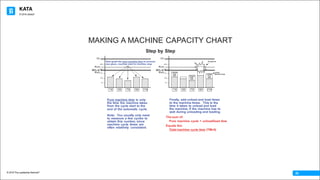
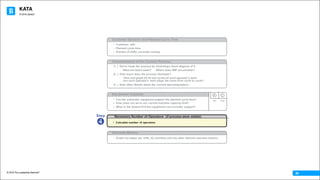
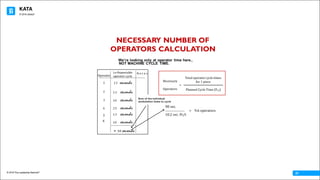
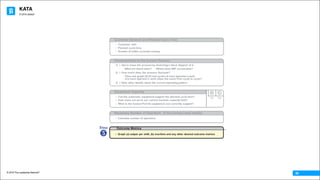
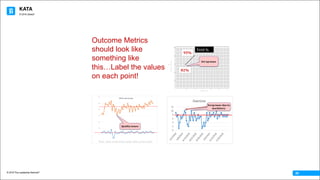
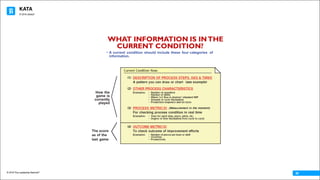
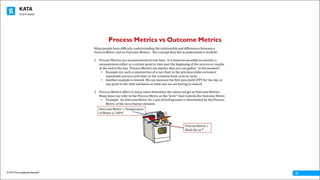
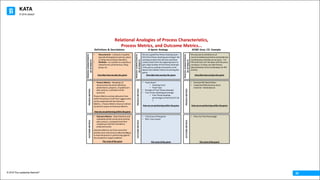
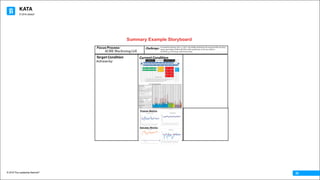
KATA
© 2016 The Leadership Network®
© 2016 Jidoka®
01
TOYOTA KATA
Grasping the
Current Condition
KATA
© 2016 The Leadership Network®
© 2016 Jidoka®
02
ORIENTATION
Go
and
See
ACT PLAN
CHECK DO
PDCA Toward the
Target Condition
The 5
Questions
What is the
current pattern
of working?
Establish the
Next Target
Condition
Tar get
Condi ti on
Grasp the
Current
Condition
Understand
the
Direction
What challenge
are we striving
to meet?
KATA
© 2016 The Leadership Network®
© 2016 Jidoka®
03
KATA
© 2016 The Leadership Network®
© 2016 Jidoka®
04
Necessary Number of Operators (if the process were stable)
• Calculate number of operators
Outcome Metrics
• Graph (a) output per shift, (b) overtime and any other desired outcome metrics
Equipment Capacity
• Can the automatic equipment support the planned cycle time?
•
•
How close are we to our current machine capacity limit?
What is the fastest Pc/t the equipment can currently support?
® ©
No Yes
Characteristics of the Current Process
1) ) Get to know the process by sketchinga block diagram of it
- What are batch sizes? - Where does WIP accumulate?
2) ) How much does the process fluctuate?
- Time and graph 20-30 exit cycles of each operator's work
- Are each operator's work steps the same from cycle to cycle?
3) ) Note other details about the current operating pattern
Step
u • Customer takt
• Planned cycle time
• Number of shifts currently running
Customer Demand and Planned Cycle Time
KATA
© 2016 The Leadership Network®
© 2016 Jidoka®
05
Customer	Takt
From	the	German	word	=	clock	time,	or	tempo
Takt	Time		=	effective	operating	time
Customer	demand
Example
Takt Time = 450 minutes x 60 sec = 27,000s / 2050 pieces
Takt Time = 12.0 sec
KATA
© 2016 The Leadership Network®
© 2016 Jidoka®
06
CUSTOMERTAKT AND
PLANNED CYCLE TIME
You	should	operate	your	production	to	plan	for	approximately	
15%	less	than	your	Customer	Takt	Time.
This	will:
1. Allow	for	any	unplanned	minor	or	major	stops	of	the	line.
2. Start-up	yield	loss	or	finishing	loss.
3. Unplanned	downtime	(if	this	is	unknown	or	not	tracked).
4. Quality	loss	such	as	scrap.
5. Untimed	or	unexpected	changeovers	or	schedule	changes.
6. Unplanned	breaks.
The	following	slides	show	the	comparison	between	Customer	
Takt	and	Planned	Cycle	time	(P	CT)
KATA
© 2016 The Leadership Network®
© 2016 Jidoka®
07
KATA
© 2016 The Leadership Network®
© 2016 Jidoka®
08
KATA
© 2016 The Leadership Network®
© 2016 Jidoka®
09
15%
Assembly
• 2500 pieces/day total
• 2 Shifts, 8 hours each
• 2 x 15 min break/shift
• 5 changeovers / day
• C/O Time = 25 min per c/o
• Unplanned Downtime =
TAKT =
Example Your calculation
Assignment #2: Calculate theTakt
Time & Planned CycleTime below
KATA
© 2016 The Leadership Network®
© 2016 Jidoka®
10
Necessary Number of Operators (if the process were stable)
• Calculate number of operators
Outcome Metrics
• Graph (a) output per shift, (b) overtime and any other desired outcome metrics
Equipment Capacity
• Can the automatic equipment support the planned cycle time?
•
•
How close are we to our current machine capacity limit?
What is the fastest Pc/t the equipment can currently support?
® ©
No Yes
Customer Demand and Planned Cycle Time
• Customer takt
• Planned cycle time
• Number of shifts currently running
Characteristics of the Current ProcessStep
v 1) ) Get to know the process by sketchinga block diagram of it
- What are batch sizes? - Where does WIP accumulate?
2) ) How much does the process fluctuate?
- Time and graph 20-30 exit cycles of each operator's work
- Are each operator's work steps the same from cycle to cycle?
3) ) Note other details about the current operating pattern
KATA
© 2016 The Leadership Network®
© 2016 Jidoka®
11
The Three Main Tasks in This Step
1) Get to know the process by sketching a block diagram of it.
- Define the start & end points of the process.
- What are batch sizes at the processing steps?
- Where does WIP accumulate?
2) How much does the process fluctuate?
- Time & graph 20-30 exit cycles for each operator.
- Are each operators' work steps the same from cycle to cycle?
3) Note other details about the current operating pattern.
- Not issues good or bad.
- Simply describe aspects of the current work pattern.
You may ask others about process details,
but do not interview or ask about process
problems or improvement ideas.
Learn to see and understand for yourself.WHAT DO YOU SEE?
v CHARACTERISTICSOFTHE CURRENT PROCESS
KATA
© 2016 The Leadership Network®
© 2016 Jidoka®
12
1. Draw a straight-line sketch of the workstations in the process.
2. Make each box the same size
3. Do not draw to scale or worry about the actual shape, i.e.. layout,
of the line
4. Shows the work flow
5. Each box simply = a workstation, table, fixture or machine
BLOCK DIAGRAM
Spring	
Install
5	springs
RESISTOR	1
2	REDS;	1	per	
board
RESISTOR/
DIODES	- 2
LED
1	PER	
BOARD
TEST/
REWORK
15 4 3 2
16 4 3 2
RESISTOR/
DIODES	- 3
=	WIP
RAW	BOARDS	WITH	SPRINGS	(RED AND	BLUE
BOARDS)
1	=	RESISTORS	(RED AND	BLUE BOARDS)
2	=	RESISTORS/DIODES	 (RED AND	BLUE BOARDS)
3	=	RESISTORS/DIODES	 (RED AND	BLUE BOARDS)
4	=	LED	(RED AND	BLUE BOARDS)
5	=	TEST	(RED AND	BLUE BOARDS)
5
5
I
=	WORKERS
I I
A
A =	Auto	Machine
10s15s12s25s 15s8s
25s =	Operator	
Cycle	Time
KATA
© 2016 The Leadership Network®
© 2016 Jidoka®
13
This is the time between units coming off the
end of a process step. It's not how long, but how
often a piece arrives.
PROCESS EXIT CYCLES
Time	this
KATA
© 2016 The Leadership Network®
© 2016 Jidoka®
14
Data:	Something	
we	measure
Facts: Something
we observe
We	want	to	observe	and	
record	two	things…
WORKSHEET FORTIMING CYCLES
KATA
© 2016 The Leadership Network®
© 2016 Jidoka®
15
KATA
© 2016 The Leadership Network®
© 2016 Jidoka®
16
KATA
© 2016 The Leadership Network®
© 2016 Jidoka®
17
KATA
© 2016 The Leadership Network®
© 2016 Jidoka®
18
KATA
© 2016 The Leadership Network®
© 2016 Jidoka®
19
WHY LOWEST REPEATABLETIMES
AND SHOULDN’TWE USEAVERAGES?
Many	people	have	difficulty	understanding	why	we	want	to	use	lowest	repeatable	times.		
The	concept	they	fail	to	understand	is	twofold:
1. Lowest	repeatable	is	just	a	starting	point	for	grasping	the	current	condition.		We	can	get	
more	detailed	workstation	times	later	if	necessary.
2. Lowest	repeatable	gives	you	an	indication	that	if	the	process	cycles	as	expected	(without	
major	cycle	stoppages),	then	that	time	is	a	time	the	operator	or	machine+operator	can
achieve,	although	PDCAs	and	experiments	will	be	needed	going	forward	to	sustain
3. As	we	continue	with	the	improvement	kata	process,	we	will	learn	more	about	the	
individual	workstations	and	times,	so	main	purpose	of	grasping	the	current	condition	is	
so	we	can	complete	the	3rd step	of	the	Improvement	Kata	which	is	Establishing	the	
Target	Condition.
4. Averages	are	good	for	long	data	sets	as	indicators	of	past	performance.		However,	it	is	
the	“spikes”	and	“troughs”	indicating	variability	that	get	hidden	with	averages.		One	
could	say	if	I	have	one	foot	in	a	bucket	of	ice	and	salt	water,	and	the	other	foot	in	a	
campfire,	then	on	average	I’m	feeling	ok.		However,	I	have	frostbite	and	3rd degree	
burns….not	ok!!!
We	want	to	
know	what	
happened	at	
these	points	on	
these	days?
KATA
© 2016 The Leadership Network®
© 2016 Jidoka®
20
Sample Time (seconds)
1 16
2 12
3 15
4 20
5 10
6 6
7 12
8 16
9 17
10 14
11 22
12 15
13 23
14 16
15 12
16 10
17 9
18 15
19 24
20 12
Sum	= 296
Takt = 12
Pc/t = 10.2
Assignment #3:Using theTaktTime & Planned Cycle Time below, make a run chart
with lowest repeatable bar and the variance range and hi/lo percentages
KATA
© 2016 The Leadership Network®
© 2016 Jidoka®
21
KATA
© 2016 The Leadership Network®
© 2016 Jidoka®
22
Necessary Number of Operators (if the process were stable)
• Calculate number of operators
Outcome Metrics
• Graph (a) output per shift, (b) overtime and any other desired outcome metrics
Customer Demand and Planned Cycle Time
• Customer takt
• Planned cycle time
• Number of shifts currently running
Characteristics of the Current Process
1) ) Get to know the process by sketchinga block diagram of it
- What are batch sizes? - Where does WIP accumulate?
2) ) How much does the process fluctuate?
- Time and graph 20-30 exit cycles of each operator's work
- Are each operator's work steps the same from cycle to cycle?
3) ) Note other details about the current operating pattern
Step
w
Equipment Capacity
• Can the automatic equipment support the planned cycle time?
• How close are we to our current machine capacity limit?
• What is the fastest Pc/t the equipment can currently support?
® ©
No Yes
KATA
© 2016 The Leadership Network®
© 2016 Jidoka®
23
EQUIPMENT CAPACITY
Machine Capacity Chart
35
TT
25
5
10
20
10 40 70 90 110
Pc/t
90% of Pc/t
unload
load
start
mach.
cycle
15
Machines (Automated Equipment)
w
This is an important check for processes that have
automated equipment. If equipment cannot cycle
fast enough to meet the planned cycle time you
must address this obstacle.
KATA
© 2016 The Leadership Network®
© 2016 Jidoka®
24
MAKING A MACHINE CAPACITY CHART
Step by Step
Accuracy is important in these charts
Changeovers (+ machine downtime,scrap,
rework and other losses if there is no shift gap)
5
10
90% of 20
25
Pc/t 15
For fluctuation in equipment cycle
Takt
Pc/t
First draw in lines for the takt
time (if calculated), planned
cycle time, and 90% of
planned cycle time.
1 0 4 0 7 0 9 0 1 1 0
5
10
90% of 20
25
Pc/t 15
TT
Pc/t
Next list the automated machines
in the process (machines that can
cycle without an operator).
KATA
© 2016 The Leadership Network®
© 2016 Jidoka®
25
Now graph the pure machine time to process
one piece, machine start to machine stop
1 0 4 0 7 0 9 0 1 1 0
5
10
90% of 20
25
Pc/t 15
TT
Pc/t
Pure machine time is only
the time the machine takes
from the cycle start to the
end of the automatic cycle.
Note: You usually only need
to measure a few cycles to
obtain this number, since
machine cycle times are
often relatively consistent.
4 0 7 0 9 0 1 1 0
90% of 20
Pc/t 15 TOTAL
Machine Cycle
1 0
5
10
25
TT
Pc/t
unload
load
start unload
load
start
unload
load
start
Pr obl em
Finally, add unload and load times
to the machine times. This is the
time it takes to unload and load
the machine, if the machine has to
wait during unloading and loading.
The sum of:
Pure machine cycle + unload/load time
Equals the:
Total machine cycle time (TMc/t)
MAKING A MACHINE CAPACITY CHART
Step by Step
KATA
© 2016 The Leadership Network®
© 2016 Jidoka®
26
Equipment Capacity
• Can the automatic equipment support the planned cycle time?
•
•
How close are we to our current machine capacity limit?
What is the fastest Pc/t the equipment can currently support?
® ©
No Yes
Customer Demand and Planned Cycle Time
• Customer takt
• Planned cycle time
• Number of shifts currently running
Characteristics of the Current Process
1) ) Get to know the process by sketchinga block diagram of it
- What are batch sizes? - Where does WIP accumulate?
2) ) How much does the process fluctuate?
- Time and graph 20-30 exit cycles of each operator's work
- Are each operator's work steps the same from cycle to cycle?
3) ) Note other details about the current operating pattern
Step
x
Necessary Number of Operators (if process were stable)
• Calculate number of operators
Outcome Metrics
• Graph (a) output per shift, (b) overtime and any other desired outcome metrics
KATA
© 2016 The Leadership Network®
© 2016 Jidoka®
27
= 98 seconds
1
2
3
4
Lo-Repeatable
operator	cycle
15 seconds
13 seconds
16 seconds
25 seconds
13 seconds
16 seconds
N	o	t	e	s
10.2	sec.	Pc/t
= 9.6 operators
Sum of the individual
workstation times to cycle
NECESSARY NUMBER OF
OPERATORS CALCULATION
We're looking only at operator time here.,
NOT MACHINE CYCLE TIME.
98 sec.	
5
6
Operator
Necessary
=
Operators	
Total	operator	cycle	times	
for	1	piece
Planned	Cycle	Time	(PCT)
KATA
© 2016 The Leadership Network®
© 2016 Jidoka®
28
Necessary Number of Operators (if the process were stable)
• Calculate number of operators
Equipment Capacity
• Can the automatic equipment support the planned cycle time?
•
•
How close are we to our current machine capacity limit?
What is the fastest Pc/t the equipment can currently support?
® ©
No Yes
Customer Demand and Planned Cycle Time
• Customer takt
• Planned cycle time
• Number of shifts currently running
Characteristics of the Current Process
1) ) Get to know the process by sketchinga block diagram of it
- What are batch sizes? - Where does WIP accumulate?
2) ) How much does the process fluctuate?
- Time and graph 20-30 exit cycles of each operator's work
- Are each operator's work steps the same from cycle to cycle?
3) ) Note other details about the current operating pattern
Step
y
Outcome Metrics
• Graph (a) output per shift, (b) overtime and any other desired outcome metrics
KATA
© 2016 The Leadership Network®
© 2016 Jidoka®
29
Outcome Metrics
should look like
something like
this…Label the values
on each point!
Yield	%
Set-up	issue
82%
95%
Scrap	issue	due	to	
machinery
Quality	issues
KATA
© 2016 The Leadership Network®
© 2016 Jidoka®
30
How the
game is
currently
played
The score
as of the
last game
• A current condition should include these four categories of
information.
Current	Condition	Now:
WHAT INFORMATION IS INTHE
CURRENT CONDITION?
KATA
© 2016 The Leadership Network®
© 2016 Jidoka®
31
Process Metrics vs Outcome Metrics
Many	people	have	difficulty	understanding	the	relationship	and	differences	between	a	
Process	Metric	and	an	Outcome	Metrics.		The	concept	they	fail	to	understand	is	twofold:
1. Process	Metrics	are	measurements	in	real	time.		It	is	however	possible	to	consider	a	
measurement	either	at	a	certain	point	in	time	past	the	beginning	of	the	process	or	maybe	
at	the	end	of	the	day.		Process	Metrics	are	metrics	that	you	can	gather	“in	the	moment”	
• Example	are	such	a	construction	of	a	run	chart	in	the	previous	slides	on	lowest	
repeatable	process	cycle	time	or	the	variation	from	cycle	to	cycle.
• Another	example	is	rework.	We	can	measure	the	first	pass	yield	(FPY	for	the	day	at	
any	point	in	the	shift	and	know	at	what	rate	we	are	having	to	rework
2. Process	Metrics	affect	or	many	times	determine	the	values	we	get	as	Outcome	Metrics.		
Many	times	we	refer	to	the	Process	Metric	as	the	“lever”	that	controls	the	Outcome	Metric.
• Example:		An	Outcome	Metric	for	a	pot	of	boiling	water	is	determined	by	the	Process	
Metric	of	the	stove	burner	element.
Process	Metric	=	
Knob	Set	at	7
Outcome	Metric	=	Temperature	
of	Water	is	100oC
KATA
© 2016 The Leadership Network®
© 2016 Jidoka®
32
Relational	Analogies	of	Process	Characteristics,	
Process	Metrics,	and	Outcome	Metrics...		
• Characteristic – a	feature	or	quality	
typically	belonging	to	a	person,	place,	
or	thing	and	serving	to	identify	it	
• Attribute	– to	consider	as	a	quality	or	
characteristic	of	the	person,	thing,	
group,	etc.			
Describes	how	we	play	the	game	
PROCESS	CHARACTERISTIC											
OR	ATTRIBUTE
• Process	Metrics	- Standards	of	
measurement	by	which	efficiency,	
performance,	progress,	or	quality	of	a	
plan,	process,	or	product	can	be	
assessed
Process	Metrics	are	key	indicators	from	
within	the	process	itself	that	suggest	what	
can	be	expected	with	the	Outcome	
Metrics…	Process	Metrics	have	an	indirect	
(or	direct)	impact	on	Outcome	Metrics.	
How	we	are	performing	within	the	game	
PROCESS	METRICS
• Outcome	Metrics	- Determination	and	
evaluation	of	the	results	of	an	activity,	
plan,	process,	or	program	and	their	
comparison	with	the	intended	or	
projected	results
Outcome	Metrics	are	final	scores	that	
provide	clear	and	concise	understanding	as	
to	how	the	process	is	performing	against	
the	standard	or	target	condition.	
The	score	of	the	game	
OUTCOME	METRICS
Definitions	&	Descriptions			
We	are	a	good	free	throw	shooting	team	–
91%	(free	throw	shooting	percentage).	We	
set	plays	to	drive	into	the	lane	and	draw	
contact	(foul)	from	the	opposing	team	to	
get	a	high	number	of	free	throw	attempts	
in	the	game,	putting	more	points	on	he	
board,	and	a	better	chance	at	winning	the	
game.	
Describes	how	we	play	the	game	
PROCESS	CHARACTERISTIC											
OR	ATTRIBUTE
• Fouls	drawn	
• Shooting	Fouls	
• Floor	Fouls
• Number	of	Free	Throw	attempts	
• Free	Throw	shooting	percentage	
• Free	Throw	shooting	
percentage	on	front	end	of	1	&	
1	
How	we	are	performing	within	the	game	
PROCESS	METRICS
• Final	Score	of	the	game
• Win	/	Loss	record	
The	score	of	the	game	
OUTCOME	METRICS
A	Sports	Analogy		
We	execute	to	schedule	on	all	
recommended	preventative	and	predictive	
maintenance	activities	on	our	press.		For	
PM	work	that	can’t	be	done	with	the	press	
running	or	in	setup,	we	allot	4	hours	
(planned	down	time)	on	Mondays	for	PM	
activity.		
Describes	how	we	play	the	game	
PROCESS	CHARACTERISTIC											
OR	ATTRIBUTE
• Overdue	PM	Work	Orders
• Unplanned	Maintenance	hours	
(reactive	– break	downs)
How	we	are	performing	within	the	game	
PROCESS	METRICS
• Press	Up	Time	Percentage	
The	score	of	the	game	
OUTCOME	METRICS
ACME	Gear,	CO.	Example
KATA
© 2016 The Leadership Network®
© 2016 Jidoka®
33
Target	Condition
Achieve	by:	
Current	Condition
Process	Metrics
Outcome	Metrics
F/A	-	Pack
Mill	8
Mill	7
Mill	6
Mill	5
Mill	4
Mill	3
Mill	2
Mill	1
CNC	2
CNC	1
Shaper	6
Shaper	5
Shaper	4
Shaper	3
Shaper	2
Shaper	1
Hob	18
Hob	17
Hob	16
Hob	15
Hob	14
Hob	13
Hob	12
Hob	11
Hob	10
Hob	9
Hob	8
Hob	7
Hob	6
Hob	5
Hob	4
Hob	3
Hob	2
Hob	1
Hob	0
Hob	1
50
48
46
44
42
40
38
36
34
32
30
28
26
24
22
20
18
16
14
12
10
8
6
4
2
0
OTHER	PROCESS	METRICS:
Mill	Reliability	is	80%
Overtime	is	due	to	machine	reliability	at	Turning	Mills	1,7,	&	8	
NOTES	AND	OBSERVATIONS
PROCESS	CHARACTERISTICS:
We	have	excess	capacity	and	high	variation	in	machine	cycle
with	our	Hob	Machines.		Hob	18	cycle	time	exceeds	Takt	Time
We	have	excess	capacity	and	high	variation	in	machine	cycle
with	our	Turning	Mill	Machines.
PPLH	=	27.5
Scrap	=	6.7%
OverTime	=	8%
First	Pass	Yield	=	93%
Exit	Cycle	Var(Pack)	=	10	s	+/-	12%
Hob	18	Lowest	Repeatable Hi	Var	=	+195%
Lo	Var	=	-	24%=	14	seconds
Takt	Time	=		12.3	seconds
Planned	Cycle	Time=		10.5	Seconds
Number	of	Shifts	=	3
Number	of	Operators	=	10
CURRENT	CONDITION	SUMMARY	SHEET	
Outcome	Metrics	(See	Charts)
Process	Stability:
Focus Process: Challenge: It	would	be	Colossal,	if	by	1.1.2017,	the	ACME	machining	cell	occupied	50%	less	floor	
space,	operating	2	shifts	with	50%	of	the	machinery,	so	we	can	achieve:
50	PPLH,	< 3.5%	Scrap,	with	No	OvertimeACME	Machining	Cell
Summary Example Storyboard

Lecture 2a

  • 1.
    KATA © 2016 TheLeadership Network® © 2016 Jidoka® 01 TOYOTA KATA Grasping the Current Condition
  • 2.
    KATA © 2016 TheLeadership Network® © 2016 Jidoka® 02 ORIENTATION Go and See ACT PLAN CHECK DO PDCA Toward the Target Condition The 5 Questions What is the current pattern of working? Establish the Next Target Condition Tar get Condi ti on Grasp the Current Condition Understand the Direction What challenge are we striving to meet?
  • 3.
    KATA © 2016 TheLeadership Network® © 2016 Jidoka® 03
  • 4.
    KATA © 2016 TheLeadership Network® © 2016 Jidoka® 04 Necessary Number of Operators (if the process were stable) • Calculate number of operators Outcome Metrics • Graph (a) output per shift, (b) overtime and any other desired outcome metrics Equipment Capacity • Can the automatic equipment support the planned cycle time? • • How close are we to our current machine capacity limit? What is the fastest Pc/t the equipment can currently support? ® © No Yes Characteristics of the Current Process 1) ) Get to know the process by sketchinga block diagram of it - What are batch sizes? - Where does WIP accumulate? 2) ) How much does the process fluctuate? - Time and graph 20-30 exit cycles of each operator's work - Are each operator's work steps the same from cycle to cycle? 3) ) Note other details about the current operating pattern Step u • Customer takt • Planned cycle time • Number of shifts currently running Customer Demand and Planned Cycle Time
  • 5.
    KATA © 2016 TheLeadership Network® © 2016 Jidoka® 05 Customer Takt From the German word = clock time, or tempo Takt Time = effective operating time Customer demand Example Takt Time = 450 minutes x 60 sec = 27,000s / 2050 pieces Takt Time = 12.0 sec
  • 6.
    KATA © 2016 TheLeadership Network® © 2016 Jidoka® 06 CUSTOMERTAKT AND PLANNED CYCLE TIME You should operate your production to plan for approximately 15% less than your Customer Takt Time. This will: 1. Allow for any unplanned minor or major stops of the line. 2. Start-up yield loss or finishing loss. 3. Unplanned downtime (if this is unknown or not tracked). 4. Quality loss such as scrap. 5. Untimed or unexpected changeovers or schedule changes. 6. Unplanned breaks. The following slides show the comparison between Customer Takt and Planned Cycle time (P CT)
  • 7.
    KATA © 2016 TheLeadership Network® © 2016 Jidoka® 07
  • 8.
    KATA © 2016 TheLeadership Network® © 2016 Jidoka® 08
  • 9.
    KATA © 2016 TheLeadership Network® © 2016 Jidoka® 09 15% Assembly • 2500 pieces/day total • 2 Shifts, 8 hours each • 2 x 15 min break/shift • 5 changeovers / day • C/O Time = 25 min per c/o • Unplanned Downtime = TAKT = Example Your calculation Assignment #2: Calculate theTakt Time & Planned CycleTime below
  • 10.
    KATA © 2016 TheLeadership Network® © 2016 Jidoka® 10 Necessary Number of Operators (if the process were stable) • Calculate number of operators Outcome Metrics • Graph (a) output per shift, (b) overtime and any other desired outcome metrics Equipment Capacity • Can the automatic equipment support the planned cycle time? • • How close are we to our current machine capacity limit? What is the fastest Pc/t the equipment can currently support? ® © No Yes Customer Demand and Planned Cycle Time • Customer takt • Planned cycle time • Number of shifts currently running Characteristics of the Current ProcessStep v 1) ) Get to know the process by sketchinga block diagram of it - What are batch sizes? - Where does WIP accumulate? 2) ) How much does the process fluctuate? - Time and graph 20-30 exit cycles of each operator's work - Are each operator's work steps the same from cycle to cycle? 3) ) Note other details about the current operating pattern
  • 11.
    KATA © 2016 TheLeadership Network® © 2016 Jidoka® 11 The Three Main Tasks in This Step 1) Get to know the process by sketching a block diagram of it. - Define the start & end points of the process. - What are batch sizes at the processing steps? - Where does WIP accumulate? 2) How much does the process fluctuate? - Time & graph 20-30 exit cycles for each operator. - Are each operators' work steps the same from cycle to cycle? 3) Note other details about the current operating pattern. - Not issues good or bad. - Simply describe aspects of the current work pattern. You may ask others about process details, but do not interview or ask about process problems or improvement ideas. Learn to see and understand for yourself.WHAT DO YOU SEE? v CHARACTERISTICSOFTHE CURRENT PROCESS
  • 12.
    KATA © 2016 TheLeadership Network® © 2016 Jidoka® 12 1. Draw a straight-line sketch of the workstations in the process. 2. Make each box the same size 3. Do not draw to scale or worry about the actual shape, i.e.. layout, of the line 4. Shows the work flow 5. Each box simply = a workstation, table, fixture or machine BLOCK DIAGRAM Spring Install 5 springs RESISTOR 1 2 REDS; 1 per board RESISTOR/ DIODES - 2 LED 1 PER BOARD TEST/ REWORK 15 4 3 2 16 4 3 2 RESISTOR/ DIODES - 3 = WIP RAW BOARDS WITH SPRINGS (RED AND BLUE BOARDS) 1 = RESISTORS (RED AND BLUE BOARDS) 2 = RESISTORS/DIODES (RED AND BLUE BOARDS) 3 = RESISTORS/DIODES (RED AND BLUE BOARDS) 4 = LED (RED AND BLUE BOARDS) 5 = TEST (RED AND BLUE BOARDS) 5 5 I = WORKERS I I A A = Auto Machine 10s15s12s25s 15s8s 25s = Operator Cycle Time
  • 13.
    KATA © 2016 TheLeadership Network® © 2016 Jidoka® 13 This is the time between units coming off the end of a process step. It's not how long, but how often a piece arrives. PROCESS EXIT CYCLES Time this
  • 14.
    KATA © 2016 TheLeadership Network® © 2016 Jidoka® 14 Data: Something we measure Facts: Something we observe We want to observe and record two things… WORKSHEET FORTIMING CYCLES
  • 15.
    KATA © 2016 TheLeadership Network® © 2016 Jidoka® 15
  • 16.
    KATA © 2016 TheLeadership Network® © 2016 Jidoka® 16
  • 17.
    KATA © 2016 TheLeadership Network® © 2016 Jidoka® 17
  • 18.
    KATA © 2016 TheLeadership Network® © 2016 Jidoka® 18
  • 19.
    KATA © 2016 TheLeadership Network® © 2016 Jidoka® 19 WHY LOWEST REPEATABLETIMES AND SHOULDN’TWE USEAVERAGES? Many people have difficulty understanding why we want to use lowest repeatable times. The concept they fail to understand is twofold: 1. Lowest repeatable is just a starting point for grasping the current condition. We can get more detailed workstation times later if necessary. 2. Lowest repeatable gives you an indication that if the process cycles as expected (without major cycle stoppages), then that time is a time the operator or machine+operator can achieve, although PDCAs and experiments will be needed going forward to sustain 3. As we continue with the improvement kata process, we will learn more about the individual workstations and times, so main purpose of grasping the current condition is so we can complete the 3rd step of the Improvement Kata which is Establishing the Target Condition. 4. Averages are good for long data sets as indicators of past performance. However, it is the “spikes” and “troughs” indicating variability that get hidden with averages. One could say if I have one foot in a bucket of ice and salt water, and the other foot in a campfire, then on average I’m feeling ok. However, I have frostbite and 3rd degree burns….not ok!!! We want to know what happened at these points on these days?
  • 20.
    KATA © 2016 TheLeadership Network® © 2016 Jidoka® 20 Sample Time (seconds) 1 16 2 12 3 15 4 20 5 10 6 6 7 12 8 16 9 17 10 14 11 22 12 15 13 23 14 16 15 12 16 10 17 9 18 15 19 24 20 12 Sum = 296 Takt = 12 Pc/t = 10.2 Assignment #3:Using theTaktTime & Planned Cycle Time below, make a run chart with lowest repeatable bar and the variance range and hi/lo percentages
  • 21.
    KATA © 2016 TheLeadership Network® © 2016 Jidoka® 21
  • 22.
    KATA © 2016 TheLeadership Network® © 2016 Jidoka® 22 Necessary Number of Operators (if the process were stable) • Calculate number of operators Outcome Metrics • Graph (a) output per shift, (b) overtime and any other desired outcome metrics Customer Demand and Planned Cycle Time • Customer takt • Planned cycle time • Number of shifts currently running Characteristics of the Current Process 1) ) Get to know the process by sketchinga block diagram of it - What are batch sizes? - Where does WIP accumulate? 2) ) How much does the process fluctuate? - Time and graph 20-30 exit cycles of each operator's work - Are each operator's work steps the same from cycle to cycle? 3) ) Note other details about the current operating pattern Step w Equipment Capacity • Can the automatic equipment support the planned cycle time? • How close are we to our current machine capacity limit? • What is the fastest Pc/t the equipment can currently support? ® © No Yes
  • 23.
    KATA © 2016 TheLeadership Network® © 2016 Jidoka® 23 EQUIPMENT CAPACITY Machine Capacity Chart 35 TT 25 5 10 20 10 40 70 90 110 Pc/t 90% of Pc/t unload load start mach. cycle 15 Machines (Automated Equipment) w This is an important check for processes that have automated equipment. If equipment cannot cycle fast enough to meet the planned cycle time you must address this obstacle.
  • 24.
    KATA © 2016 TheLeadership Network® © 2016 Jidoka® 24 MAKING A MACHINE CAPACITY CHART Step by Step Accuracy is important in these charts Changeovers (+ machine downtime,scrap, rework and other losses if there is no shift gap) 5 10 90% of 20 25 Pc/t 15 For fluctuation in equipment cycle Takt Pc/t First draw in lines for the takt time (if calculated), planned cycle time, and 90% of planned cycle time. 1 0 4 0 7 0 9 0 1 1 0 5 10 90% of 20 25 Pc/t 15 TT Pc/t Next list the automated machines in the process (machines that can cycle without an operator).
  • 25.
    KATA © 2016 TheLeadership Network® © 2016 Jidoka® 25 Now graph the pure machine time to process one piece, machine start to machine stop 1 0 4 0 7 0 9 0 1 1 0 5 10 90% of 20 25 Pc/t 15 TT Pc/t Pure machine time is only the time the machine takes from the cycle start to the end of the automatic cycle. Note: You usually only need to measure a few cycles to obtain this number, since machine cycle times are often relatively consistent. 4 0 7 0 9 0 1 1 0 90% of 20 Pc/t 15 TOTAL Machine Cycle 1 0 5 10 25 TT Pc/t unload load start unload load start unload load start Pr obl em Finally, add unload and load times to the machine times. This is the time it takes to unload and load the machine, if the machine has to wait during unloading and loading. The sum of: Pure machine cycle + unload/load time Equals the: Total machine cycle time (TMc/t) MAKING A MACHINE CAPACITY CHART Step by Step
  • 26.
    KATA © 2016 TheLeadership Network® © 2016 Jidoka® 26 Equipment Capacity • Can the automatic equipment support the planned cycle time? • • How close are we to our current machine capacity limit? What is the fastest Pc/t the equipment can currently support? ® © No Yes Customer Demand and Planned Cycle Time • Customer takt • Planned cycle time • Number of shifts currently running Characteristics of the Current Process 1) ) Get to know the process by sketchinga block diagram of it - What are batch sizes? - Where does WIP accumulate? 2) ) How much does the process fluctuate? - Time and graph 20-30 exit cycles of each operator's work - Are each operator's work steps the same from cycle to cycle? 3) ) Note other details about the current operating pattern Step x Necessary Number of Operators (if process were stable) • Calculate number of operators Outcome Metrics • Graph (a) output per shift, (b) overtime and any other desired outcome metrics
  • 27.
    KATA © 2016 TheLeadership Network® © 2016 Jidoka® 27 = 98 seconds 1 2 3 4 Lo-Repeatable operator cycle 15 seconds 13 seconds 16 seconds 25 seconds 13 seconds 16 seconds N o t e s 10.2 sec. Pc/t = 9.6 operators Sum of the individual workstation times to cycle NECESSARY NUMBER OF OPERATORS CALCULATION We're looking only at operator time here., NOT MACHINE CYCLE TIME. 98 sec. 5 6 Operator Necessary = Operators Total operator cycle times for 1 piece Planned Cycle Time (PCT)
  • 28.
    KATA © 2016 TheLeadership Network® © 2016 Jidoka® 28 Necessary Number of Operators (if the process were stable) • Calculate number of operators Equipment Capacity • Can the automatic equipment support the planned cycle time? • • How close are we to our current machine capacity limit? What is the fastest Pc/t the equipment can currently support? ® © No Yes Customer Demand and Planned Cycle Time • Customer takt • Planned cycle time • Number of shifts currently running Characteristics of the Current Process 1) ) Get to know the process by sketchinga block diagram of it - What are batch sizes? - Where does WIP accumulate? 2) ) How much does the process fluctuate? - Time and graph 20-30 exit cycles of each operator's work - Are each operator's work steps the same from cycle to cycle? 3) ) Note other details about the current operating pattern Step y Outcome Metrics • Graph (a) output per shift, (b) overtime and any other desired outcome metrics
  • 29.
    KATA © 2016 TheLeadership Network® © 2016 Jidoka® 29 Outcome Metrics should look like something like this…Label the values on each point! Yield % Set-up issue 82% 95% Scrap issue due to machinery Quality issues
  • 30.
    KATA © 2016 TheLeadership Network® © 2016 Jidoka® 30 How the game is currently played The score as of the last game • A current condition should include these four categories of information. Current Condition Now: WHAT INFORMATION IS INTHE CURRENT CONDITION?
  • 31.
    KATA © 2016 TheLeadership Network® © 2016 Jidoka® 31 Process Metrics vs Outcome Metrics Many people have difficulty understanding the relationship and differences between a Process Metric and an Outcome Metrics. The concept they fail to understand is twofold: 1. Process Metrics are measurements in real time. It is however possible to consider a measurement either at a certain point in time past the beginning of the process or maybe at the end of the day. Process Metrics are metrics that you can gather “in the moment” • Example are such a construction of a run chart in the previous slides on lowest repeatable process cycle time or the variation from cycle to cycle. • Another example is rework. We can measure the first pass yield (FPY for the day at any point in the shift and know at what rate we are having to rework 2. Process Metrics affect or many times determine the values we get as Outcome Metrics. Many times we refer to the Process Metric as the “lever” that controls the Outcome Metric. • Example: An Outcome Metric for a pot of boiling water is determined by the Process Metric of the stove burner element. Process Metric = Knob Set at 7 Outcome Metric = Temperature of Water is 100oC
  • 32.
    KATA © 2016 TheLeadership Network® © 2016 Jidoka® 32 Relational Analogies of Process Characteristics, Process Metrics, and Outcome Metrics... • Characteristic – a feature or quality typically belonging to a person, place, or thing and serving to identify it • Attribute – to consider as a quality or characteristic of the person, thing, group, etc. Describes how we play the game PROCESS CHARACTERISTIC OR ATTRIBUTE • Process Metrics - Standards of measurement by which efficiency, performance, progress, or quality of a plan, process, or product can be assessed Process Metrics are key indicators from within the process itself that suggest what can be expected with the Outcome Metrics… Process Metrics have an indirect (or direct) impact on Outcome Metrics. How we are performing within the game PROCESS METRICS • Outcome Metrics - Determination and evaluation of the results of an activity, plan, process, or program and their comparison with the intended or projected results Outcome Metrics are final scores that provide clear and concise understanding as to how the process is performing against the standard or target condition. The score of the game OUTCOME METRICS Definitions & Descriptions We are a good free throw shooting team – 91% (free throw shooting percentage). We set plays to drive into the lane and draw contact (foul) from the opposing team to get a high number of free throw attempts in the game, putting more points on he board, and a better chance at winning the game. Describes how we play the game PROCESS CHARACTERISTIC OR ATTRIBUTE • Fouls drawn • Shooting Fouls • Floor Fouls • Number of Free Throw attempts • Free Throw shooting percentage • Free Throw shooting percentage on front end of 1 & 1 How we are performing within the game PROCESS METRICS • Final Score of the game • Win / Loss record The score of the game OUTCOME METRICS A Sports Analogy We execute to schedule on all recommended preventative and predictive maintenance activities on our press. For PM work that can’t be done with the press running or in setup, we allot 4 hours (planned down time) on Mondays for PM activity. Describes how we play the game PROCESS CHARACTERISTIC OR ATTRIBUTE • Overdue PM Work Orders • Unplanned Maintenance hours (reactive – break downs) How we are performing within the game PROCESS METRICS • Press Up Time Percentage The score of the game OUTCOME METRICS ACME Gear, CO. Example
  • 33.
    KATA © 2016 TheLeadership Network® © 2016 Jidoka® 33 Target Condition Achieve by: Current Condition Process Metrics Outcome Metrics F/A - Pack Mill 8 Mill 7 Mill 6 Mill 5 Mill 4 Mill 3 Mill 2 Mill 1 CNC 2 CNC 1 Shaper 6 Shaper 5 Shaper 4 Shaper 3 Shaper 2 Shaper 1 Hob 18 Hob 17 Hob 16 Hob 15 Hob 14 Hob 13 Hob 12 Hob 11 Hob 10 Hob 9 Hob 8 Hob 7 Hob 6 Hob 5 Hob 4 Hob 3 Hob 2 Hob 1 Hob 0 Hob 1 50 48 46 44 42 40 38 36 34 32 30 28 26 24 22 20 18 16 14 12 10 8 6 4 2 0 OTHER PROCESS METRICS: Mill Reliability is 80% Overtime is due to machine reliability at Turning Mills 1,7, & 8 NOTES AND OBSERVATIONS PROCESS CHARACTERISTICS: We have excess capacity and high variation in machine cycle with our Hob Machines. Hob 18 cycle time exceeds Takt Time We have excess capacity and high variation in machine cycle with our Turning Mill Machines. PPLH = 27.5 Scrap = 6.7% OverTime = 8% First Pass Yield = 93% Exit Cycle Var(Pack) = 10 s +/- 12% Hob 18 Lowest Repeatable Hi Var = +195% Lo Var = - 24%= 14 seconds Takt Time = 12.3 seconds Planned Cycle Time= 10.5 Seconds Number of Shifts = 3 Number of Operators = 10 CURRENT CONDITION SUMMARY SHEET Outcome Metrics (See Charts) Process Stability: Focus Process: Challenge: It would be Colossal, if by 1.1.2017, the ACME machining cell occupied 50% less floor space, operating 2 shifts with 50% of the machinery, so we can achieve: 50 PPLH, < 3.5% Scrap, with No OvertimeACME Machining Cell Summary Example Storyboard