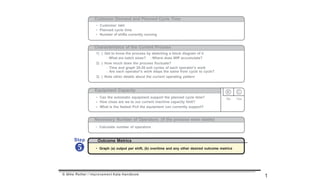
Necessary Number of Operators (if the process were stable)
• Calculate number of operators
Equipment Capacity
• Can the automatic equipment support the planned cycle time?
•
•
How close are we to our current machine capacity limit?
What is the fastest Pc/t the equipment can currently support?
® ©
No Yes
Customer Demand and Planned Cycle Time
• Customer takt
• Planned cycle time
• Number of shifts currently running
Characteristics of the Current Process
1) ) Get to know the process by sketching a block diagram of it
- What are batch sizes? - Where does WIP accumulate?
2) ) How much does the process fluctuate?
- Time and graph 20-30 exit cycles of each operator's work
- Are each operator's work steps the same from cycle to cycle?
3) ) Note other details about the current operating pattern
Step

Outcome Metrics
• Graph (a) output per shift, (b) overtime and any other desired outcome metrics
© Mike Rother / Improvement Kata Handbook
1
GRAPH OUTCOME METRICS
This addresses the question of how well the process
is delivering and performing over time

(1) Output per Shift (2) Overtime
Additional outcome metrics include
productivity, quality, labor cost, etc.
© Mike Rother / Improvement Kata Handbook
2
WHAT INFORMATION IS IN A CURRENT CONDITION?
How the
game is
currently
played
The score
as of the
last game
Target Condition
• A current condition should include these four categories of
information.
3
Current Condition Now:
Customer Demand / Line Pace
• Takt Time = 30 seconds
• PC/T = 22 seconds
• Gap = 27%
• Running 2 Shifts + overtime
• 10 changeovers per day
Process Characteristics
• Output cycles vary +91%/-18%
• Operator work steps vary
• 4 operators
• Operator 4 cannot consistently
meet Pc/t
• Line does not meet Pc/t
• WIP (as shown)
Equipment Capacity
• Op 90 cannot meet Pc/t
(see chart)
Necessary Number of Operators
• 3.2 operators / 4 actual
• Operators 1, 2 & 3
are underutilized (see chart)
Outcome Metrics
• See graphs
• Line must run overtime
TT
5
10
90%20
25
35
10
Pc/t
of Pc/t
15
Machines
40 70 90 110
Operators
40
I
5
pcs
I
2
pcs
I
12
pcs
I
22
pcs
Range of observed cycle times
Lowest repeatable
observed cycle time
Summary Example
4
Current Condition
INITIAL CURRENT CONDITION
Process
Date
5

Information in a Current Condition

  • 1.
    Necessary Number ofOperators (if the process were stable) • Calculate number of operators Equipment Capacity • Can the automatic equipment support the planned cycle time? • • How close are we to our current machine capacity limit? What is the fastest Pc/t the equipment can currently support? ® © No Yes Customer Demand and Planned Cycle Time • Customer takt • Planned cycle time • Number of shifts currently running Characteristics of the Current Process 1) ) Get to know the process by sketching a block diagram of it - What are batch sizes? - Where does WIP accumulate? 2) ) How much does the process fluctuate? - Time and graph 20-30 exit cycles of each operator's work - Are each operator's work steps the same from cycle to cycle? 3) ) Note other details about the current operating pattern Step  Outcome Metrics • Graph (a) output per shift, (b) overtime and any other desired outcome metrics © Mike Rother / Improvement Kata Handbook 1
  • 2.
    GRAPH OUTCOME METRICS Thisaddresses the question of how well the process is delivering and performing over time  (1) Output per Shift (2) Overtime Additional outcome metrics include productivity, quality, labor cost, etc. © Mike Rother / Improvement Kata Handbook 2
  • 3.
    WHAT INFORMATION ISIN A CURRENT CONDITION? How the game is currently played The score as of the last game Target Condition • A current condition should include these four categories of information. 3 Current Condition Now:
  • 4.
    Customer Demand /Line Pace • Takt Time = 30 seconds • PC/T = 22 seconds • Gap = 27% • Running 2 Shifts + overtime • 10 changeovers per day Process Characteristics • Output cycles vary +91%/-18% • Operator work steps vary • 4 operators • Operator 4 cannot consistently meet Pc/t • Line does not meet Pc/t • WIP (as shown) Equipment Capacity • Op 90 cannot meet Pc/t (see chart) Necessary Number of Operators • 3.2 operators / 4 actual • Operators 1, 2 & 3 are underutilized (see chart) Outcome Metrics • See graphs • Line must run overtime TT 5 10 90%20 25 35 10 Pc/t of Pc/t 15 Machines 40 70 90 110 Operators 40 I 5 pcs I 2 pcs I 12 pcs I 22 pcs Range of observed cycle times Lowest repeatable observed cycle time Summary Example 4 Current Condition INITIAL CURRENT CONDITION Process Date
  • 5.

Editor's Notes

  • #2 True North Metrics: Based on your challenge, where do you sit today? What’s your current numbers?
  • #3 Explain that in their packets (team folders) we have forms for them to put their outcome metrics on.
  • #4 Look at adding our own visual of a full IK board.
  • #6 We will ask them to place these information on the story board. This is the standard format of the Kata board. Some companies may modify but it is presented this way because its straight out of the handbook.