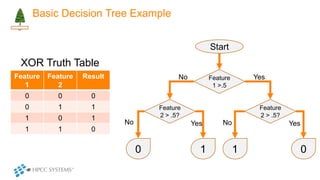
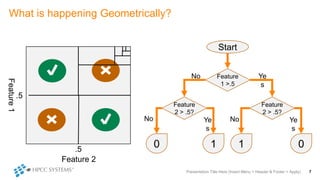
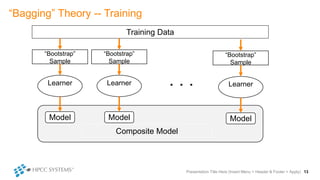
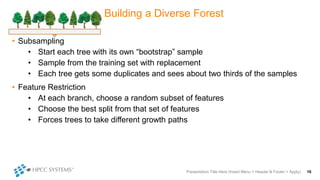
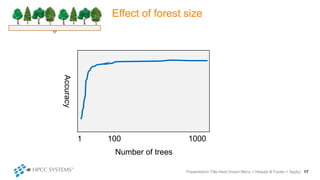
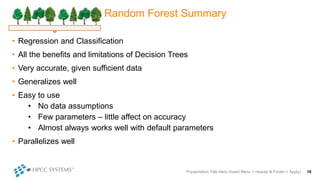
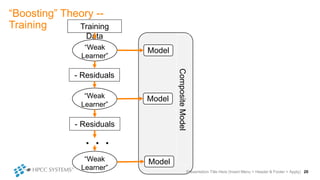
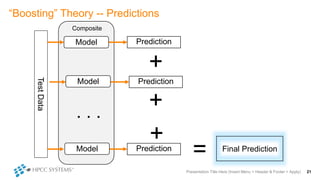
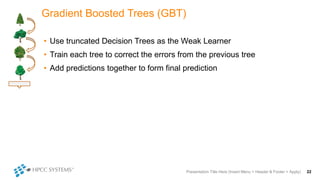
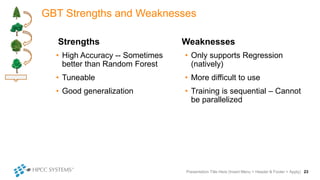
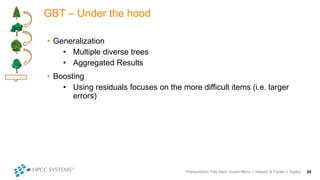
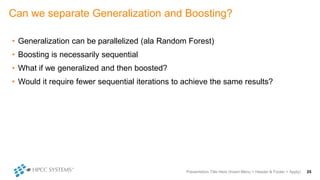
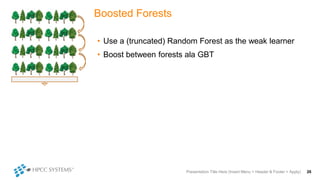
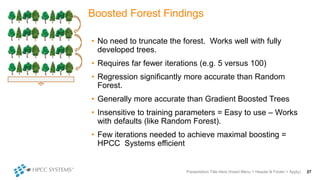
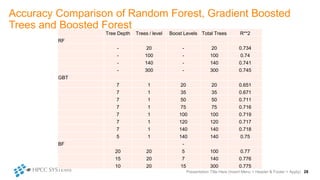
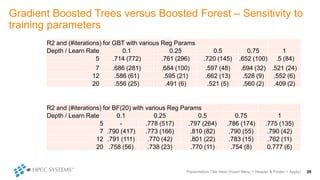
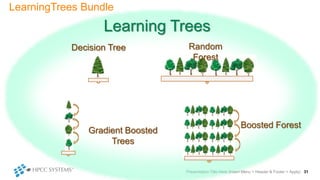
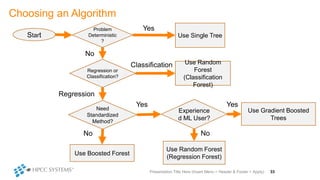
October 9,
2018
Roger Dev
Learning Trees – Decision Tree Learning
Methods
Major Classes of Supervised Machine Learning
• Linear Models
• Neural Network Models
• Decision Tree Models
Presentation Title Here (Insert Menu > Header & Footer > Apply) 2
Learning Trees
=
Goals
• Overview of Learning Tree algorithms
• Science and intuitions behind Learning Trees
• HPCC Systems LearningTrees Bundle
Presentation Title Here (Insert Menu > Header & Footer > Apply) 3
The Animal
Game
Decision Tree
Basics
Basic Decision Tree Example
Feature
1
Feature
2
Result
0 0 0
0 1 1
1 0 1
1 1 0
Start
Feature
1 >.5
Yes
Feature
2 > .5?
Feature
2 > .5?
0 1
No
1 0
NoYes YesNo
XOR Truth Table
What is happening Geometrically?
Presentation Title Here (Insert Menu > Header & Footer > Apply) 7
Feature1
Feature 2
.5
.5
Start
Feature
1 >.5
Ye
s
Feature
2 > .5?
Feature
2 > .5?
0 1
No
1 0
NoYe
s
Ye
s
No
How do we learn a Decision Tree?
Presentation Title Here (Insert Menu > Header & Footer > Apply) 8
High Entropy /
Low Order
Less Entropy / More
Order
Zero Entropy /
Pure Order
Learning Tree Major Strengths and Weaknesses
Strengths
• No Data Assumptions
• Non-Linear
• Discontinuous
Weaknesses
• No extrapolation / interpolation
• Fairly large training set
• Marginally descriptive
Presentation Title Here (Insert Menu > Header & Footer > Apply) 9
Less Data
Preparation and
Analysis needed
More Data needed
Limitations of a Decision Tree
• Deterministic Phenomena Only
• Do not generalize well for stochastic problems
Presentation Title Here (Insert Menu > Header & Footer > Apply) 10
How can that be?
Generalization and Population
• Target = Population
• Sample <<
Population
• Overfitting = Fitting to
the noise in the
sample
• Specifically –
Spurious correlation
Presentation Title Here (Insert Menu > Header & Footer > Apply) 11
PopulationSample 1
Random Forest
Presentation Title Here (Insert Menu > Header & Footer > Apply)12
“Bagging” Theory -- Training
Presentation Title Here (Insert Menu > Header & Footer > Apply) 13
Learner
Training Data
Model
“Bootstrap”
Sample
Learner
Model
“Bootstrap”
Sample
Learner
Model
“Bootstrap”
Sample
. . .
Composite Model
“Bagging” Theory -- Prediction
Presentation Title Here (Insert Menu > Header & Footer > Apply) 14
Test Data
Model Model Model
Composite Model
. . .
Predictions Predictions Predictions
Aggregate
Final Predictions
Random Forest
• Build a forest of diverse decision trees
• Vote / average the results from all
trees
• A Random Forest is:
• Worse than the best possible
tree
• Better than the worst tree
• About as correct as you can
reliably get given the training set
and the population
• “Eliminates” the overfitting problem
Presentation Title Here (Insert Menu > Header & Footer > Apply) 15
Building a Diverse Forest
• Subsampling
• Start each tree with its own “bootstrap” sample
• Sample from the training set with replacement
• Each tree gets some duplicates and sees about two thirds of the samples
• Feature Restriction
• At each branch, choose a random subset of features
• Choose the best split from that set of features
• Forces trees to take different growth paths
Presentation Title Here (Insert Menu > Header & Footer > Apply) 16
Effect of forest size
Presentation Title Here (Insert Menu > Header & Footer > Apply) 17
Accuracy
Number of trees
1 100 1000
Random Forest Summary
• Regression and Classification
• All the benefits and limitations of Decision Trees
• Very accurate, given sufficient data
• Generalizes well
• Easy to use
• No data assumptions
• Few parameters – little affect on accuracy
• Almost always works well with default parameters
• Parallelizes well
Presentation Title Here (Insert Menu > Header & Footer > Apply) 18
Boosted Trees
Presentation Title Here (Insert Menu > Header & Footer > Apply)19
“Boosting” Theory --
Training
Presentation Title Here (Insert Menu > Header & Footer > Apply) 20
“Weak
Learner”
- Residuals
Training
Data
- Residuals
. . .
Model
Model
Model
CompositeModel
“Weak
Learner”
“Weak
Learner”
“Boosting” Theory -- Predictions
Presentation Title Here (Insert Menu > Header & Footer > Apply) 21
TestData
Prediction
Prediction
Prediction
. . .
+
+
+
= Final Prediction
Model
Model
Model
Composite
Gradient Boosted Trees (GBT)
• Use truncated Decision Trees as the Weak Learner
• Train each tree to correct the errors from the previous tree
• Add predictions together to form final prediction
Presentation Title Here (Insert Menu > Header & Footer > Apply) 22
GBT Strengths and Weaknesses
Strengths
• High Accuracy -- Sometimes
better than Random Forest
• Tuneable
• Good generalization
Weaknesses
• Only supports Regression
(natively)
• More difficult to use
• Training is sequential – Cannot
be parallelized
Presentation Title Here (Insert Menu > Header & Footer > Apply) 23
GBT – Under the hood
• Generalization
• Multiple diverse trees
• Aggregated Results
• Boosting
• Using residuals focuses on the more difficult items (i.e. larger
errors)
Presentation Title Here (Insert Menu > Header & Footer > Apply) 24
Can we separate Generalization and Boosting?
• Generalization can be parallelized (ala Random Forest)
• Boosting is necessarily sequential
• What if we generalized and then boosted?
• Would it require fewer sequential iterations to achieve the same results?
Presentation Title Here (Insert Menu > Header & Footer > Apply) 25
Boosted Forests
• Use a (truncated) Random Forest as the weak learner
• Boost between forests ala GBT
Presentation Title Here (Insert Menu > Header & Footer > Apply) 26
Boosted Forest Findings
• No need to truncate the forest. Works well with fully
developed trees.
• Requires far fewer iterations (e.g. 5 versus 100)
• Regression significantly more accurate than Random
Forest.
• Generally more accurate than Gradient Boosted Trees
• Insensitive to training parameters = Easy to use – Works
with defaults (like Random Forest).
• Few iterations needed to achieve maximal boosting =
HPCC Systems efficient
Presentation Title Here (Insert Menu > Header & Footer > Apply) 27
Accuracy Comparison of Random Forest, Gradient Boosted
Trees and Boosted Forest
Presentation Title Here (Insert Menu > Header & Footer > Apply) 28
Tree Depth Trees / level Boost Levels Total Trees R**2
RF
- 20 - 20 0.734
- 100 - 100 0.74
- 140 - 140 0.741
- 300 - 300 0.745
GBT
7 1 20 20 0.651
7 1 35 35 0.671
7 1 50 50 0.711
7 1 75 75 0.716
7 1 100 100 0.719
7 1 120 120 0.717
7 1 140 140 0.718
5 1 140 140 0.75
BF -
20 20 5 100 0.77
15 20 7 140 0.776
10 20 15 300 0.775
Gradient Boosted Trees versus Boosted Forest – Sensitivity to
training parameters
Presentation Title Here (Insert Menu > Header & Footer > Apply) 29
R2 and (#iterations) for GBT with various Reg Params
Depth / Learn Rate 0.1 0.25 0.5 0.75 1
5 .714 (772) .761 (296) .720 (145) .652 (100) .5 (84)
7 .686 (281) .684 (100) .597 (48) .694 (32) .521 (24)
12 .586 (61) .595 (21) .662 (13) .528 (9) .552 (6)
20 .556 (25) .491 (6) .521 (5) .560 (2) .409 (2)
R2 and (#iterations) for BF(20) with various Reg Params
Depth / Learn Rate 0.1 0.25 0.5 0.75 1
5 - .778 (517) .797 (264) .786 (174) .775 (135)
7 .790 (417) .773 (166) .810 (82) .790 (55) .790 (42)
12 .791 (111) .770 (42) .801 (22) .783 (15) .762 (11)
20 .758 (56) .738 (23) .770 (11) .754 (8) 0.777 (6)
LearningTrees
Bundle
Presentation Title Here (Insert Menu > Header & Footer > Apply)30
LearningTrees Bundle
Presentation Title Here (Insert Menu > Header & Footer > Apply) 31
Learning Trees
Decision Tree Random
Forest
Gradient Boosted
Trees
Boosted Forest
LearningTrees Bundle additional capabilities
• Features can be any type of numeric data:
• Real values
• Integers
• Binary
• Categorical
• Output can be categorical (Classification Forest) or real-valued (Regression Forest).
• Multinomial classification is supported directly.
• Myriad Interface -- Multiple separate forests can be grown at once, and produce a composite model in
parallel. This can further improve the performance on an HPCC Systems Cluster.
• Accuracy Assessment -- Produces a range of statistics regarding the accuracy of the model given a set of
test data.
• Feature Importance -- Analyses the importance of each feature in the decision process.
• Decision Distance -- Provides insight into the similarity of different data points in a multi-dimensional
decision space.
• Uniqueness Factor -- Indicates how isolated a given data point is relative to other points in decision
space.
Presentation Title Here (Insert Menu > Header & Footer > Apply) 32
Choosing an Algorithm
Presentation Title Here (Insert Menu > Header & Footer > Apply) 33
Start
Problem
Deterministic
?
Regression or
Classification?
Use Single Tree
Use Random
Forest
(Classification
Forest)
Need
Standardized
Method?
Experience
d ML User?
Use Gradient Boosted
Trees
Use Random Forest
(Regression Forest)
Use Boosted Forest
Yes
No
Classification
Regression
Yes Yes
No No
Closing
• Contact:
• Roger.Dev@LexisNexisRisk.com
• Blogs:
• https://hpccsystems.com/LearningTrees
Presentation Title Here (Insert Menu > Header & Footer > Apply) 34

Learning Trees - Decision Tree Learning Methods

  • 1.
    October 9, 2018 Roger Dev LearningTrees – Decision Tree Learning Methods
  • 2.
    Major Classes ofSupervised Machine Learning • Linear Models • Neural Network Models • Decision Tree Models Presentation Title Here (Insert Menu > Header & Footer > Apply) 2 Learning Trees =
  • 3.
    Goals • Overview ofLearning Tree algorithms • Science and intuitions behind Learning Trees • HPCC Systems LearningTrees Bundle Presentation Title Here (Insert Menu > Header & Footer > Apply) 3
  • 4.
  • 5.
  • 6.
    Basic Decision TreeExample Feature 1 Feature 2 Result 0 0 0 0 1 1 1 0 1 1 1 0 Start Feature 1 >.5 Yes Feature 2 > .5? Feature 2 > .5? 0 1 No 1 0 NoYes YesNo XOR Truth Table
  • 7.
    What is happeningGeometrically? Presentation Title Here (Insert Menu > Header & Footer > Apply) 7 Feature1 Feature 2 .5 .5 Start Feature 1 >.5 Ye s Feature 2 > .5? Feature 2 > .5? 0 1 No 1 0 NoYe s Ye s No
  • 8.
    How do welearn a Decision Tree? Presentation Title Here (Insert Menu > Header & Footer > Apply) 8 High Entropy / Low Order Less Entropy / More Order Zero Entropy / Pure Order
  • 9.
    Learning Tree MajorStrengths and Weaknesses Strengths • No Data Assumptions • Non-Linear • Discontinuous Weaknesses • No extrapolation / interpolation • Fairly large training set • Marginally descriptive Presentation Title Here (Insert Menu > Header & Footer > Apply) 9 Less Data Preparation and Analysis needed More Data needed
  • 10.
    Limitations of aDecision Tree • Deterministic Phenomena Only • Do not generalize well for stochastic problems Presentation Title Here (Insert Menu > Header & Footer > Apply) 10 How can that be?
  • 11.
    Generalization and Population •Target = Population • Sample << Population • Overfitting = Fitting to the noise in the sample • Specifically – Spurious correlation Presentation Title Here (Insert Menu > Header & Footer > Apply) 11 PopulationSample 1
  • 12.
    Random Forest Presentation TitleHere (Insert Menu > Header & Footer > Apply)12
  • 13.
    “Bagging” Theory --Training Presentation Title Here (Insert Menu > Header & Footer > Apply) 13 Learner Training Data Model “Bootstrap” Sample Learner Model “Bootstrap” Sample Learner Model “Bootstrap” Sample . . . Composite Model
  • 14.
    “Bagging” Theory --Prediction Presentation Title Here (Insert Menu > Header & Footer > Apply) 14 Test Data Model Model Model Composite Model . . . Predictions Predictions Predictions Aggregate Final Predictions
  • 15.
    Random Forest • Builda forest of diverse decision trees • Vote / average the results from all trees • A Random Forest is: • Worse than the best possible tree • Better than the worst tree • About as correct as you can reliably get given the training set and the population • “Eliminates” the overfitting problem Presentation Title Here (Insert Menu > Header & Footer > Apply) 15
  • 16.
    Building a DiverseForest • Subsampling • Start each tree with its own “bootstrap” sample • Sample from the training set with replacement • Each tree gets some duplicates and sees about two thirds of the samples • Feature Restriction • At each branch, choose a random subset of features • Choose the best split from that set of features • Forces trees to take different growth paths Presentation Title Here (Insert Menu > Header & Footer > Apply) 16
  • 17.
    Effect of forestsize Presentation Title Here (Insert Menu > Header & Footer > Apply) 17 Accuracy Number of trees 1 100 1000
  • 18.
    Random Forest Summary •Regression and Classification • All the benefits and limitations of Decision Trees • Very accurate, given sufficient data • Generalizes well • Easy to use • No data assumptions • Few parameters – little affect on accuracy • Almost always works well with default parameters • Parallelizes well Presentation Title Here (Insert Menu > Header & Footer > Apply) 18
  • 19.
    Boosted Trees Presentation TitleHere (Insert Menu > Header & Footer > Apply)19
  • 20.
    “Boosting” Theory -- Training PresentationTitle Here (Insert Menu > Header & Footer > Apply) 20 “Weak Learner” - Residuals Training Data - Residuals . . . Model Model Model CompositeModel “Weak Learner” “Weak Learner”
  • 21.
    “Boosting” Theory --Predictions Presentation Title Here (Insert Menu > Header & Footer > Apply) 21 TestData Prediction Prediction Prediction . . . + + + = Final Prediction Model Model Model Composite
  • 22.
    Gradient Boosted Trees(GBT) • Use truncated Decision Trees as the Weak Learner • Train each tree to correct the errors from the previous tree • Add predictions together to form final prediction Presentation Title Here (Insert Menu > Header & Footer > Apply) 22
  • 23.
    GBT Strengths andWeaknesses Strengths • High Accuracy -- Sometimes better than Random Forest • Tuneable • Good generalization Weaknesses • Only supports Regression (natively) • More difficult to use • Training is sequential – Cannot be parallelized Presentation Title Here (Insert Menu > Header & Footer > Apply) 23
  • 24.
    GBT – Underthe hood • Generalization • Multiple diverse trees • Aggregated Results • Boosting • Using residuals focuses on the more difficult items (i.e. larger errors) Presentation Title Here (Insert Menu > Header & Footer > Apply) 24
  • 25.
    Can we separateGeneralization and Boosting? • Generalization can be parallelized (ala Random Forest) • Boosting is necessarily sequential • What if we generalized and then boosted? • Would it require fewer sequential iterations to achieve the same results? Presentation Title Here (Insert Menu > Header & Footer > Apply) 25
  • 26.
    Boosted Forests • Usea (truncated) Random Forest as the weak learner • Boost between forests ala GBT Presentation Title Here (Insert Menu > Header & Footer > Apply) 26
  • 27.
    Boosted Forest Findings •No need to truncate the forest. Works well with fully developed trees. • Requires far fewer iterations (e.g. 5 versus 100) • Regression significantly more accurate than Random Forest. • Generally more accurate than Gradient Boosted Trees • Insensitive to training parameters = Easy to use – Works with defaults (like Random Forest). • Few iterations needed to achieve maximal boosting = HPCC Systems efficient Presentation Title Here (Insert Menu > Header & Footer > Apply) 27
  • 28.
    Accuracy Comparison ofRandom Forest, Gradient Boosted Trees and Boosted Forest Presentation Title Here (Insert Menu > Header & Footer > Apply) 28 Tree Depth Trees / level Boost Levels Total Trees R**2 RF - 20 - 20 0.734 - 100 - 100 0.74 - 140 - 140 0.741 - 300 - 300 0.745 GBT 7 1 20 20 0.651 7 1 35 35 0.671 7 1 50 50 0.711 7 1 75 75 0.716 7 1 100 100 0.719 7 1 120 120 0.717 7 1 140 140 0.718 5 1 140 140 0.75 BF - 20 20 5 100 0.77 15 20 7 140 0.776 10 20 15 300 0.775
  • 29.
    Gradient Boosted Treesversus Boosted Forest – Sensitivity to training parameters Presentation Title Here (Insert Menu > Header & Footer > Apply) 29 R2 and (#iterations) for GBT with various Reg Params Depth / Learn Rate 0.1 0.25 0.5 0.75 1 5 .714 (772) .761 (296) .720 (145) .652 (100) .5 (84) 7 .686 (281) .684 (100) .597 (48) .694 (32) .521 (24) 12 .586 (61) .595 (21) .662 (13) .528 (9) .552 (6) 20 .556 (25) .491 (6) .521 (5) .560 (2) .409 (2) R2 and (#iterations) for BF(20) with various Reg Params Depth / Learn Rate 0.1 0.25 0.5 0.75 1 5 - .778 (517) .797 (264) .786 (174) .775 (135) 7 .790 (417) .773 (166) .810 (82) .790 (55) .790 (42) 12 .791 (111) .770 (42) .801 (22) .783 (15) .762 (11) 20 .758 (56) .738 (23) .770 (11) .754 (8) 0.777 (6)
  • 30.
    LearningTrees Bundle Presentation Title Here(Insert Menu > Header & Footer > Apply)30
  • 31.
    LearningTrees Bundle Presentation TitleHere (Insert Menu > Header & Footer > Apply) 31 Learning Trees Decision Tree Random Forest Gradient Boosted Trees Boosted Forest
  • 32.
    LearningTrees Bundle additionalcapabilities • Features can be any type of numeric data: • Real values • Integers • Binary • Categorical • Output can be categorical (Classification Forest) or real-valued (Regression Forest). • Multinomial classification is supported directly. • Myriad Interface -- Multiple separate forests can be grown at once, and produce a composite model in parallel. This can further improve the performance on an HPCC Systems Cluster. • Accuracy Assessment -- Produces a range of statistics regarding the accuracy of the model given a set of test data. • Feature Importance -- Analyses the importance of each feature in the decision process. • Decision Distance -- Provides insight into the similarity of different data points in a multi-dimensional decision space. • Uniqueness Factor -- Indicates how isolated a given data point is relative to other points in decision space. Presentation Title Here (Insert Menu > Header & Footer > Apply) 32
  • 33.
    Choosing an Algorithm PresentationTitle Here (Insert Menu > Header & Footer > Apply) 33 Start Problem Deterministic ? Regression or Classification? Use Single Tree Use Random Forest (Classification Forest) Need Standardized Method? Experience d ML User? Use Gradient Boosted Trees Use Random Forest (Regression Forest) Use Boosted Forest Yes No Classification Regression Yes Yes No No
  • 34.
    Closing • Contact: • Roger.Dev@LexisNexisRisk.com •Blogs: • https://hpccsystems.com/LearningTrees Presentation Title Here (Insert Menu > Header & Footer > Apply) 34