Download to read offline


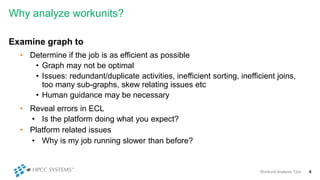
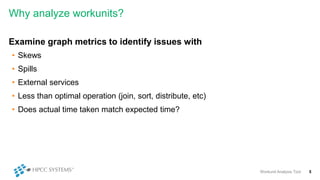
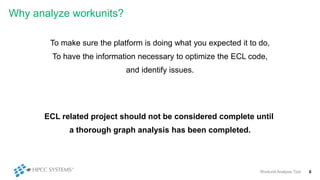

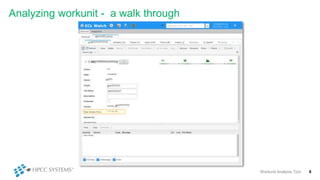
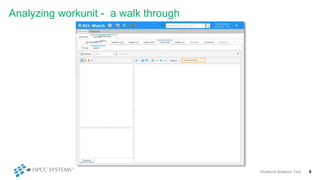
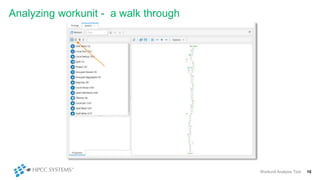
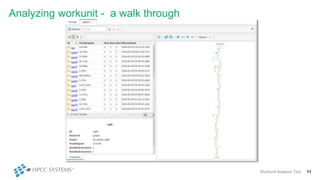
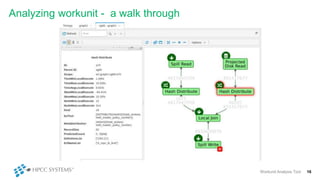
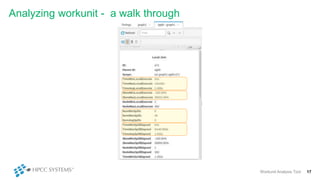
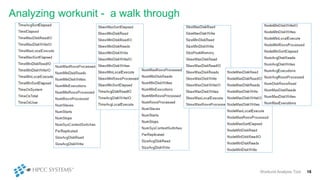
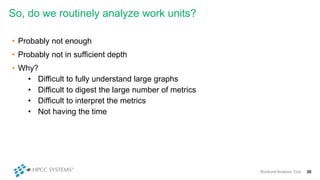

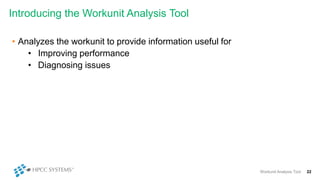
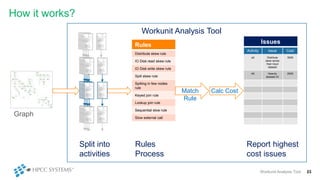
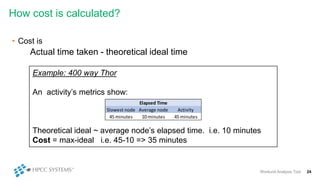

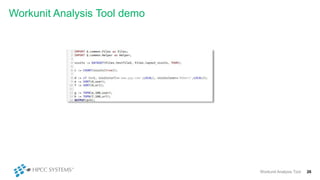
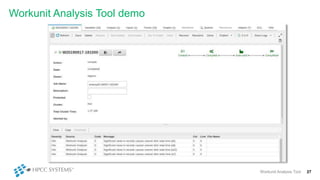
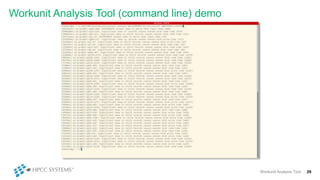


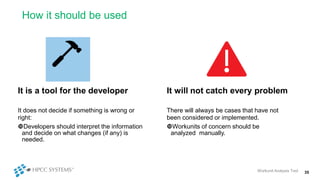


The document discusses the importance of analyzing workunits to optimize ECL code and diagnose potential issues. It introduces a workunit analysis tool that provides insights on performance improvement and diagnostics by examining graph metrics and identifying inefficiencies. Challenges related to manual analysis are highlighted, along with the tool's capabilities to automate the analysis process and suggestions for further enhancement.