
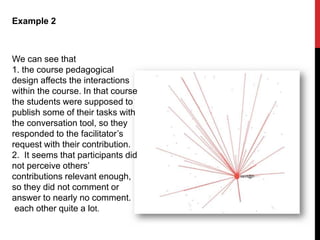
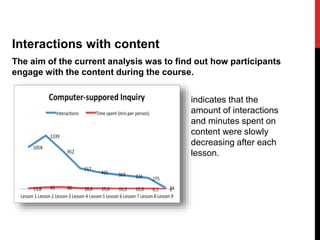
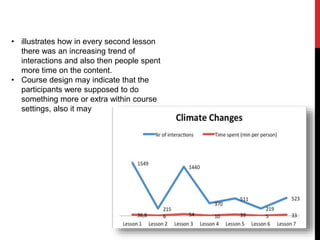
Download to read offline

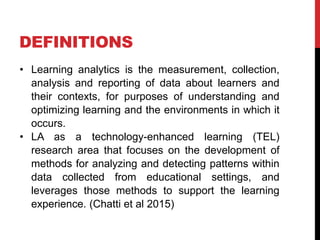
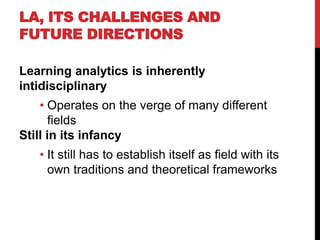
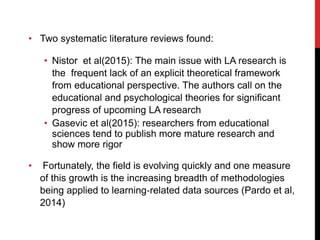
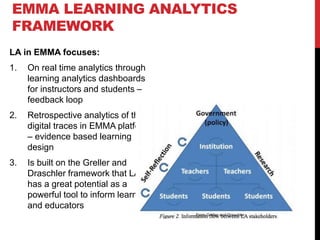

This document summarizes a presentation on learning analytics in MOOCs given at a data science and social research conference. It defines key terms like learning analytics and discusses challenges like the interdisciplinary nature of the field and its current state of infancy. It also examines how learning analytics can help with issues in MOOCs like effectiveness, business models, technology/pedagogy, and more. The EMMA project framework for learning analytics in MOOCs is presented, including its use of dashboards, the XAPI standard, and clustering/network analysis of learner data. Conclusions discuss pedagogical neutrality and future work.


