Download as PDF, PPTX


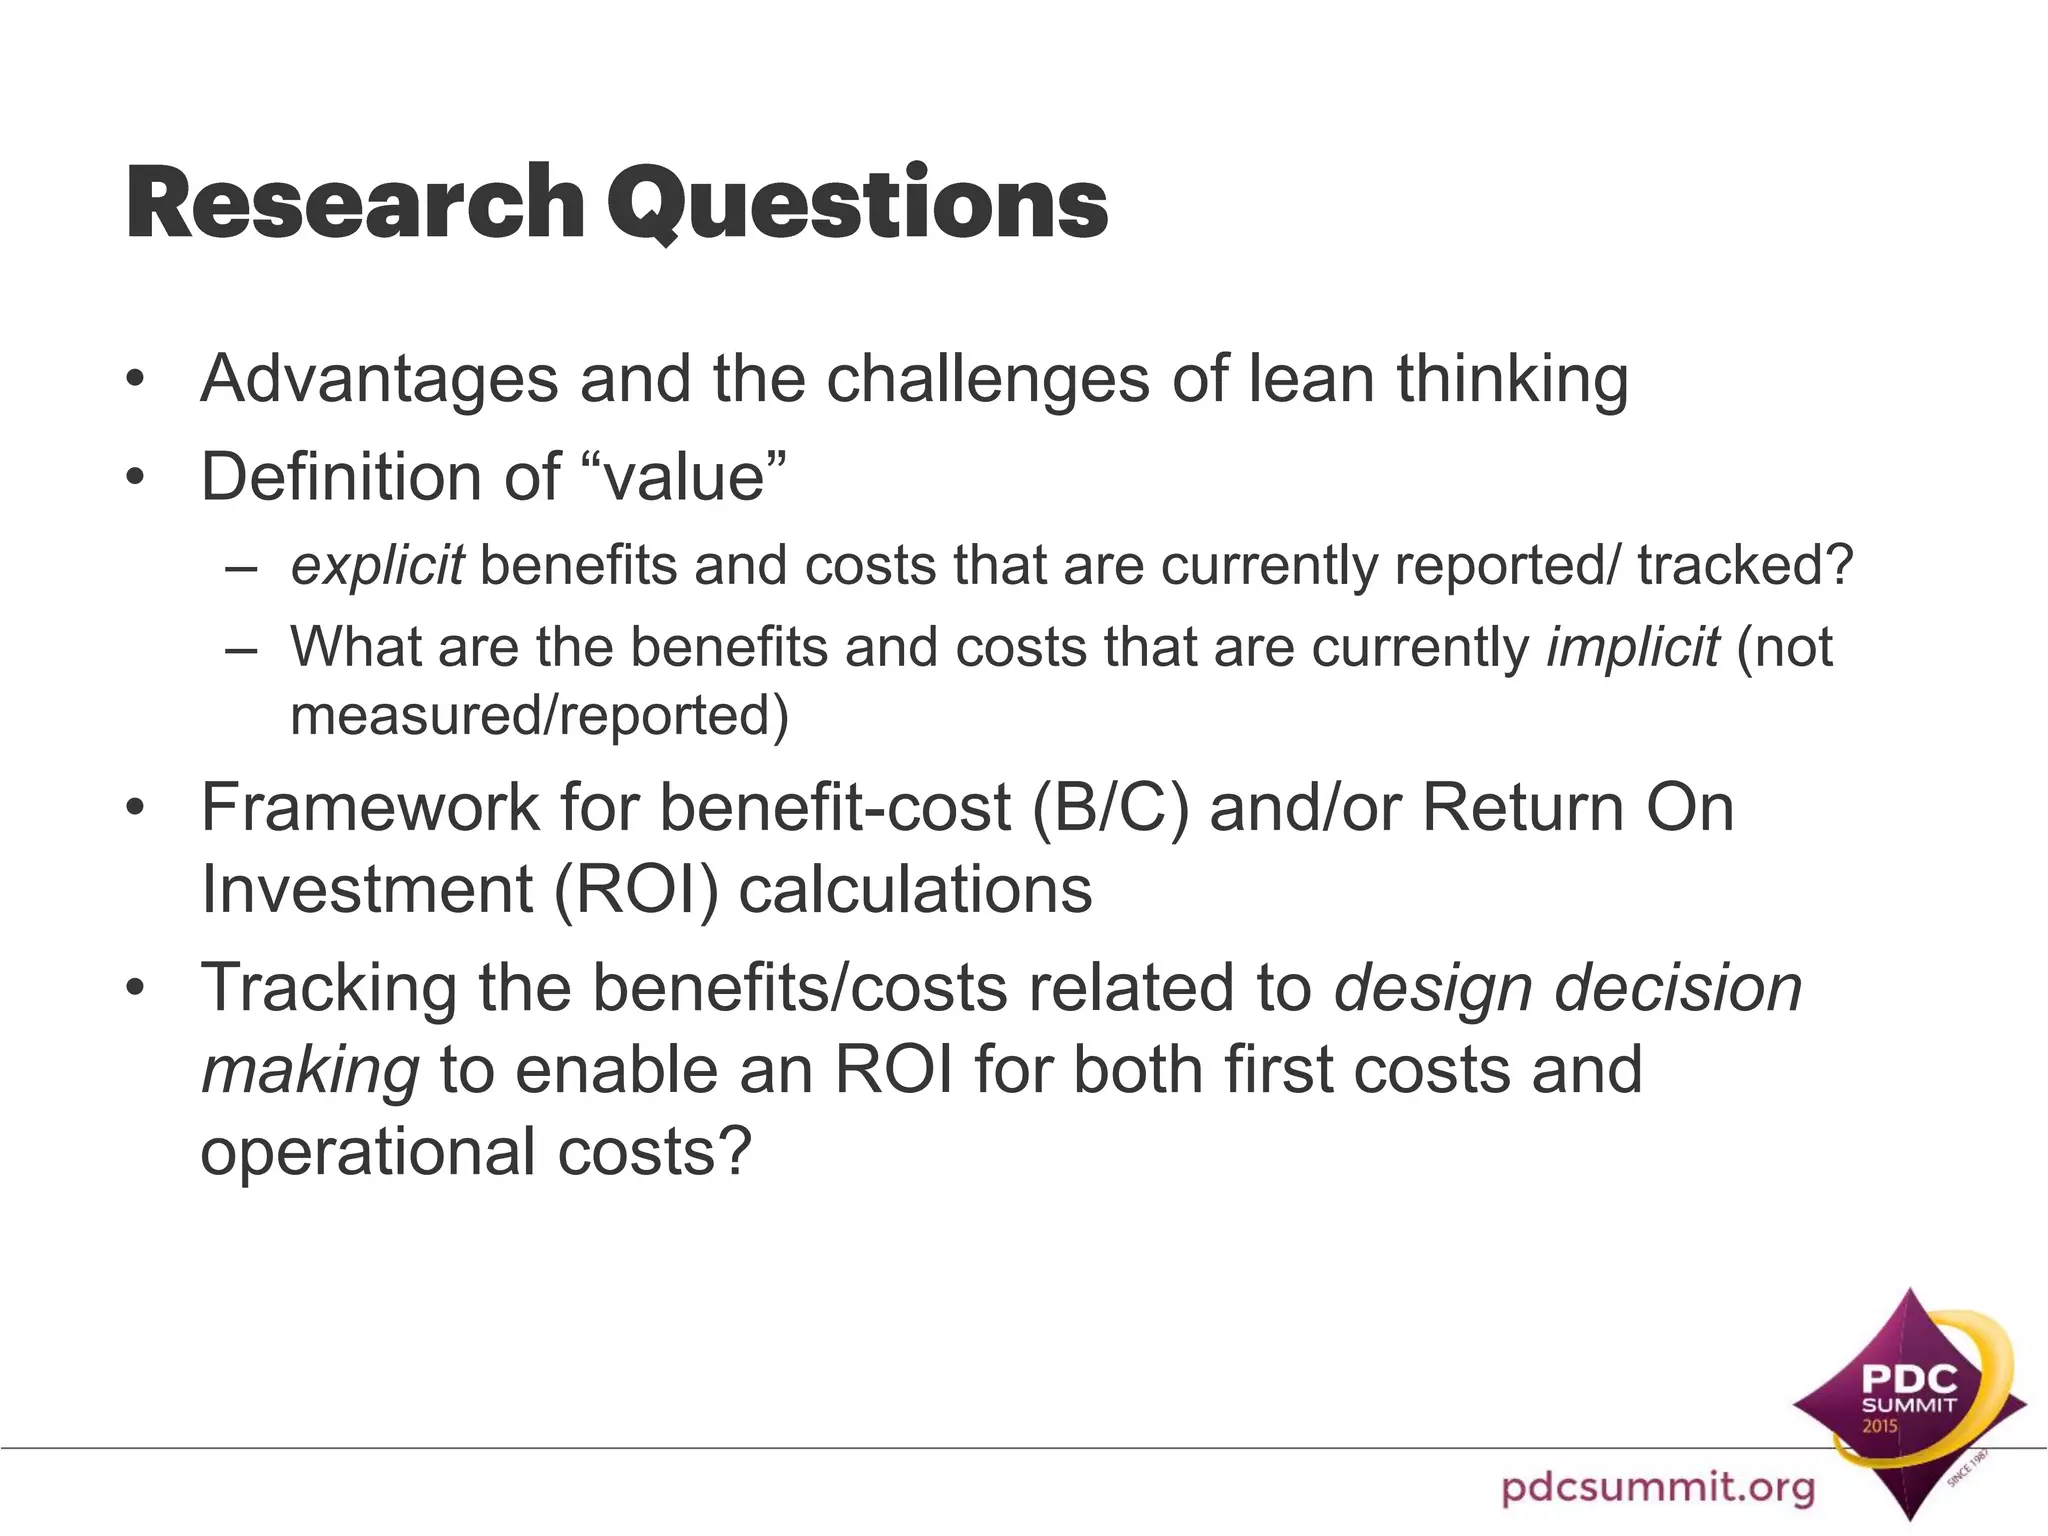


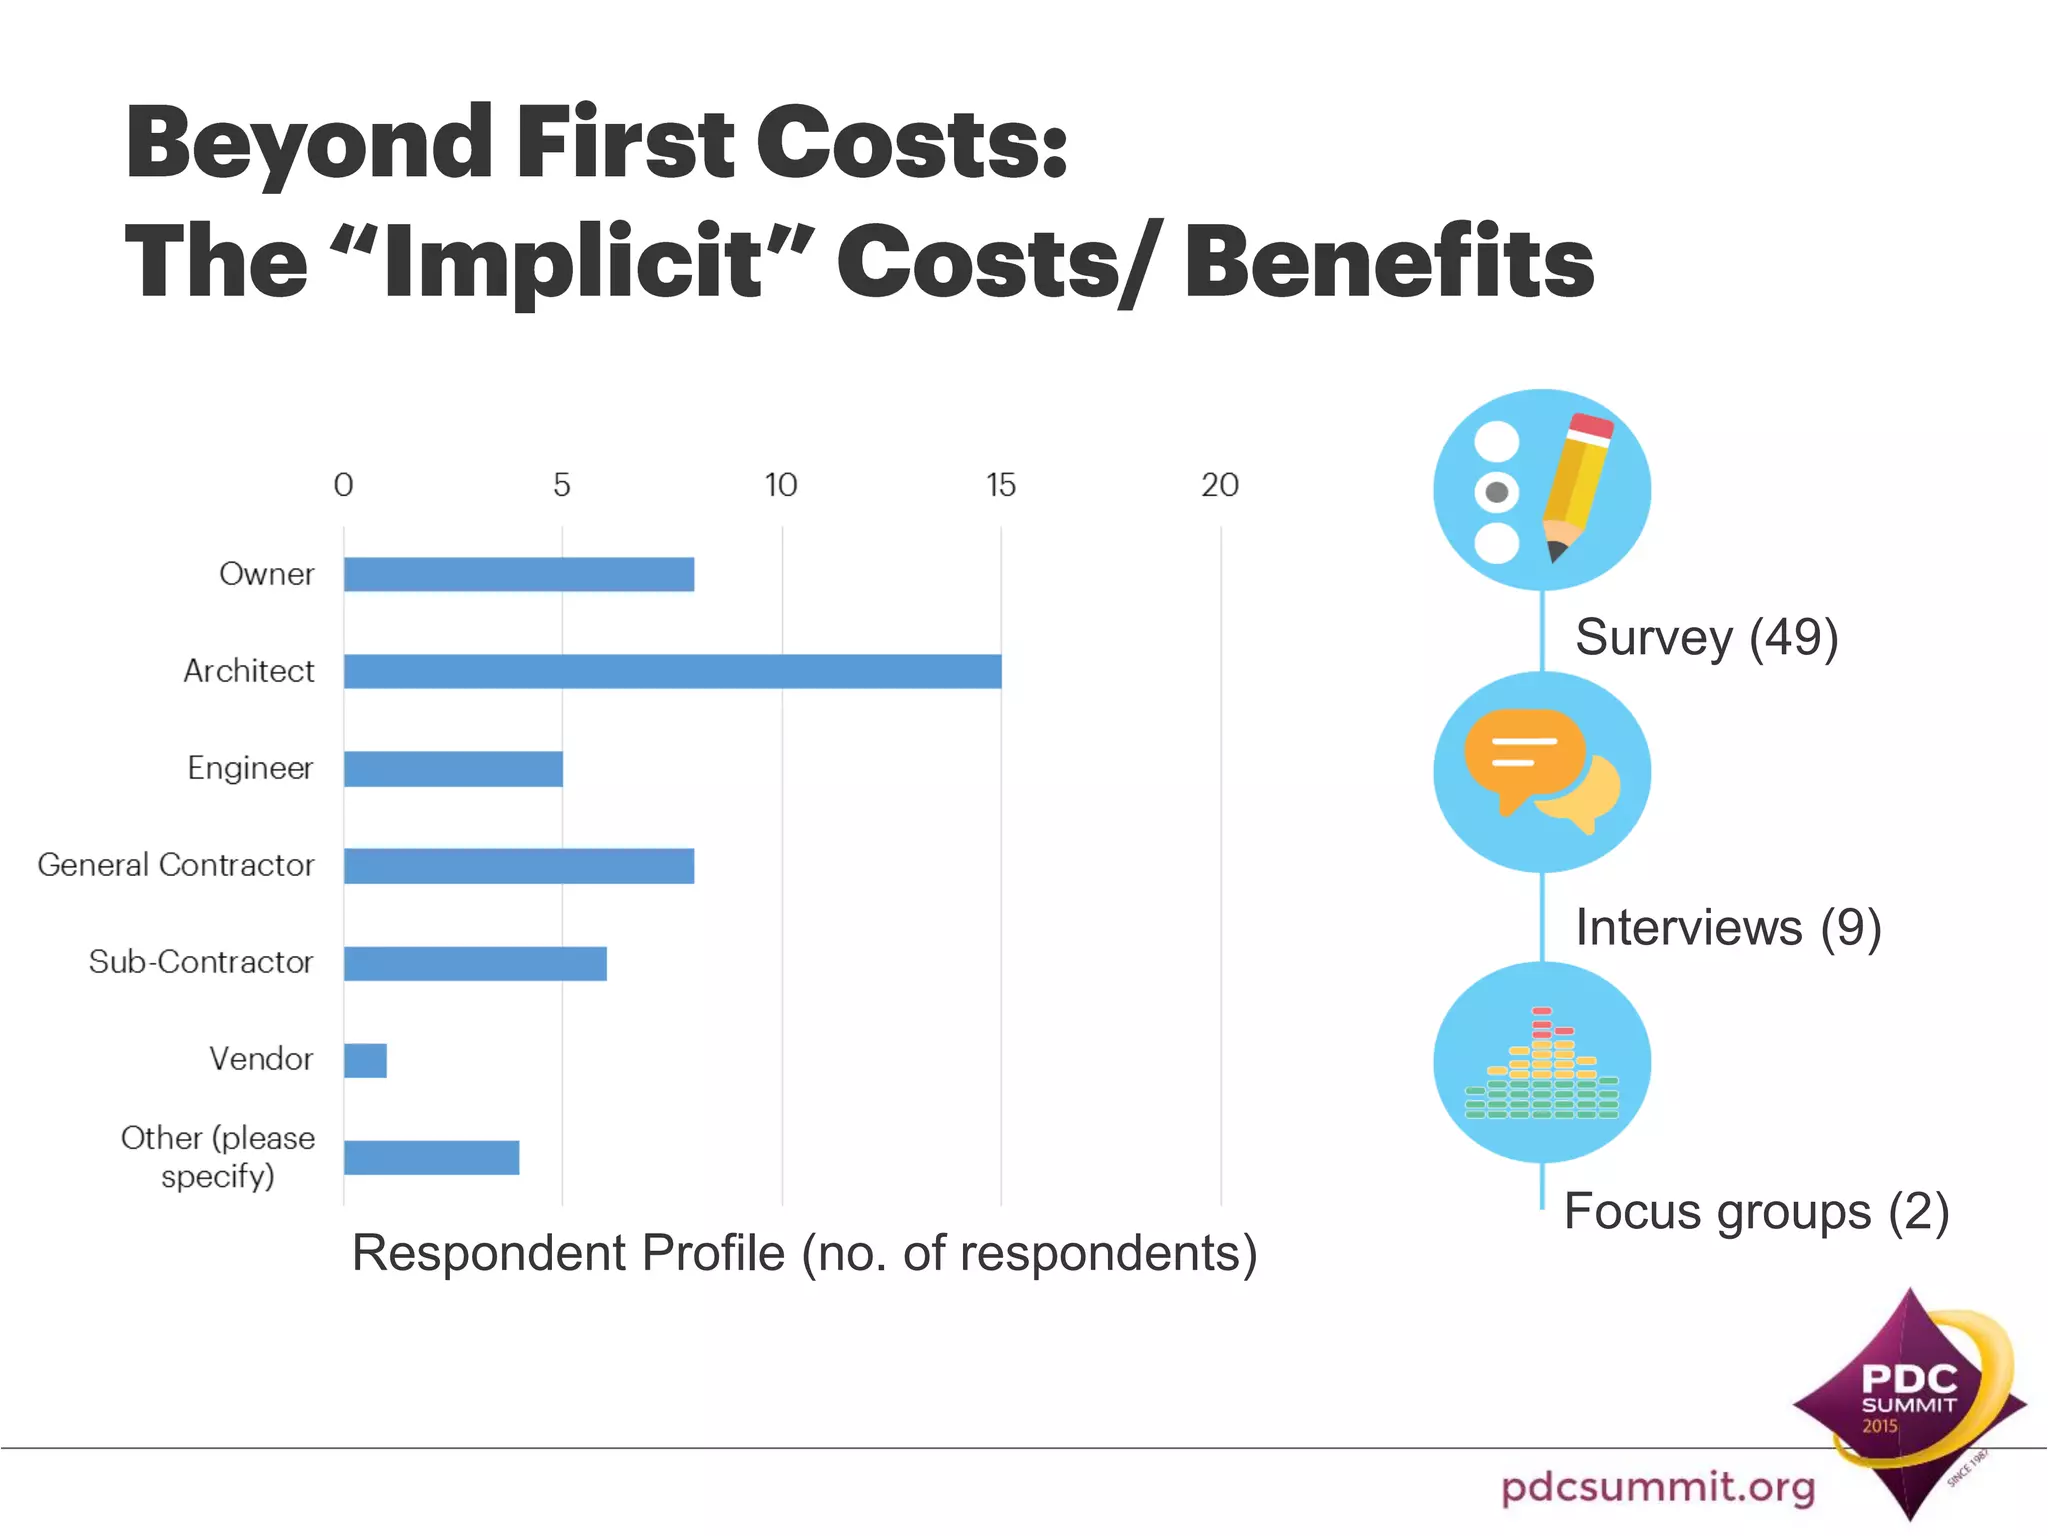

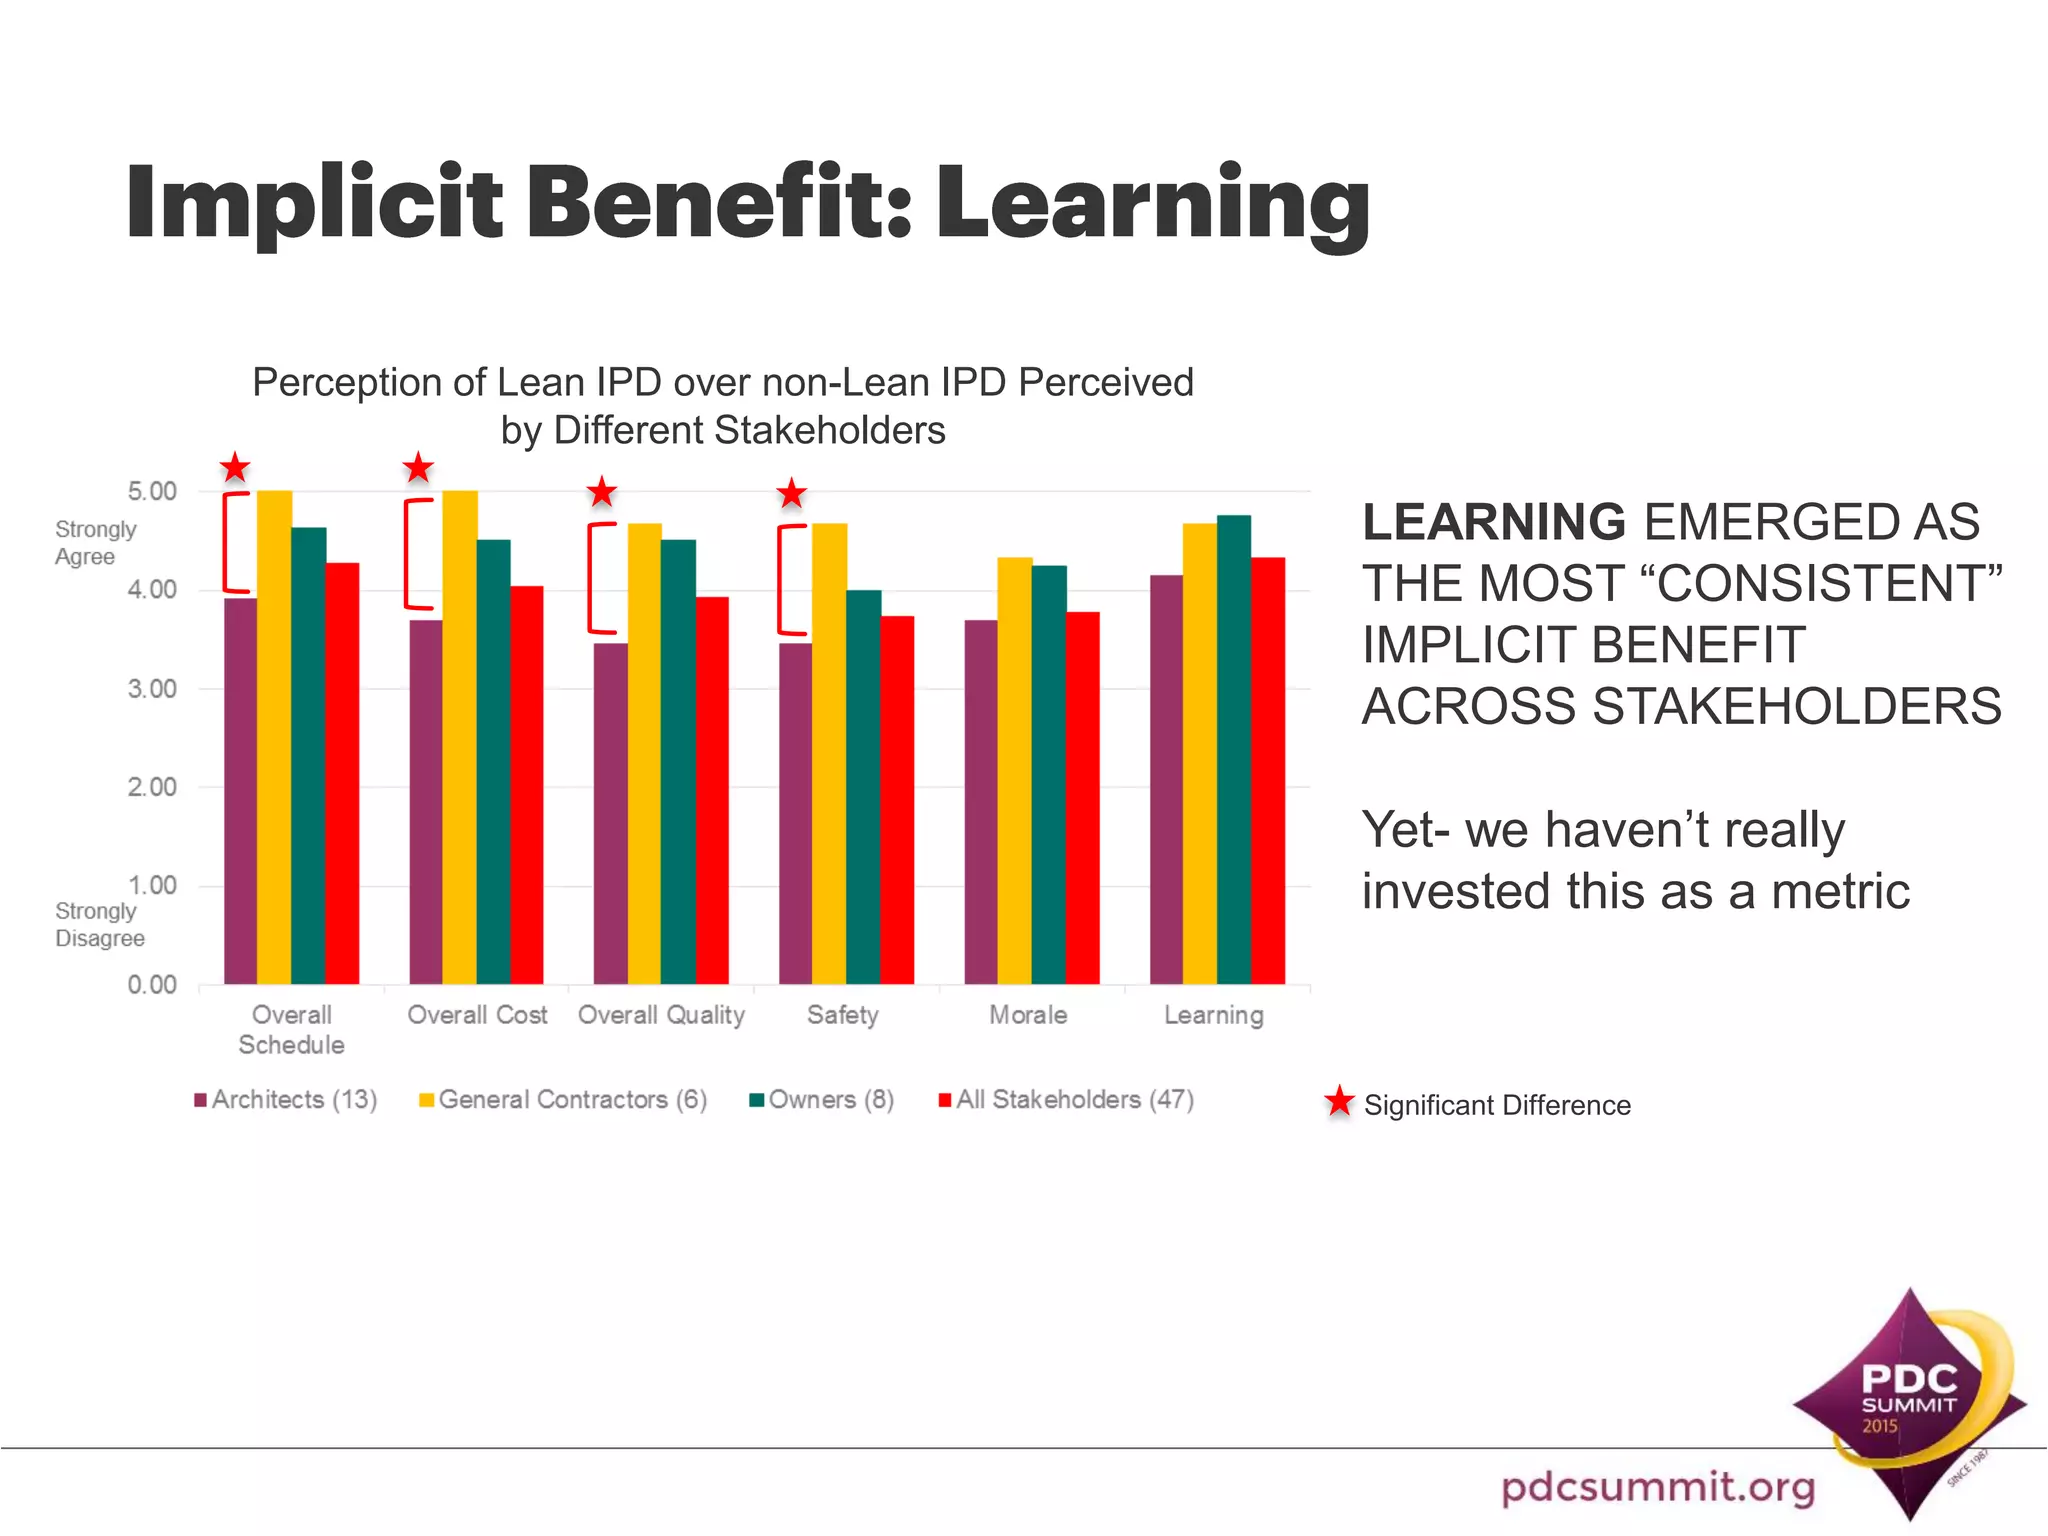
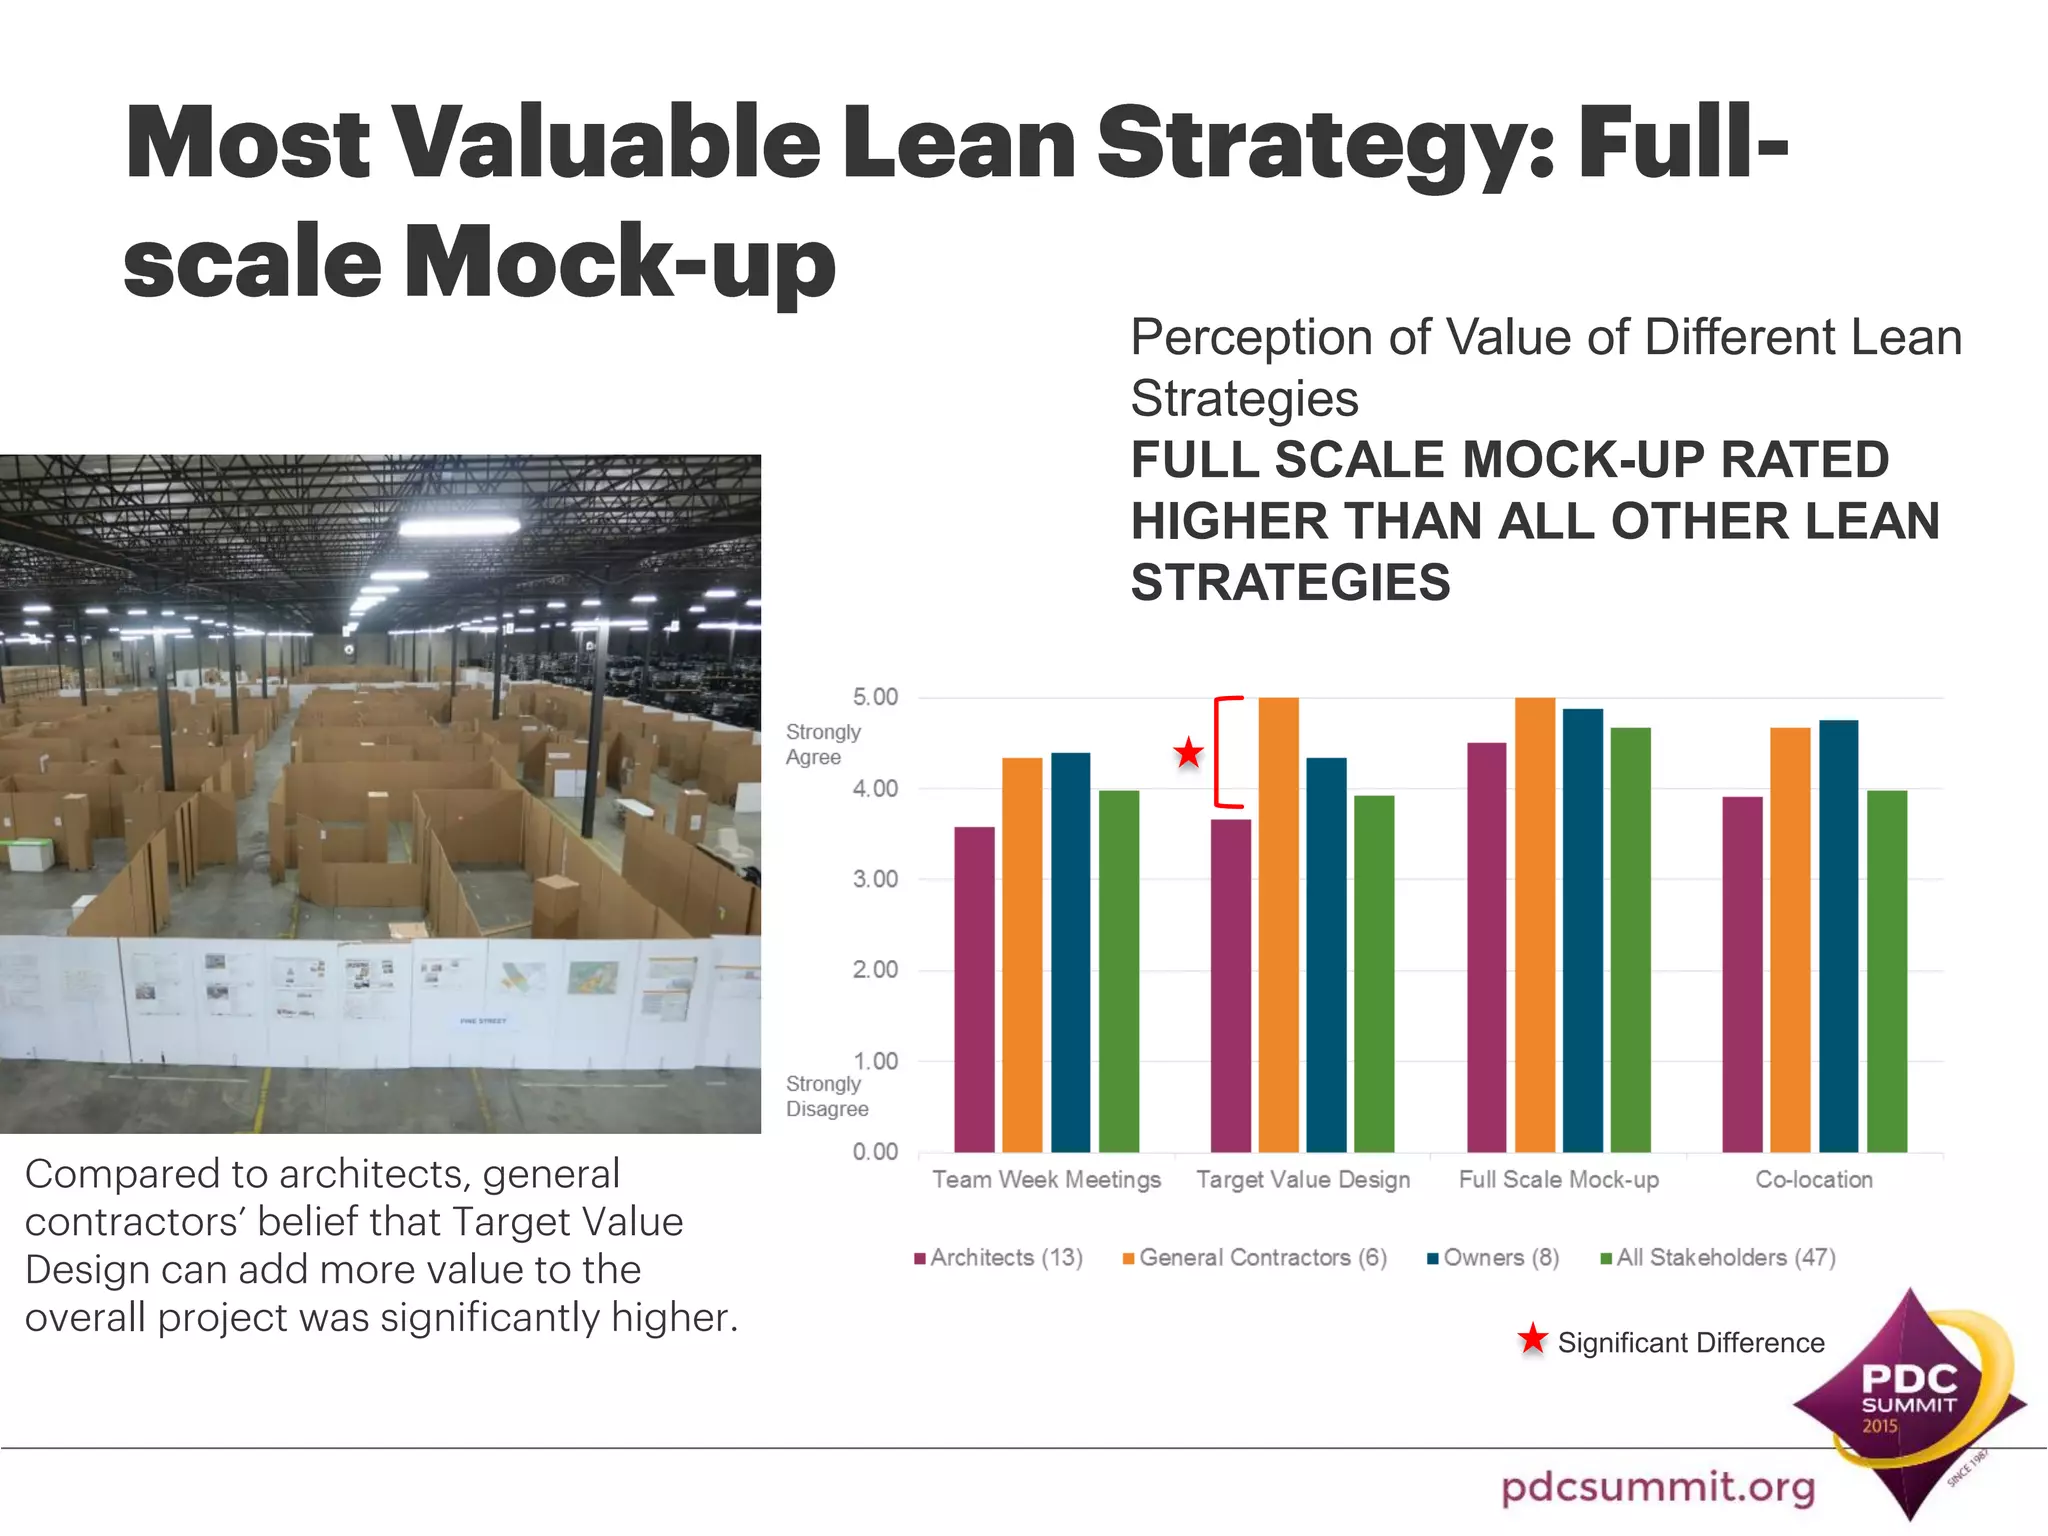
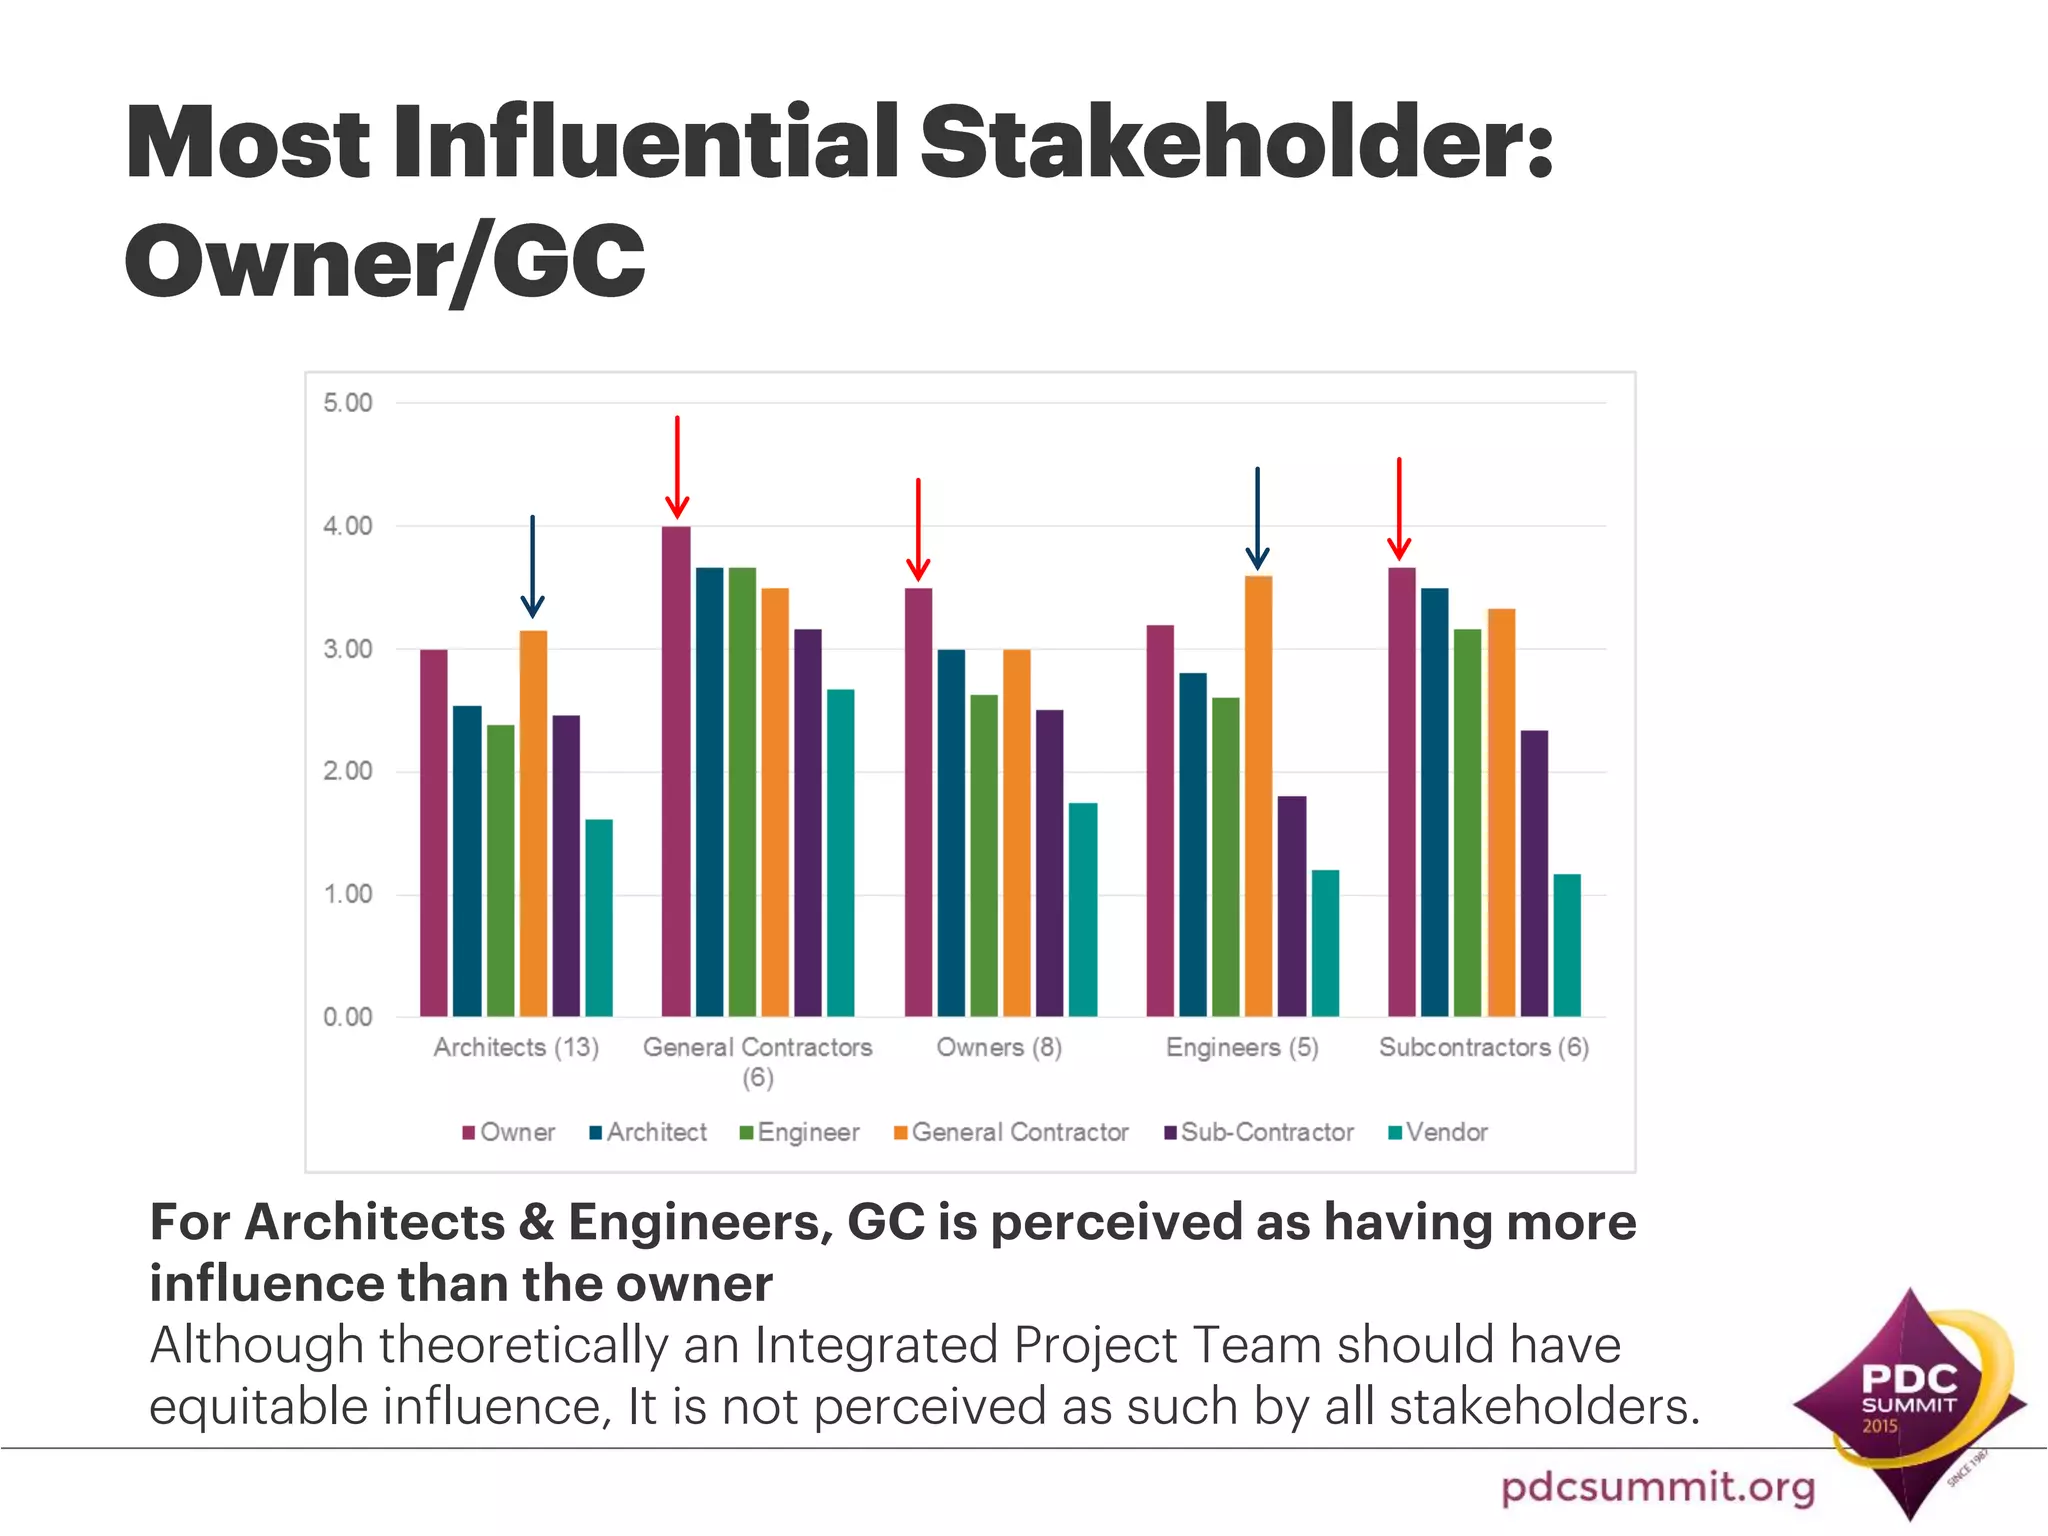


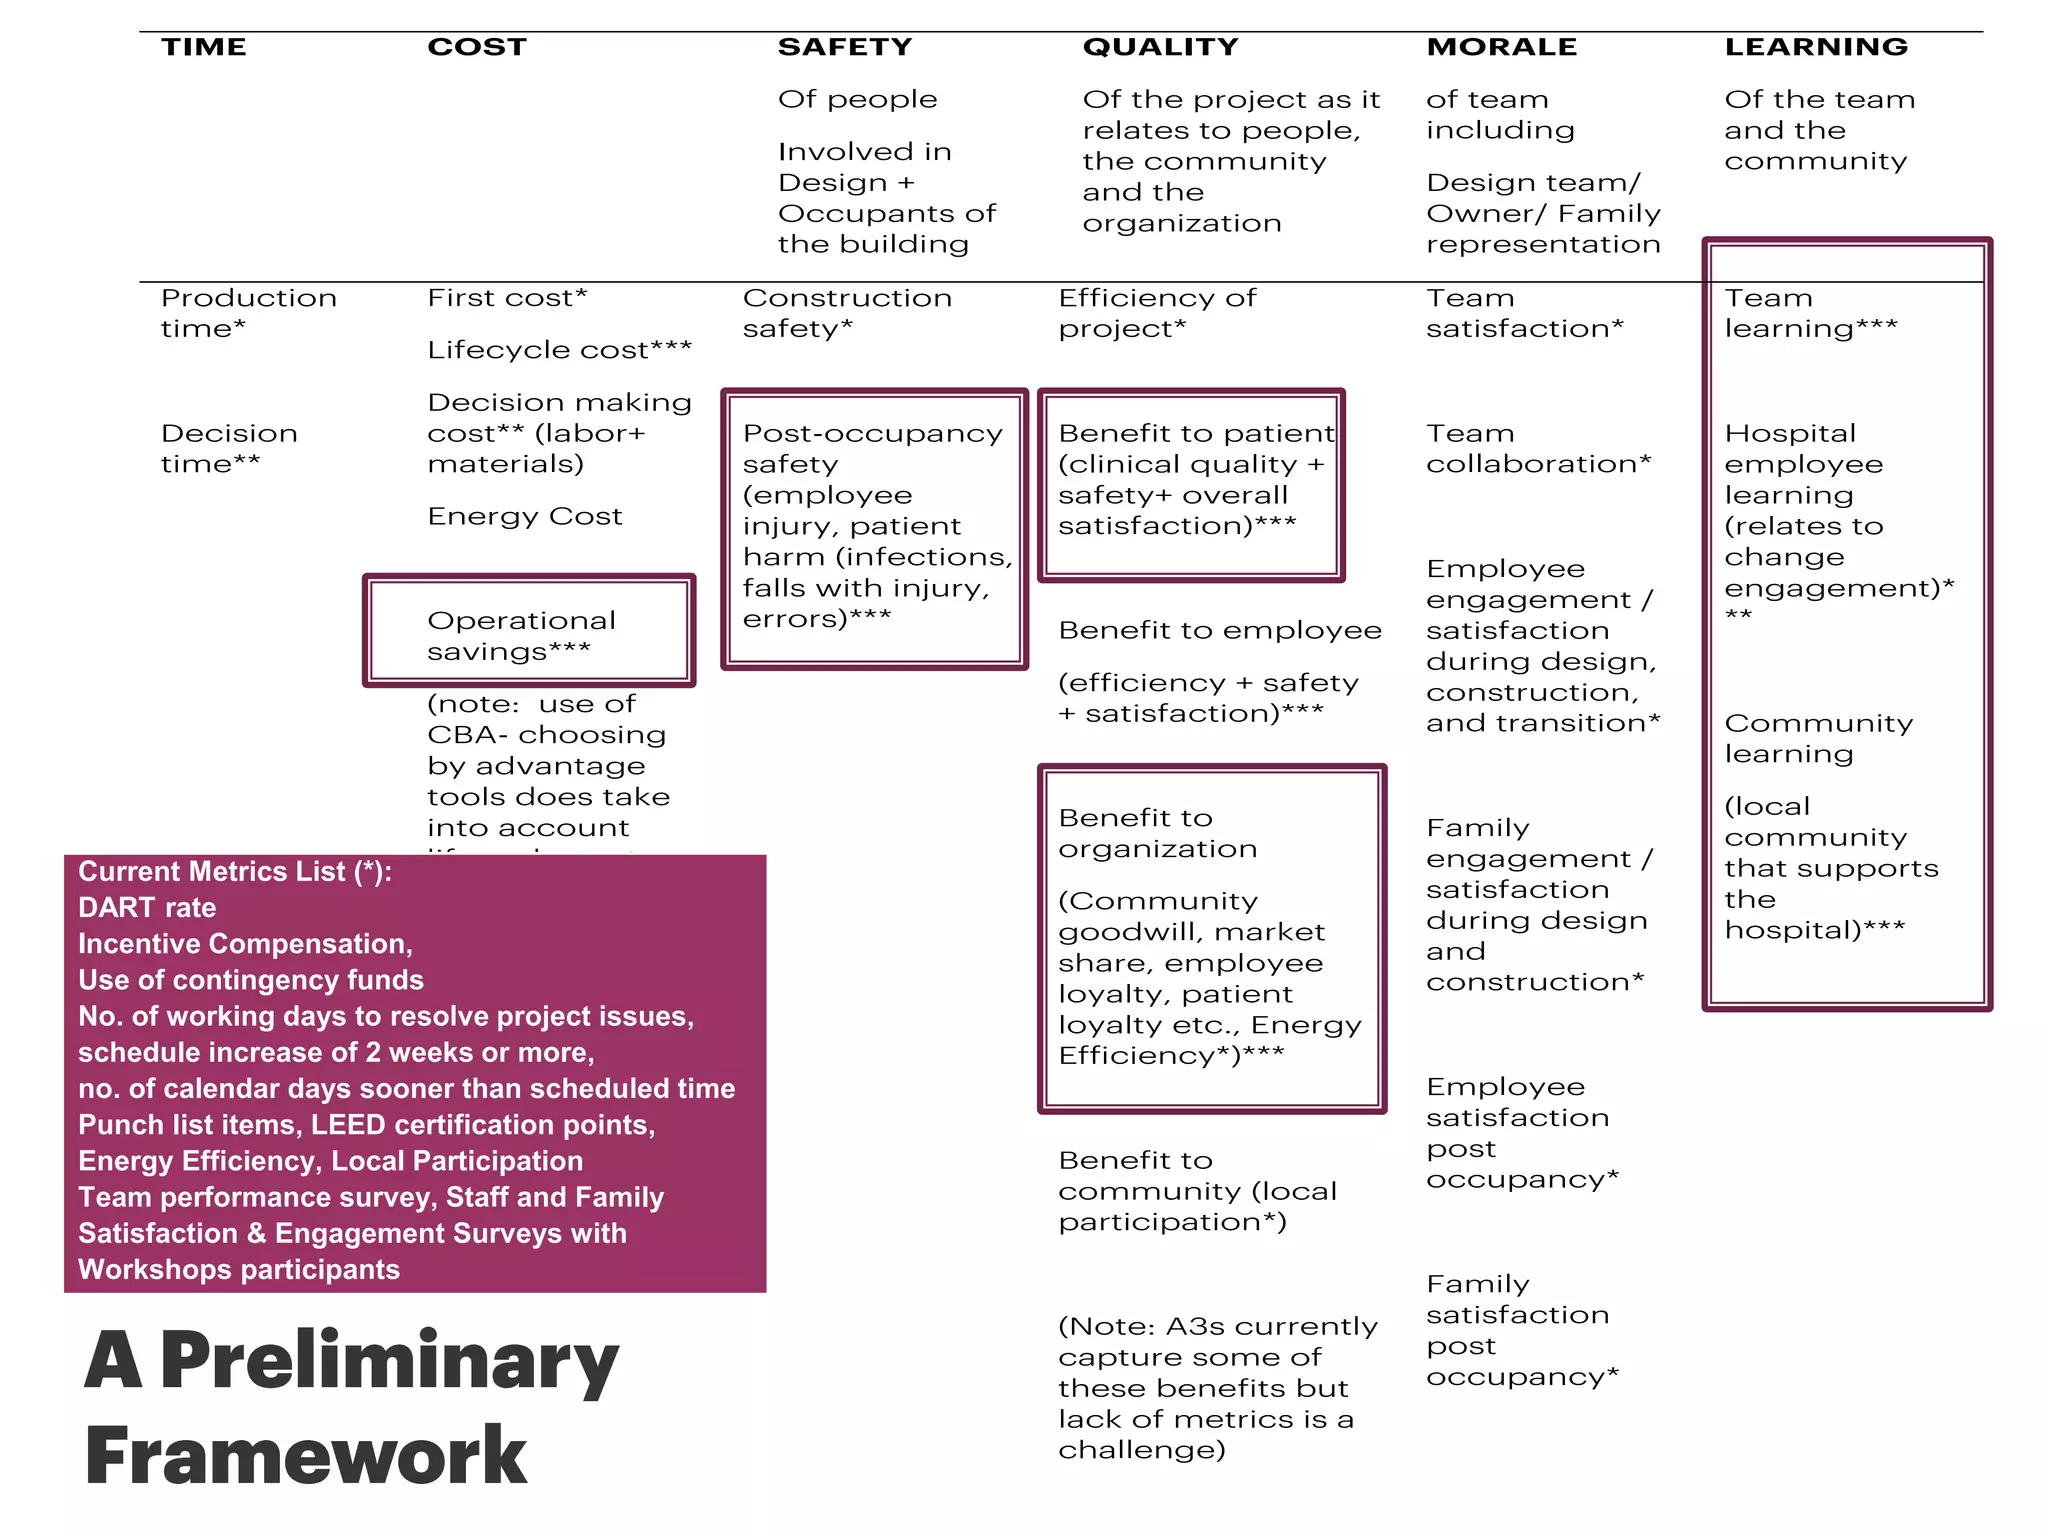


The document discusses lessons learned from a study on applying lean thinking and integrated project delivery (IPD) to healthcare construction projects. It found that full-scale mockups were the most effective lean strategy. It also found that learning was an important implicit benefit not tracked. While IPD led to benefits like collaboration, some challenges included perceived imbalance of influence and optimal use of lean strategies. To fully evaluate the costs and benefits of lean-IPD approaches, factors like time costs for additional participation and documentation need to be accounted for.


![[BROCHURE] Italy Tour Project | @SlideON](https://cdn.slidesharecdn.com/ss_thumbnails/brochure8-251215152319-2805af68-thumbnail.jpg?width=640&height=640&fit=bounds)


