Download to read offline


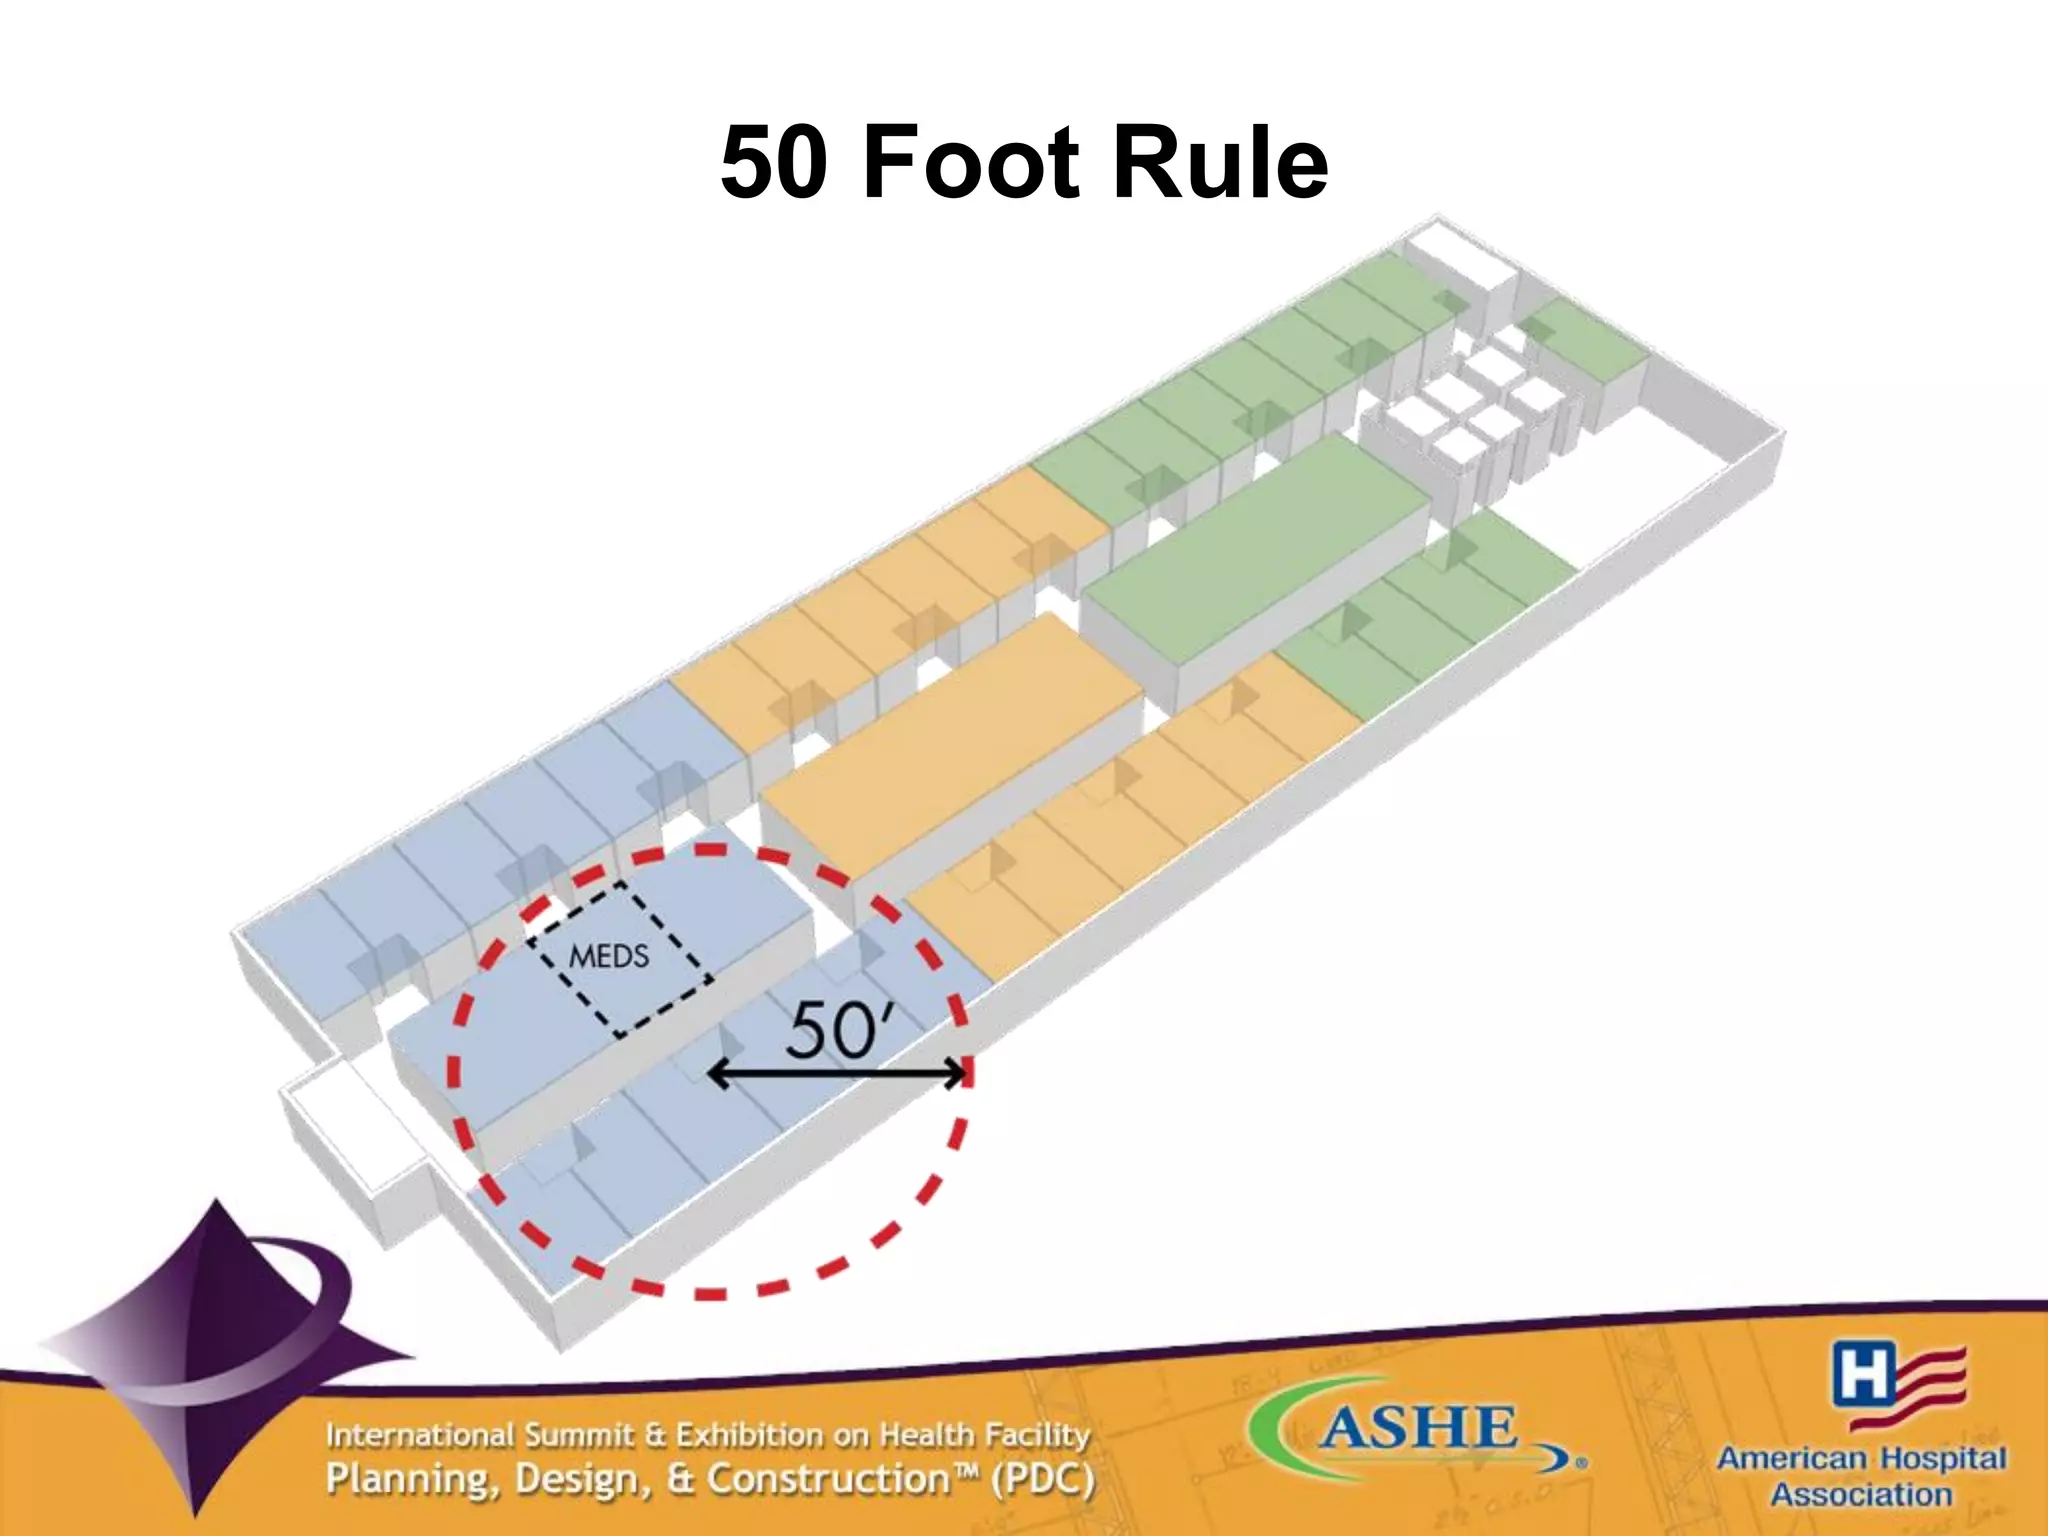


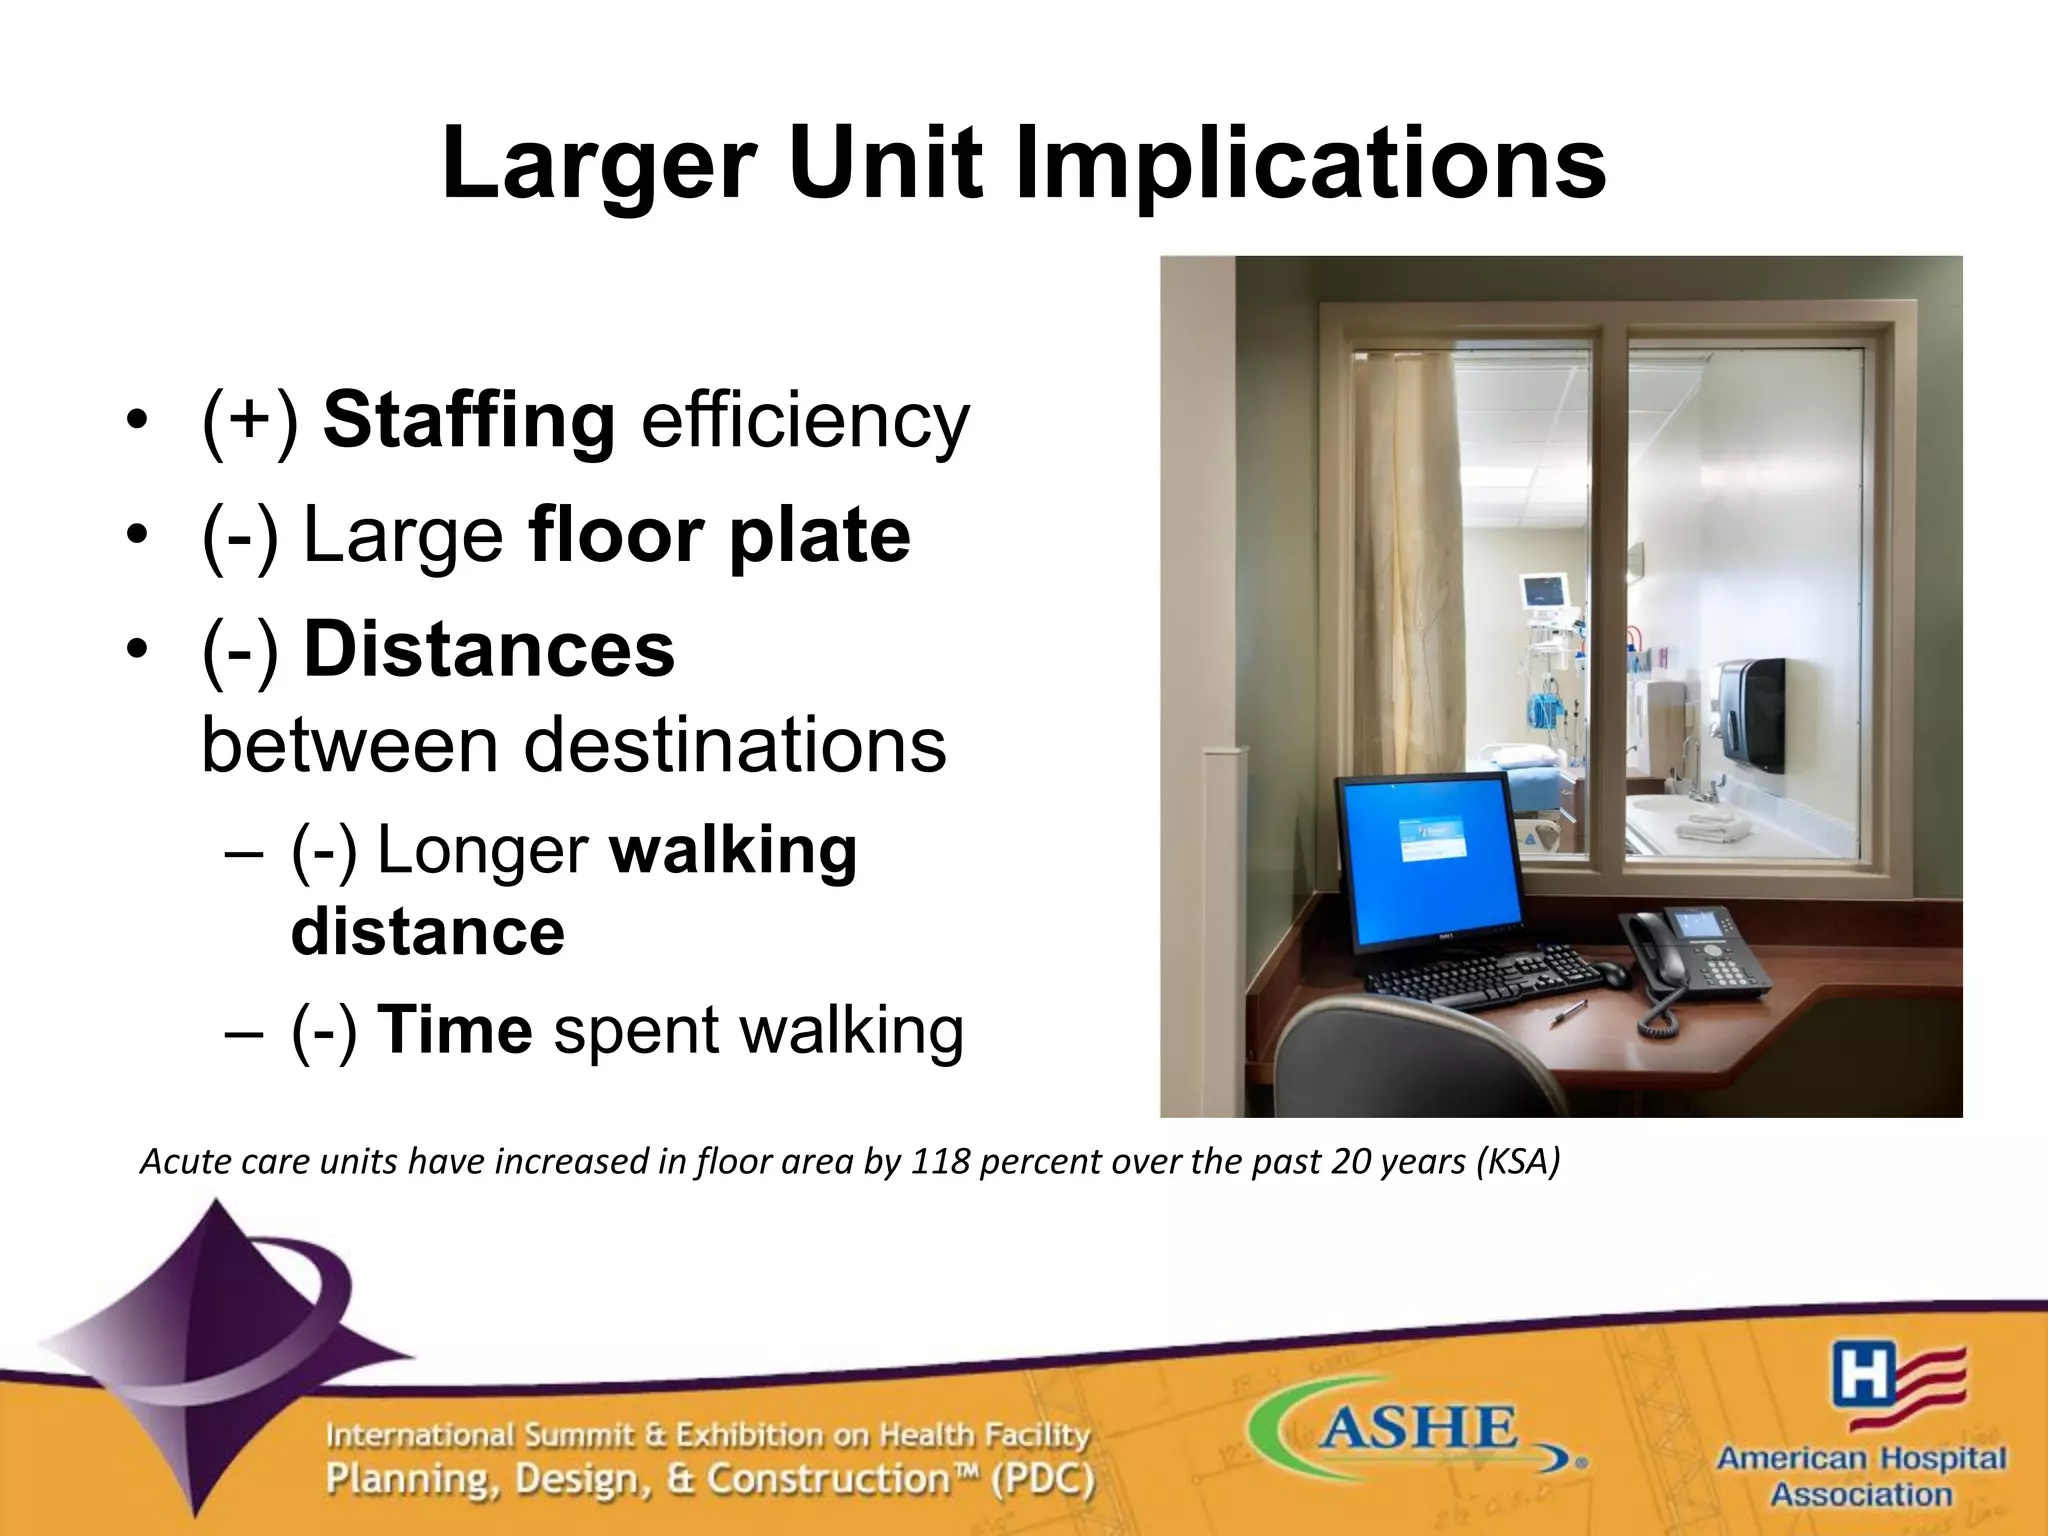
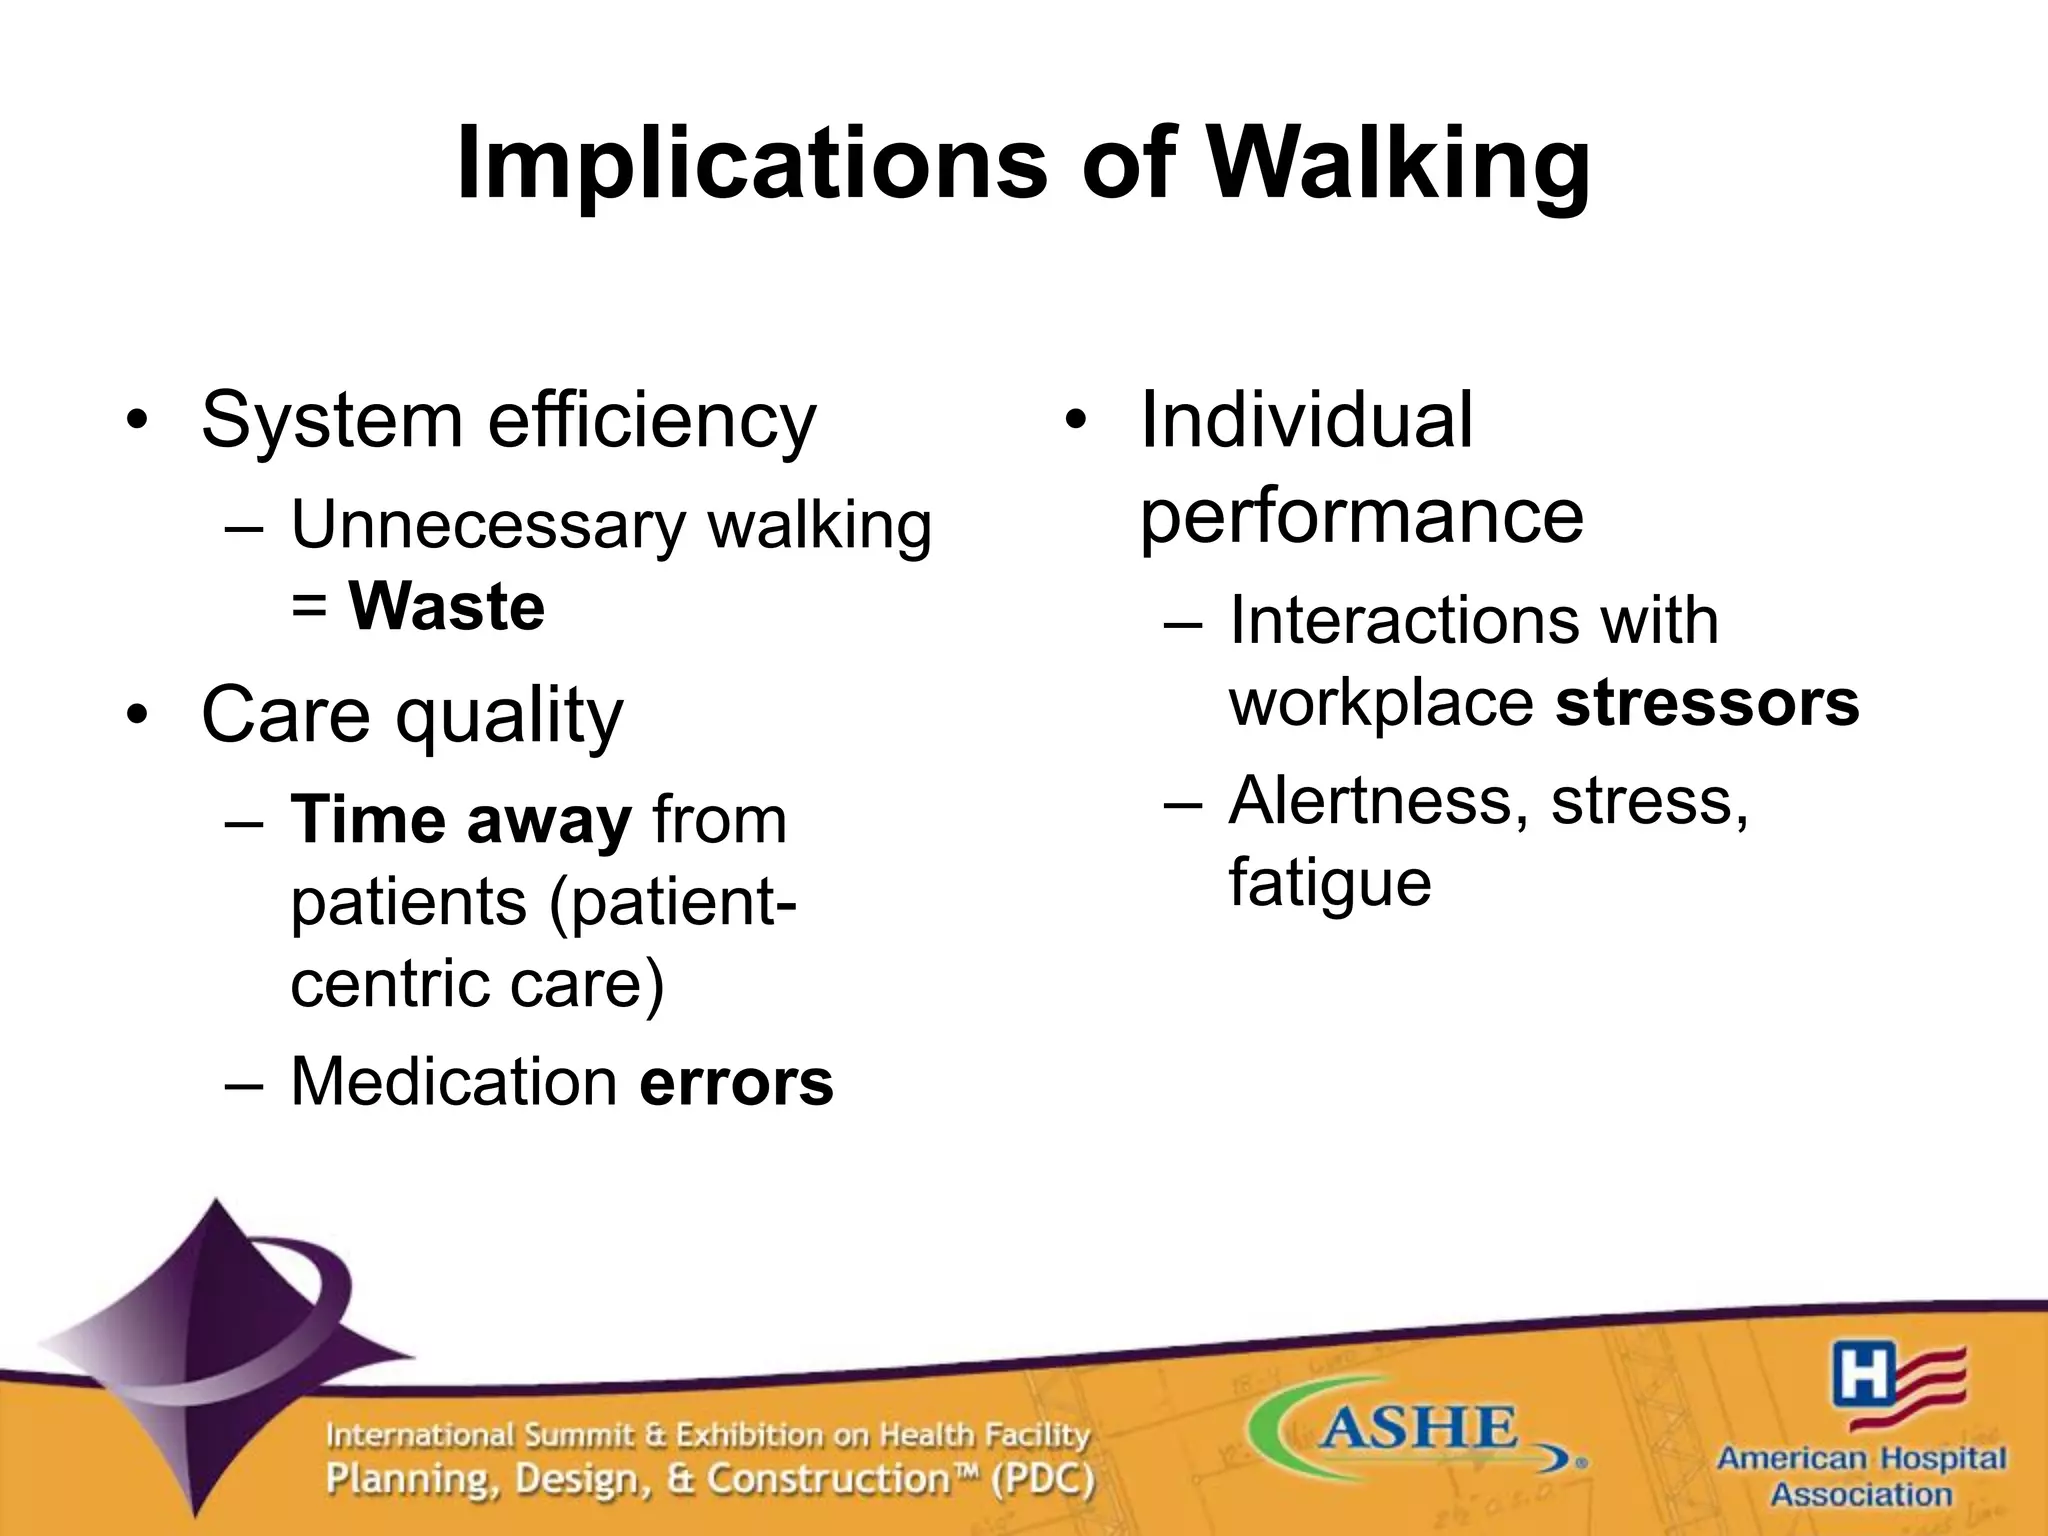

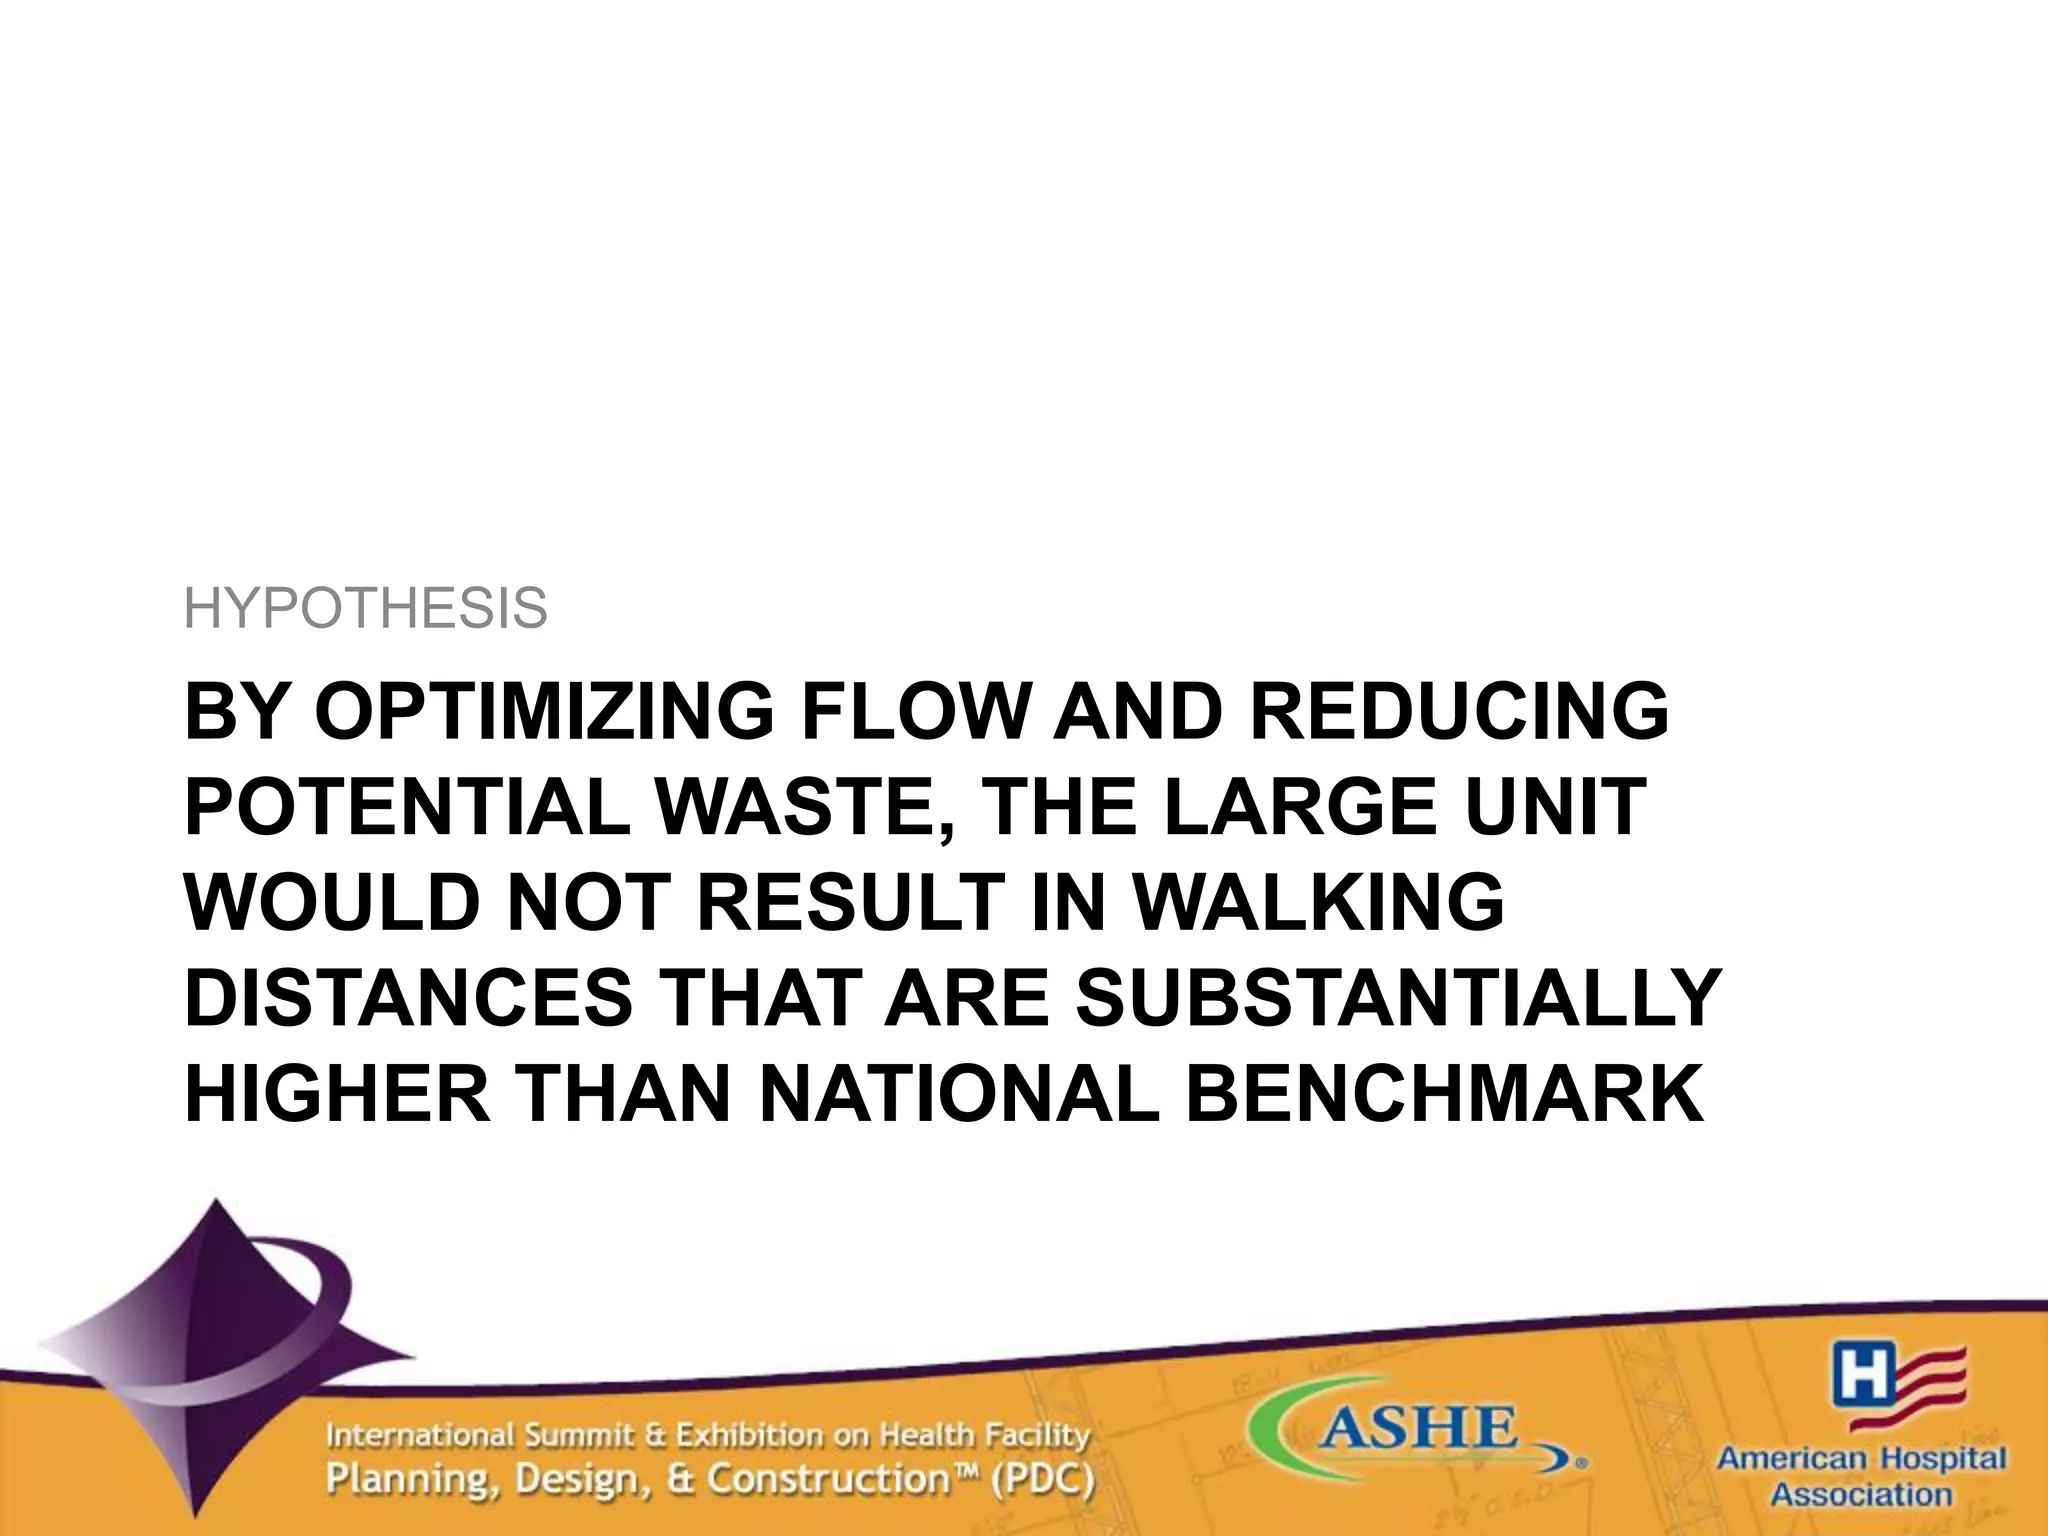

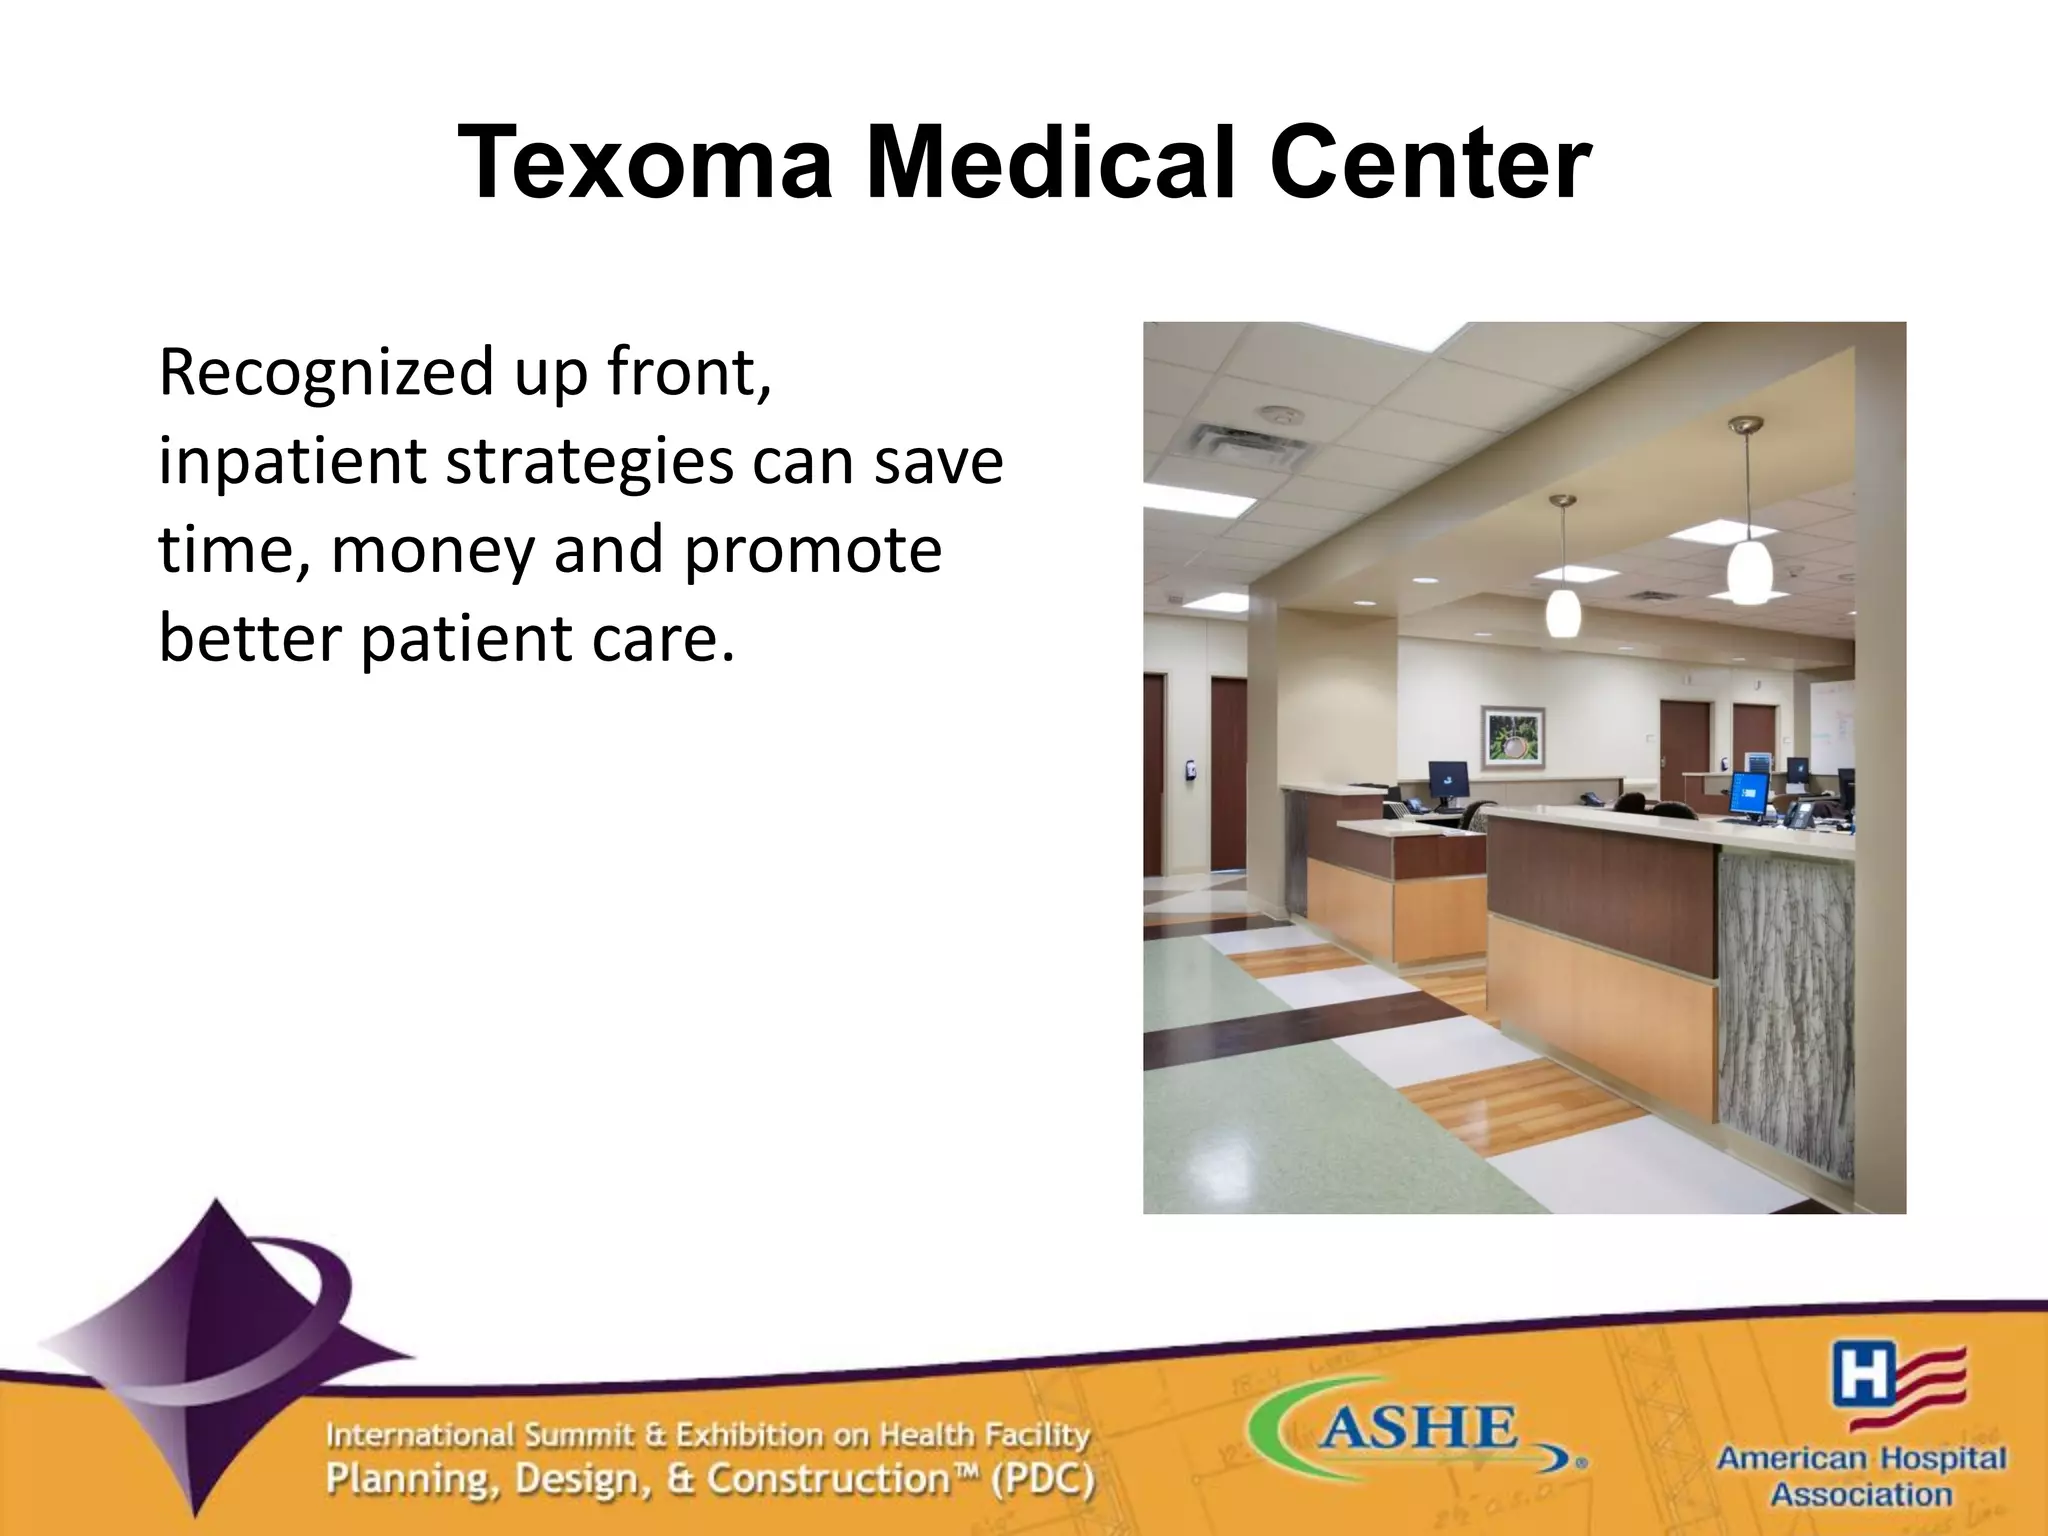
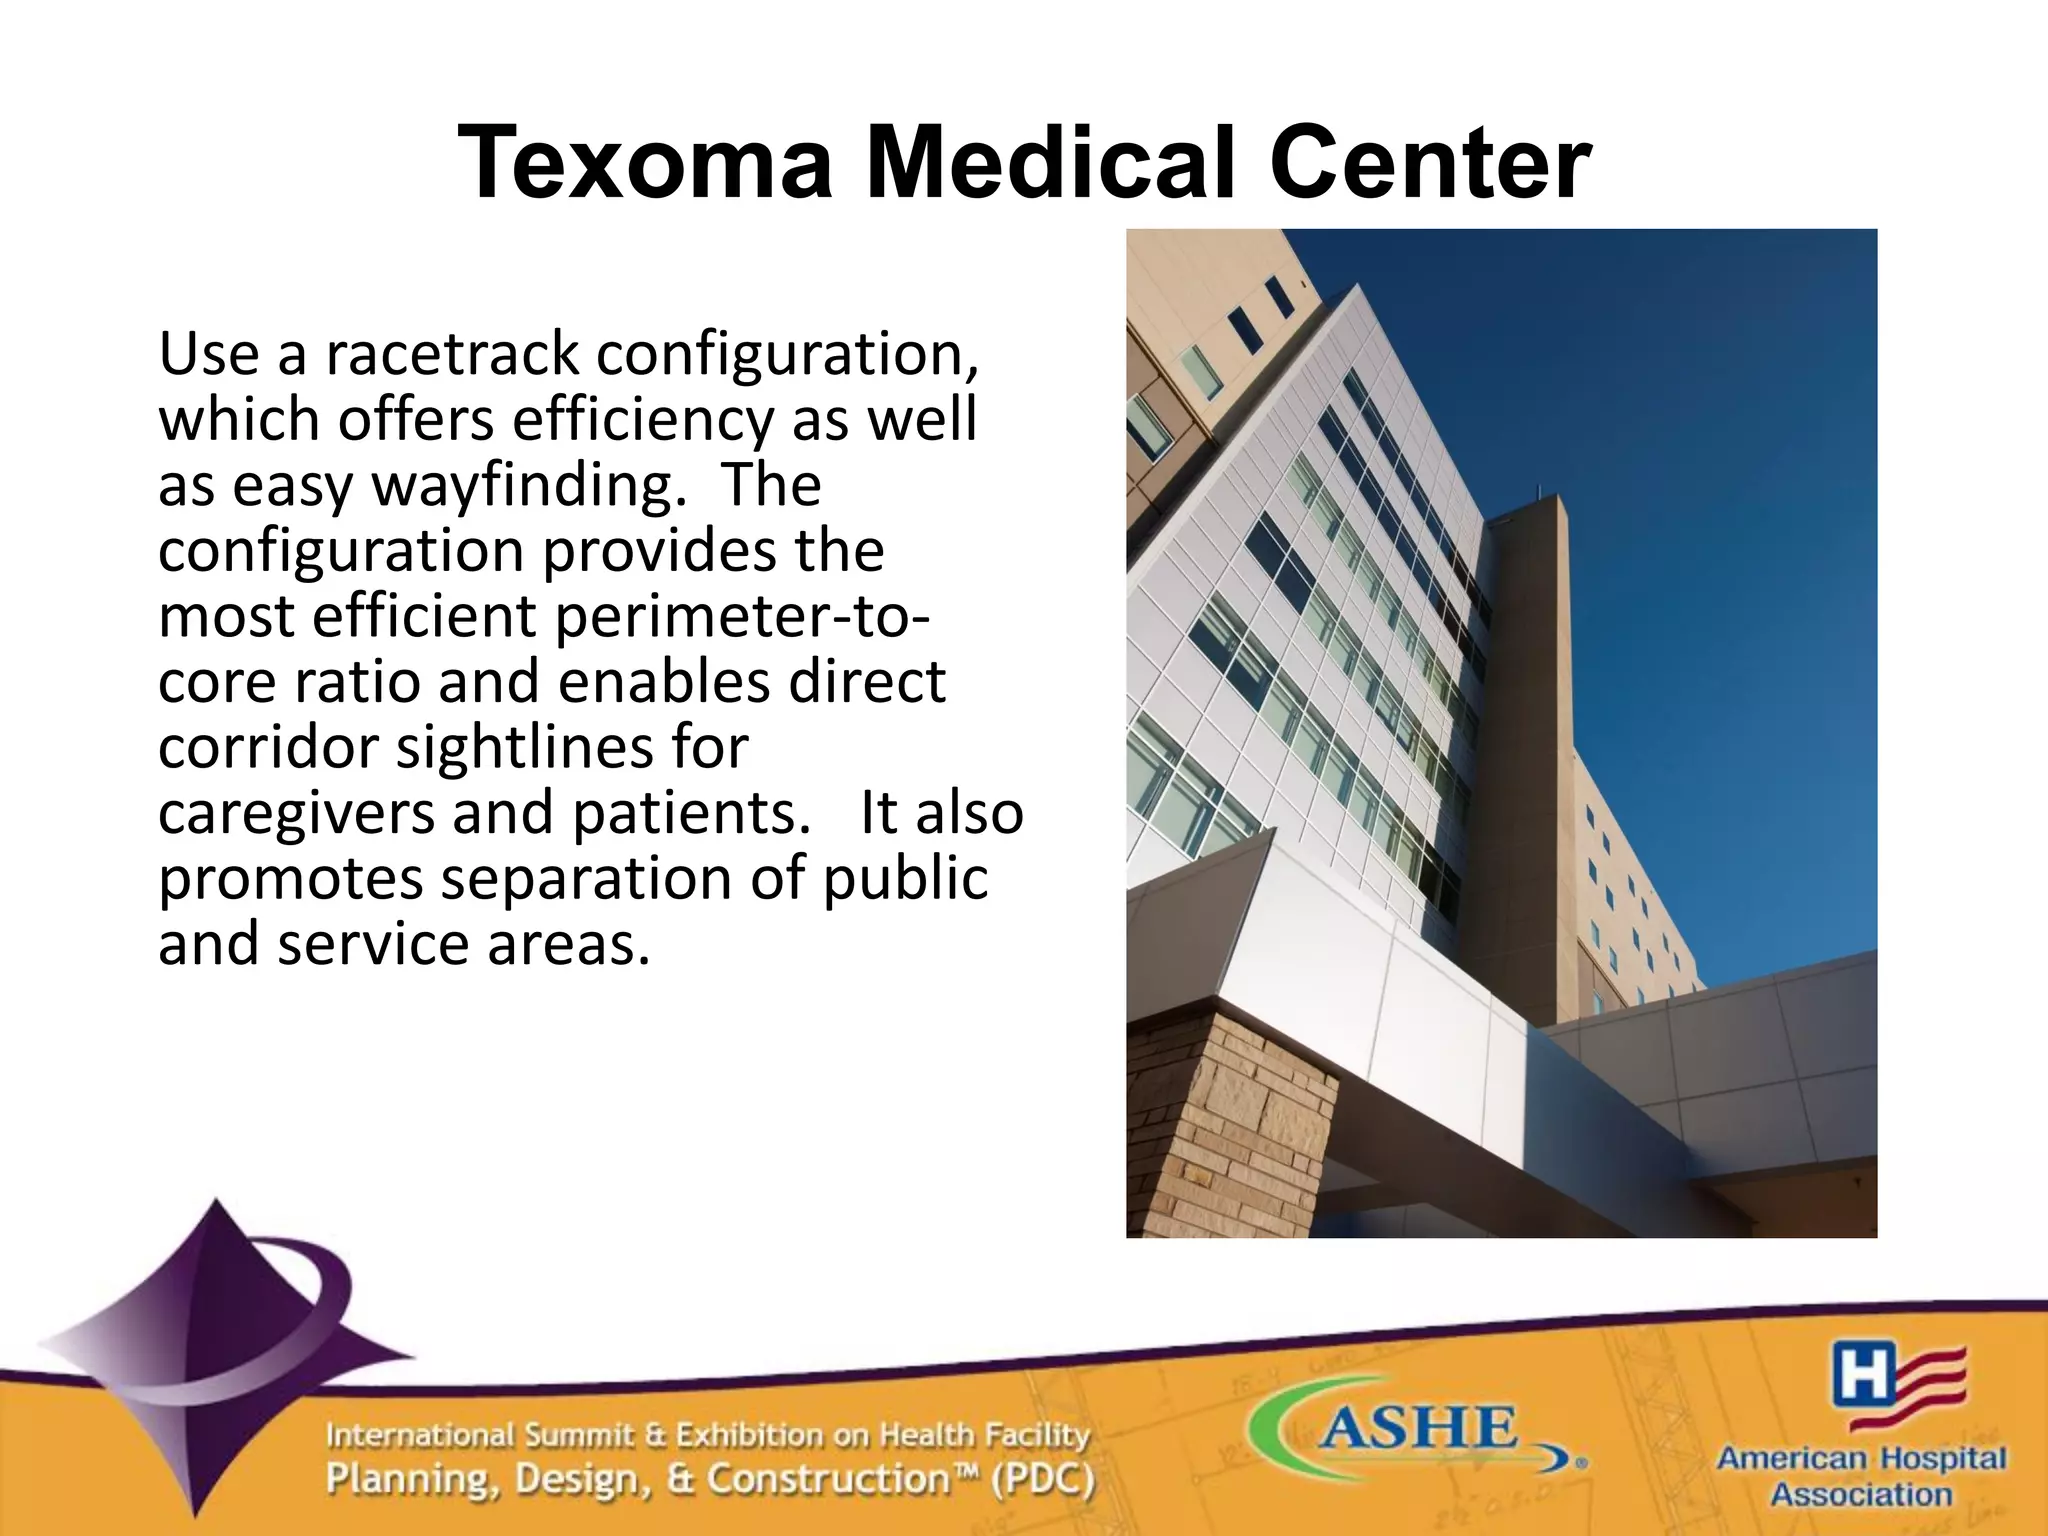
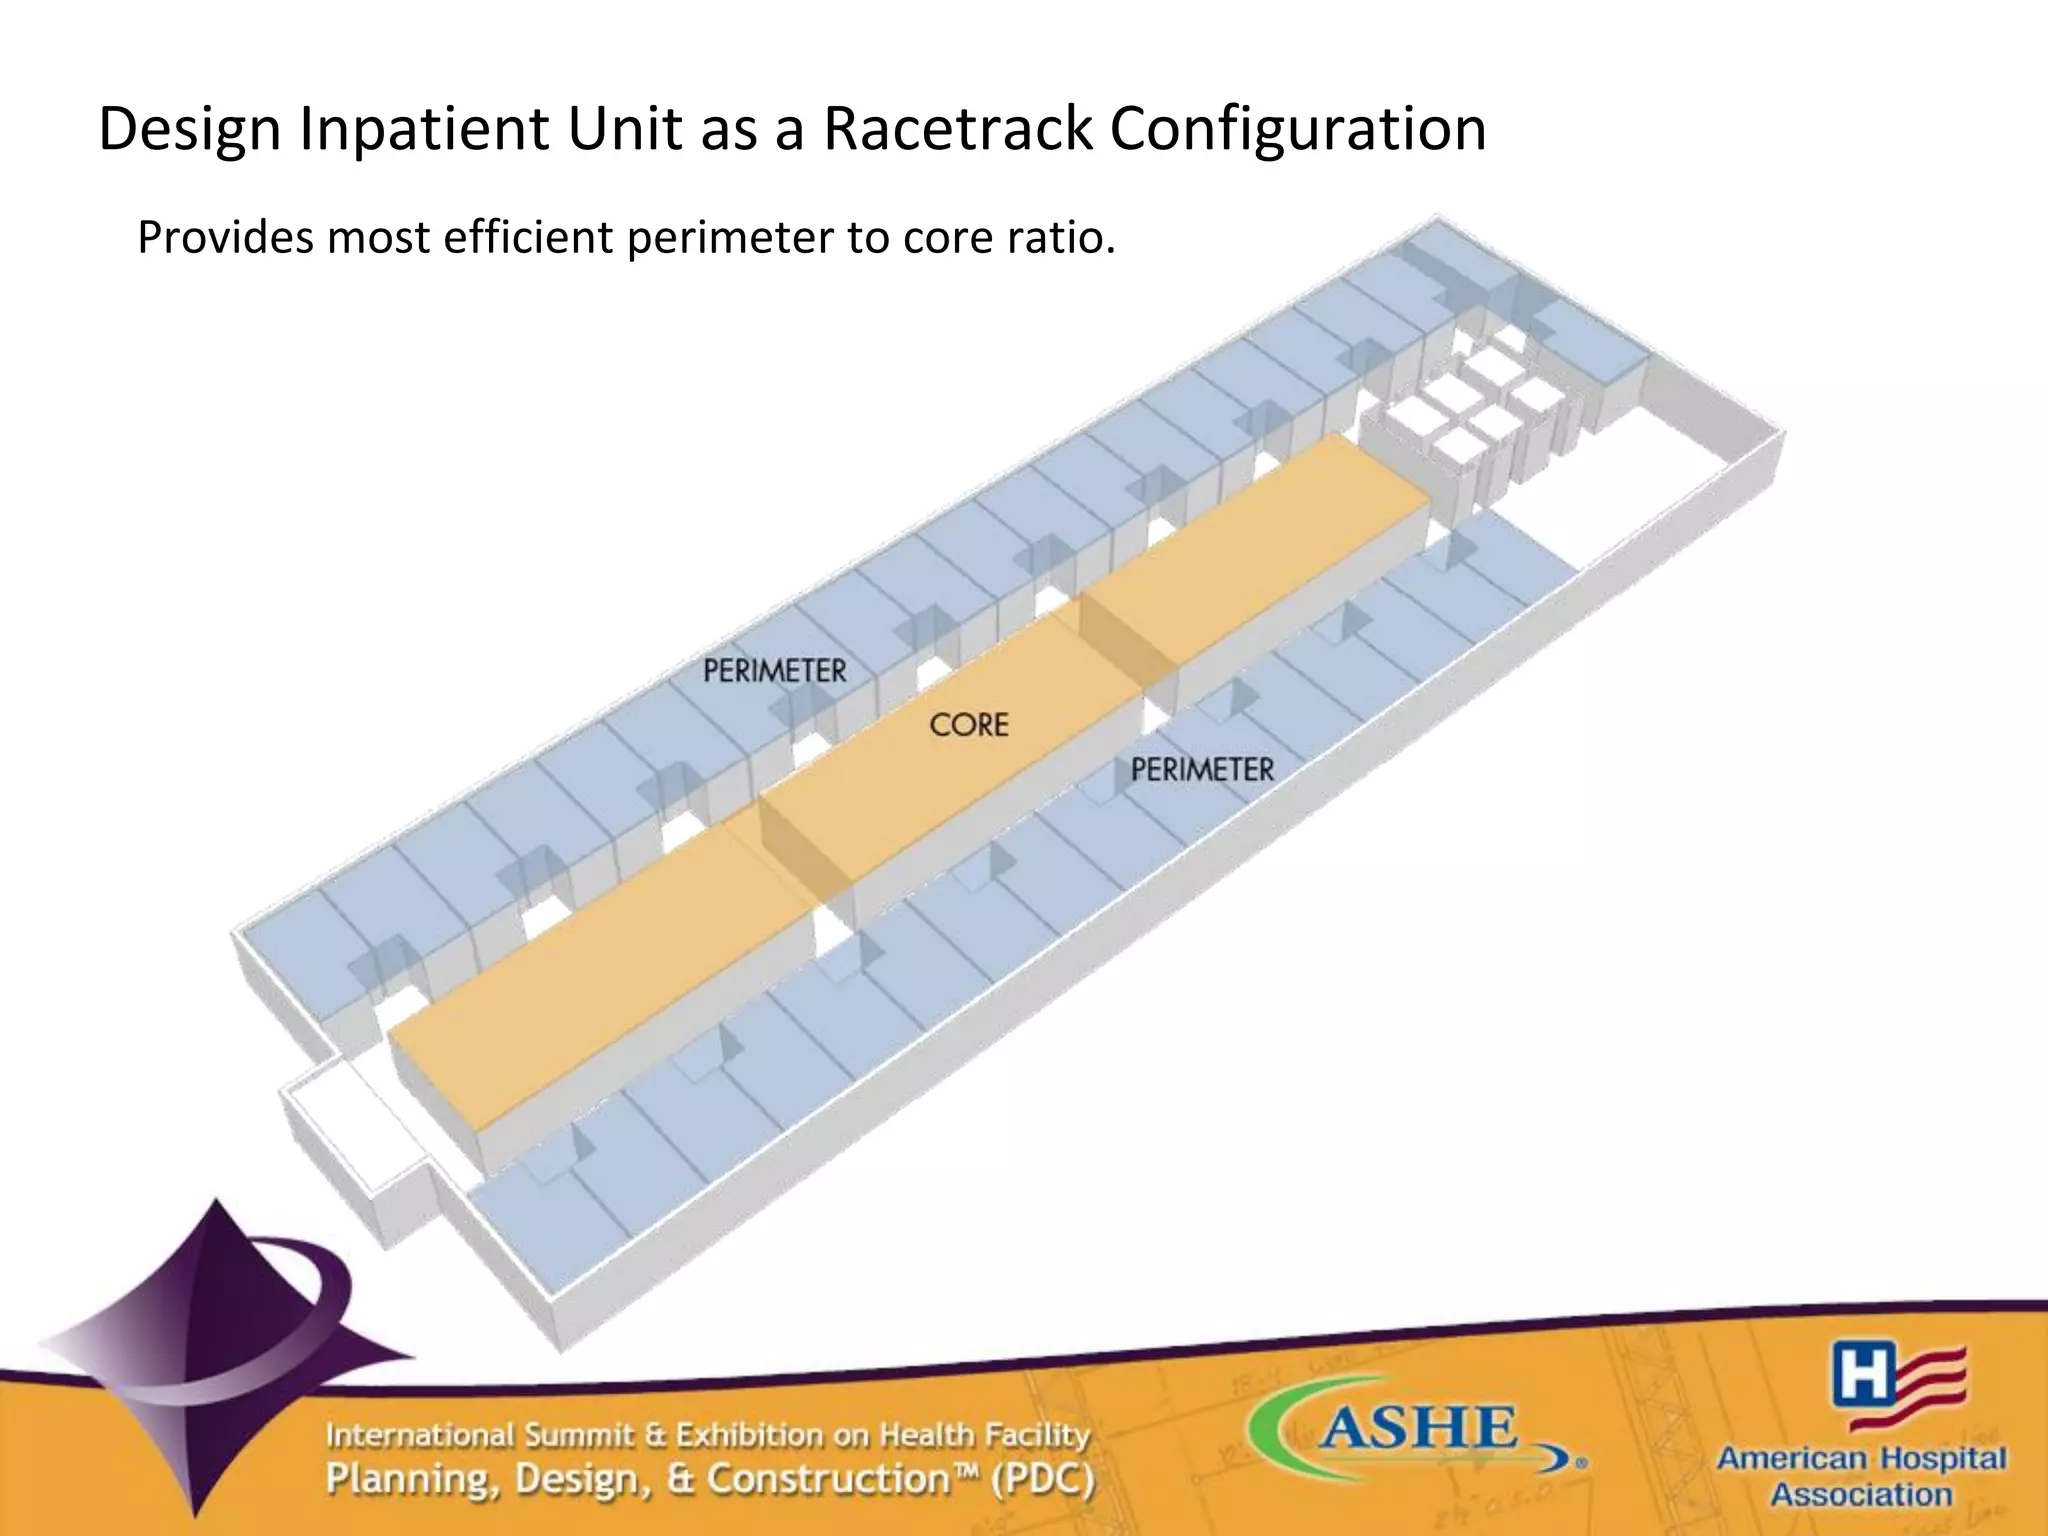
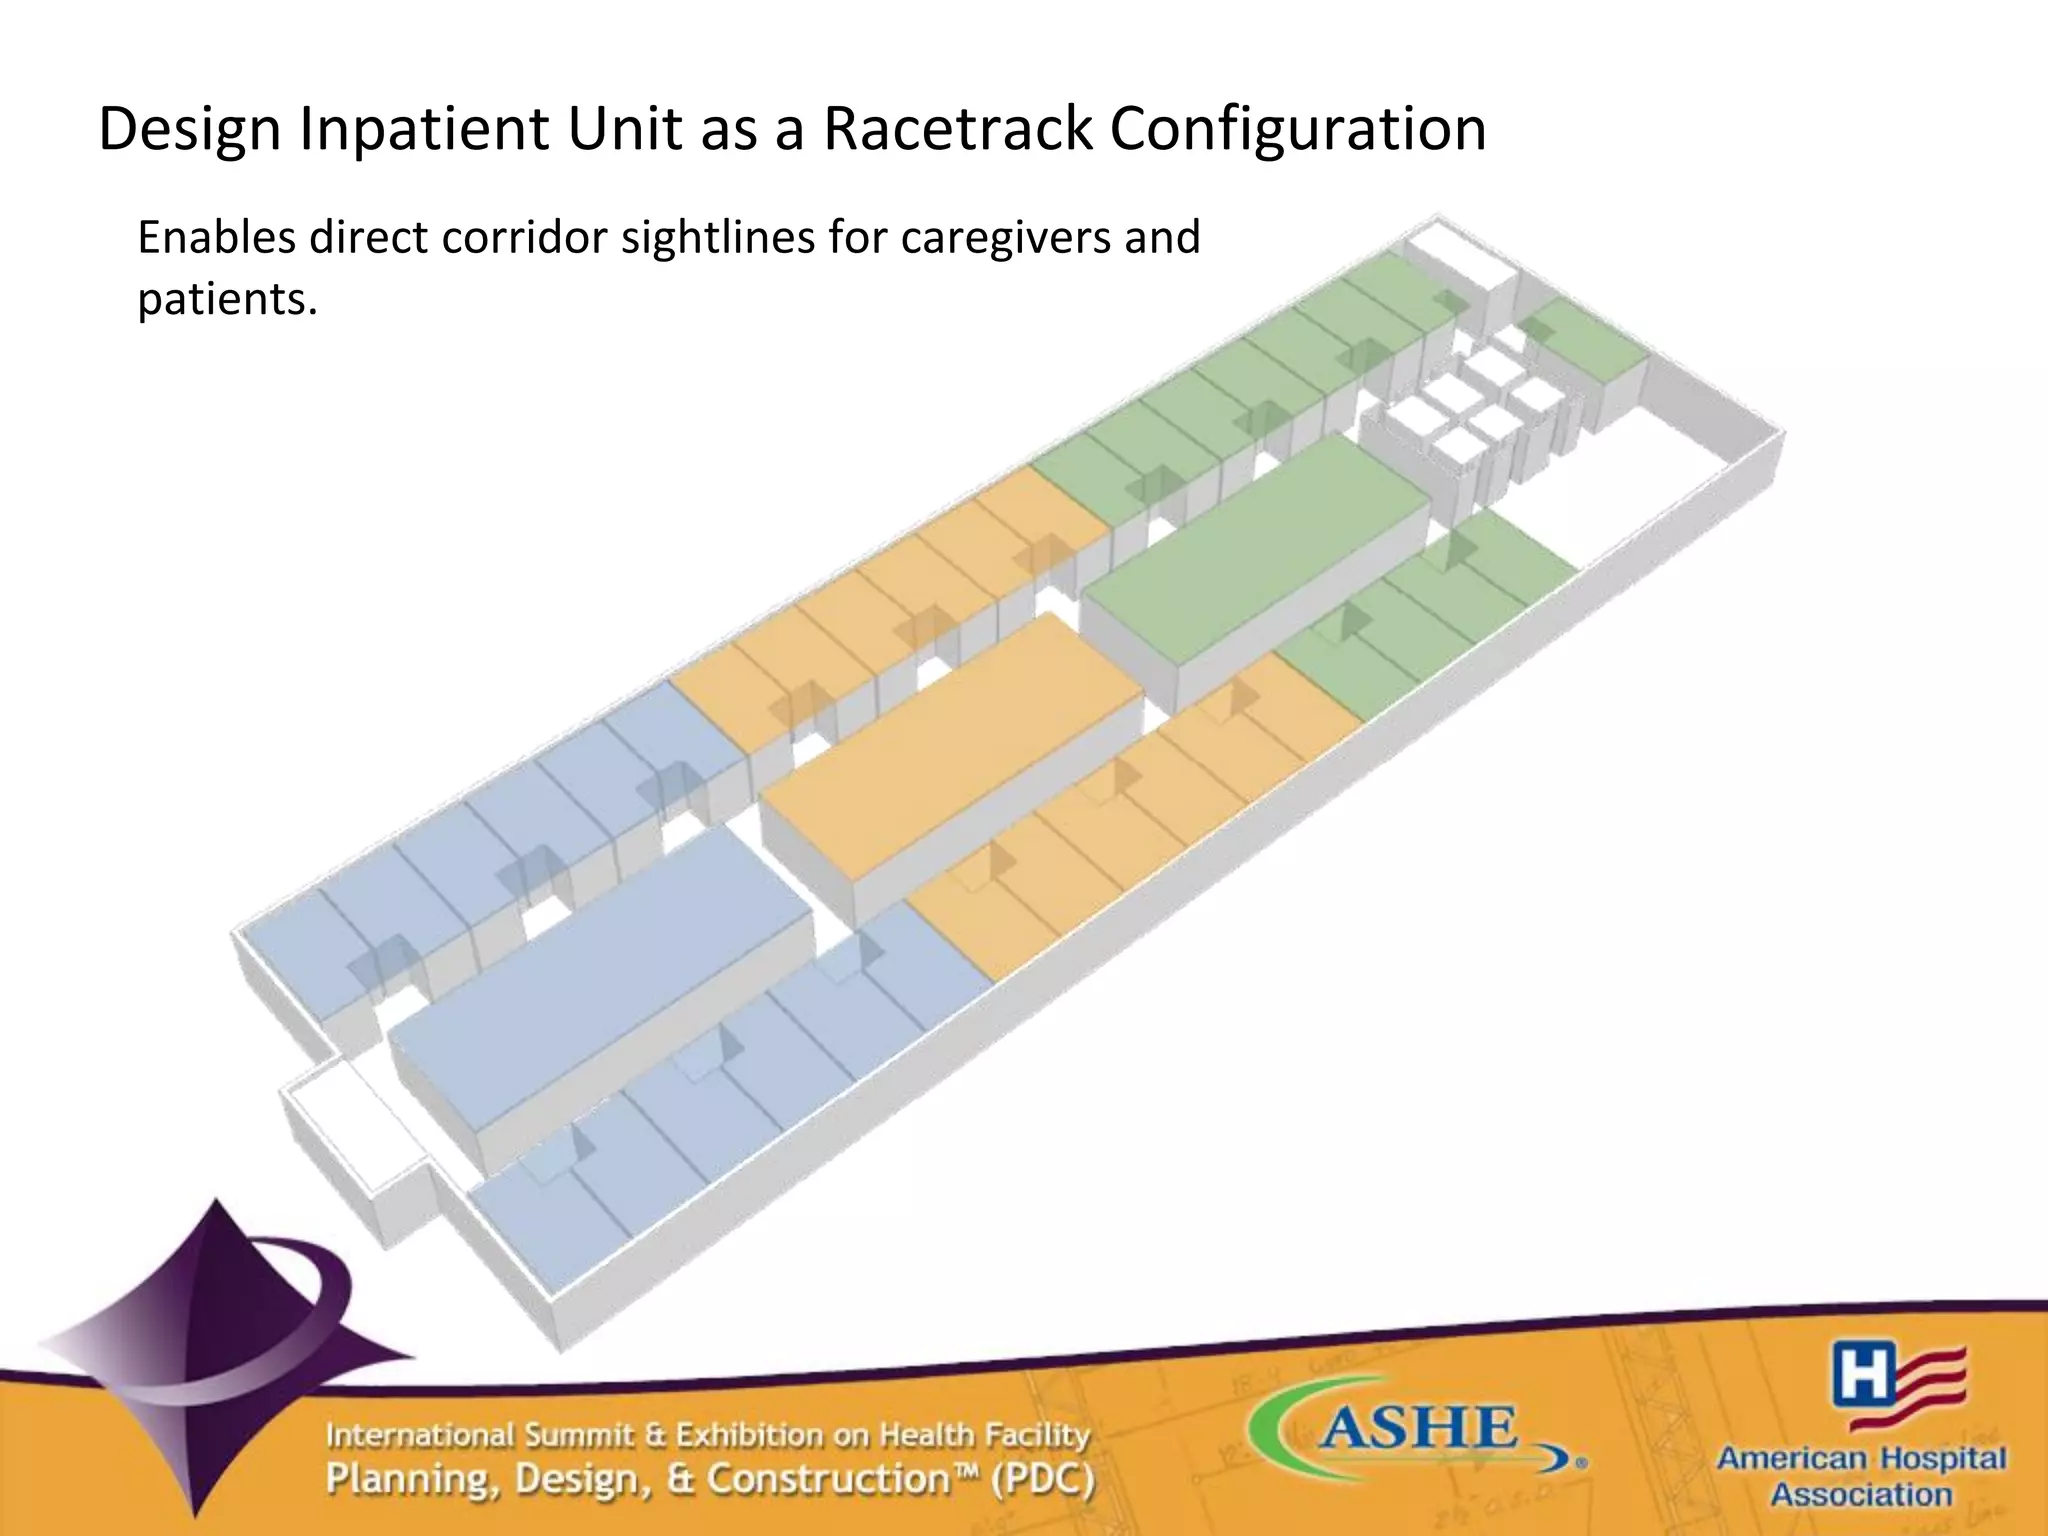
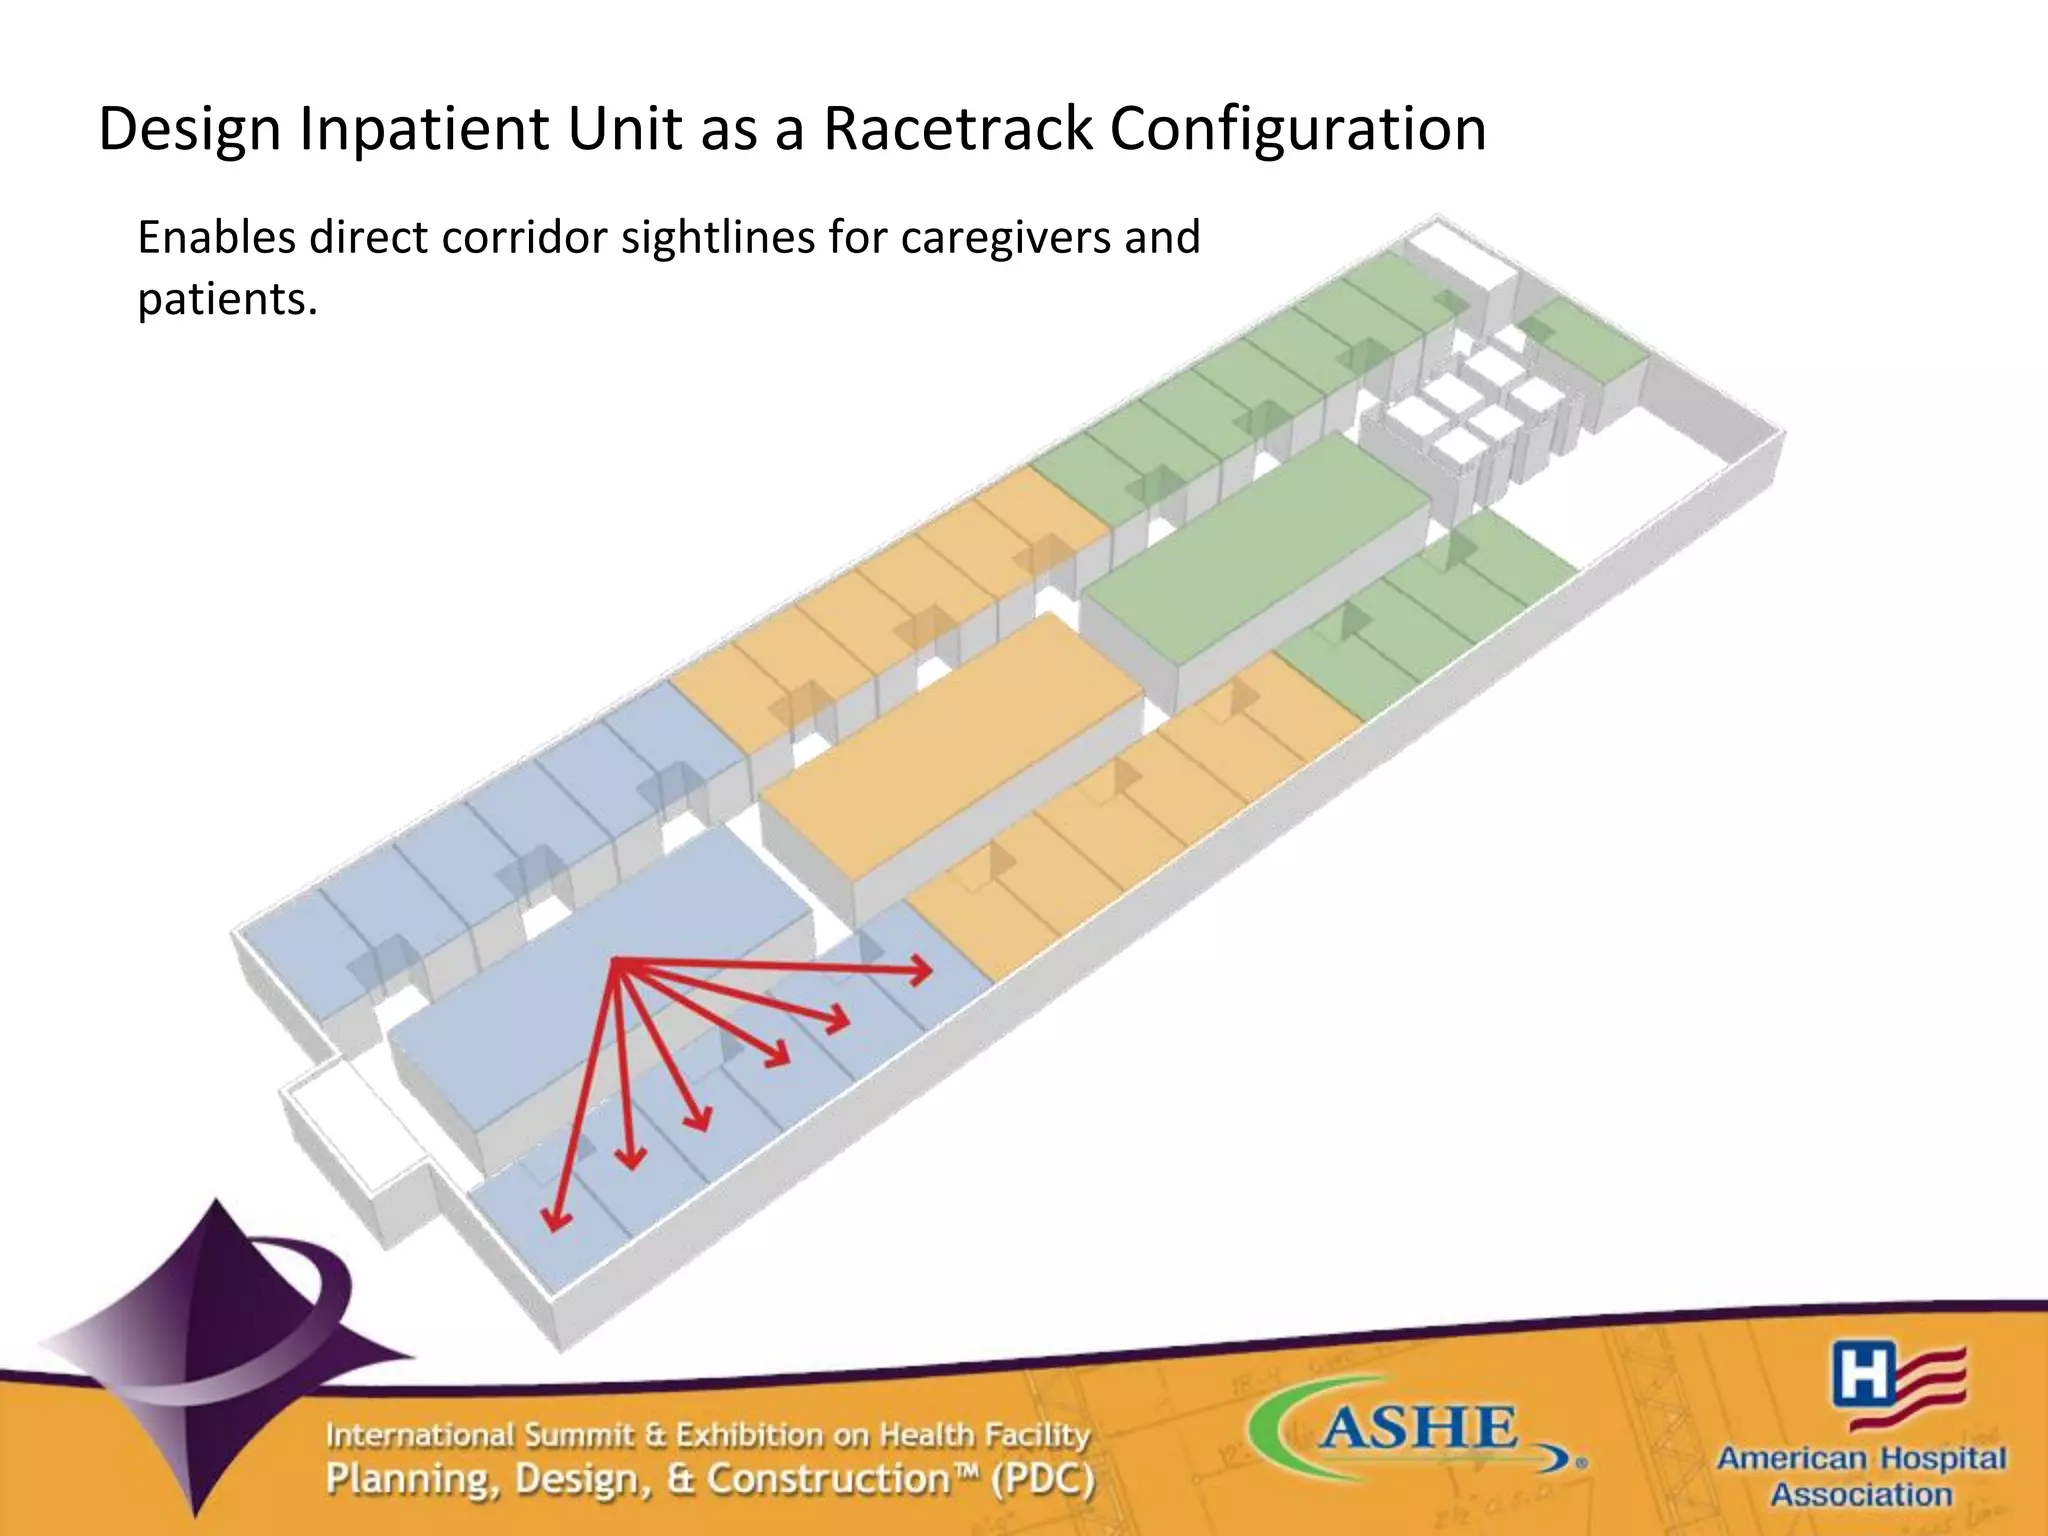
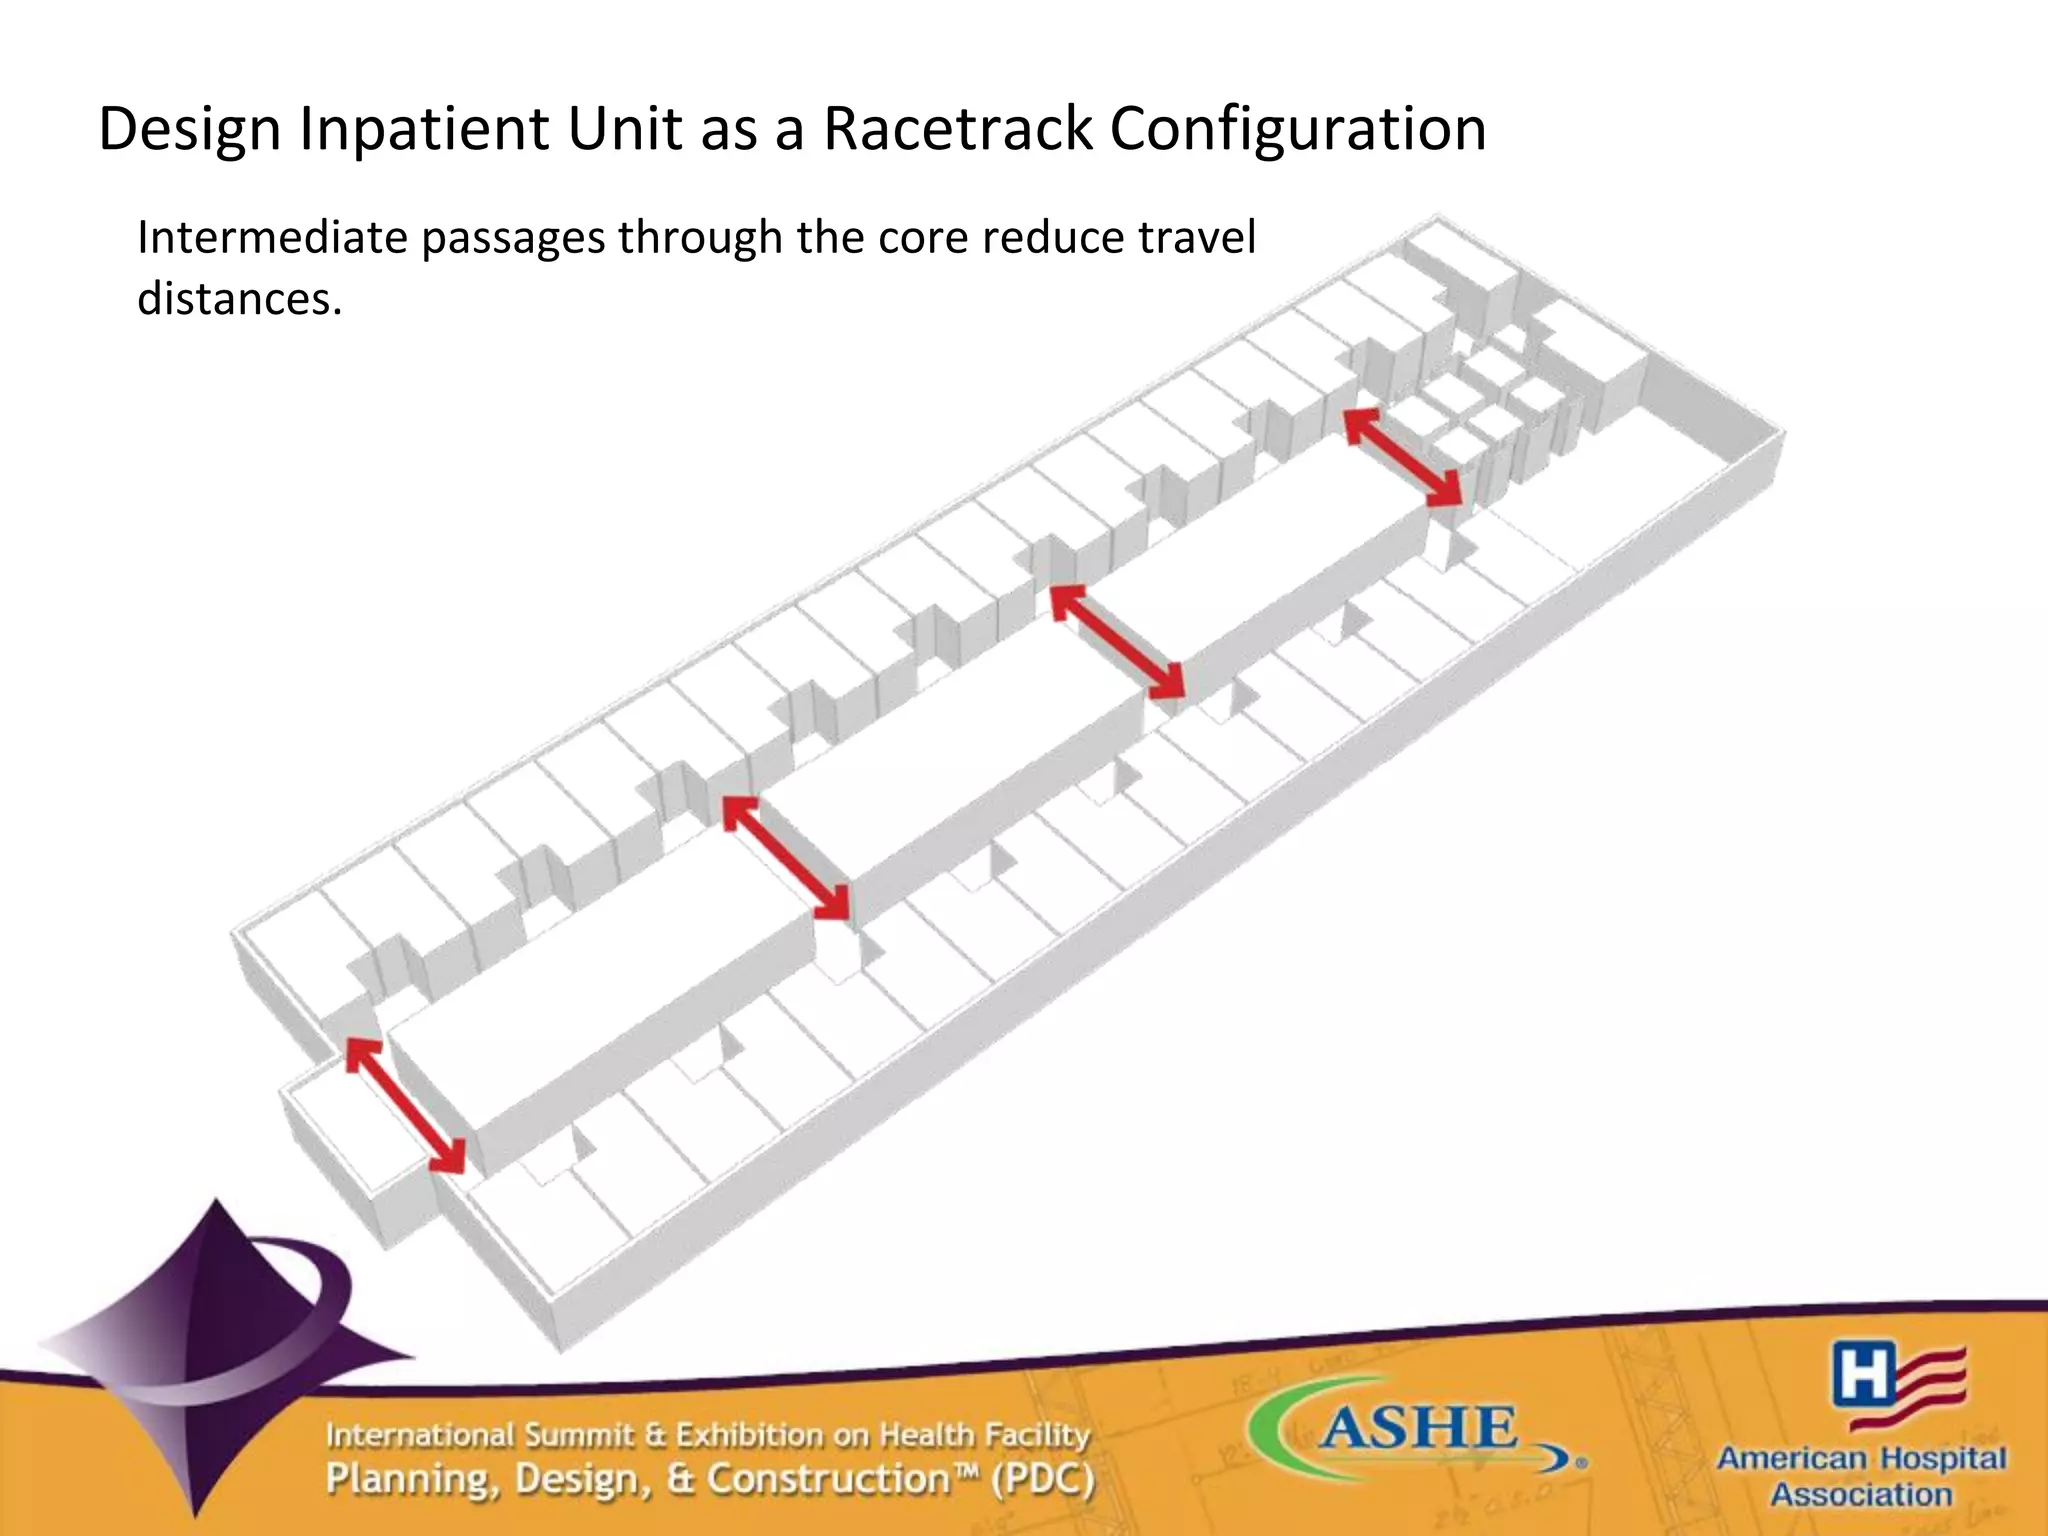
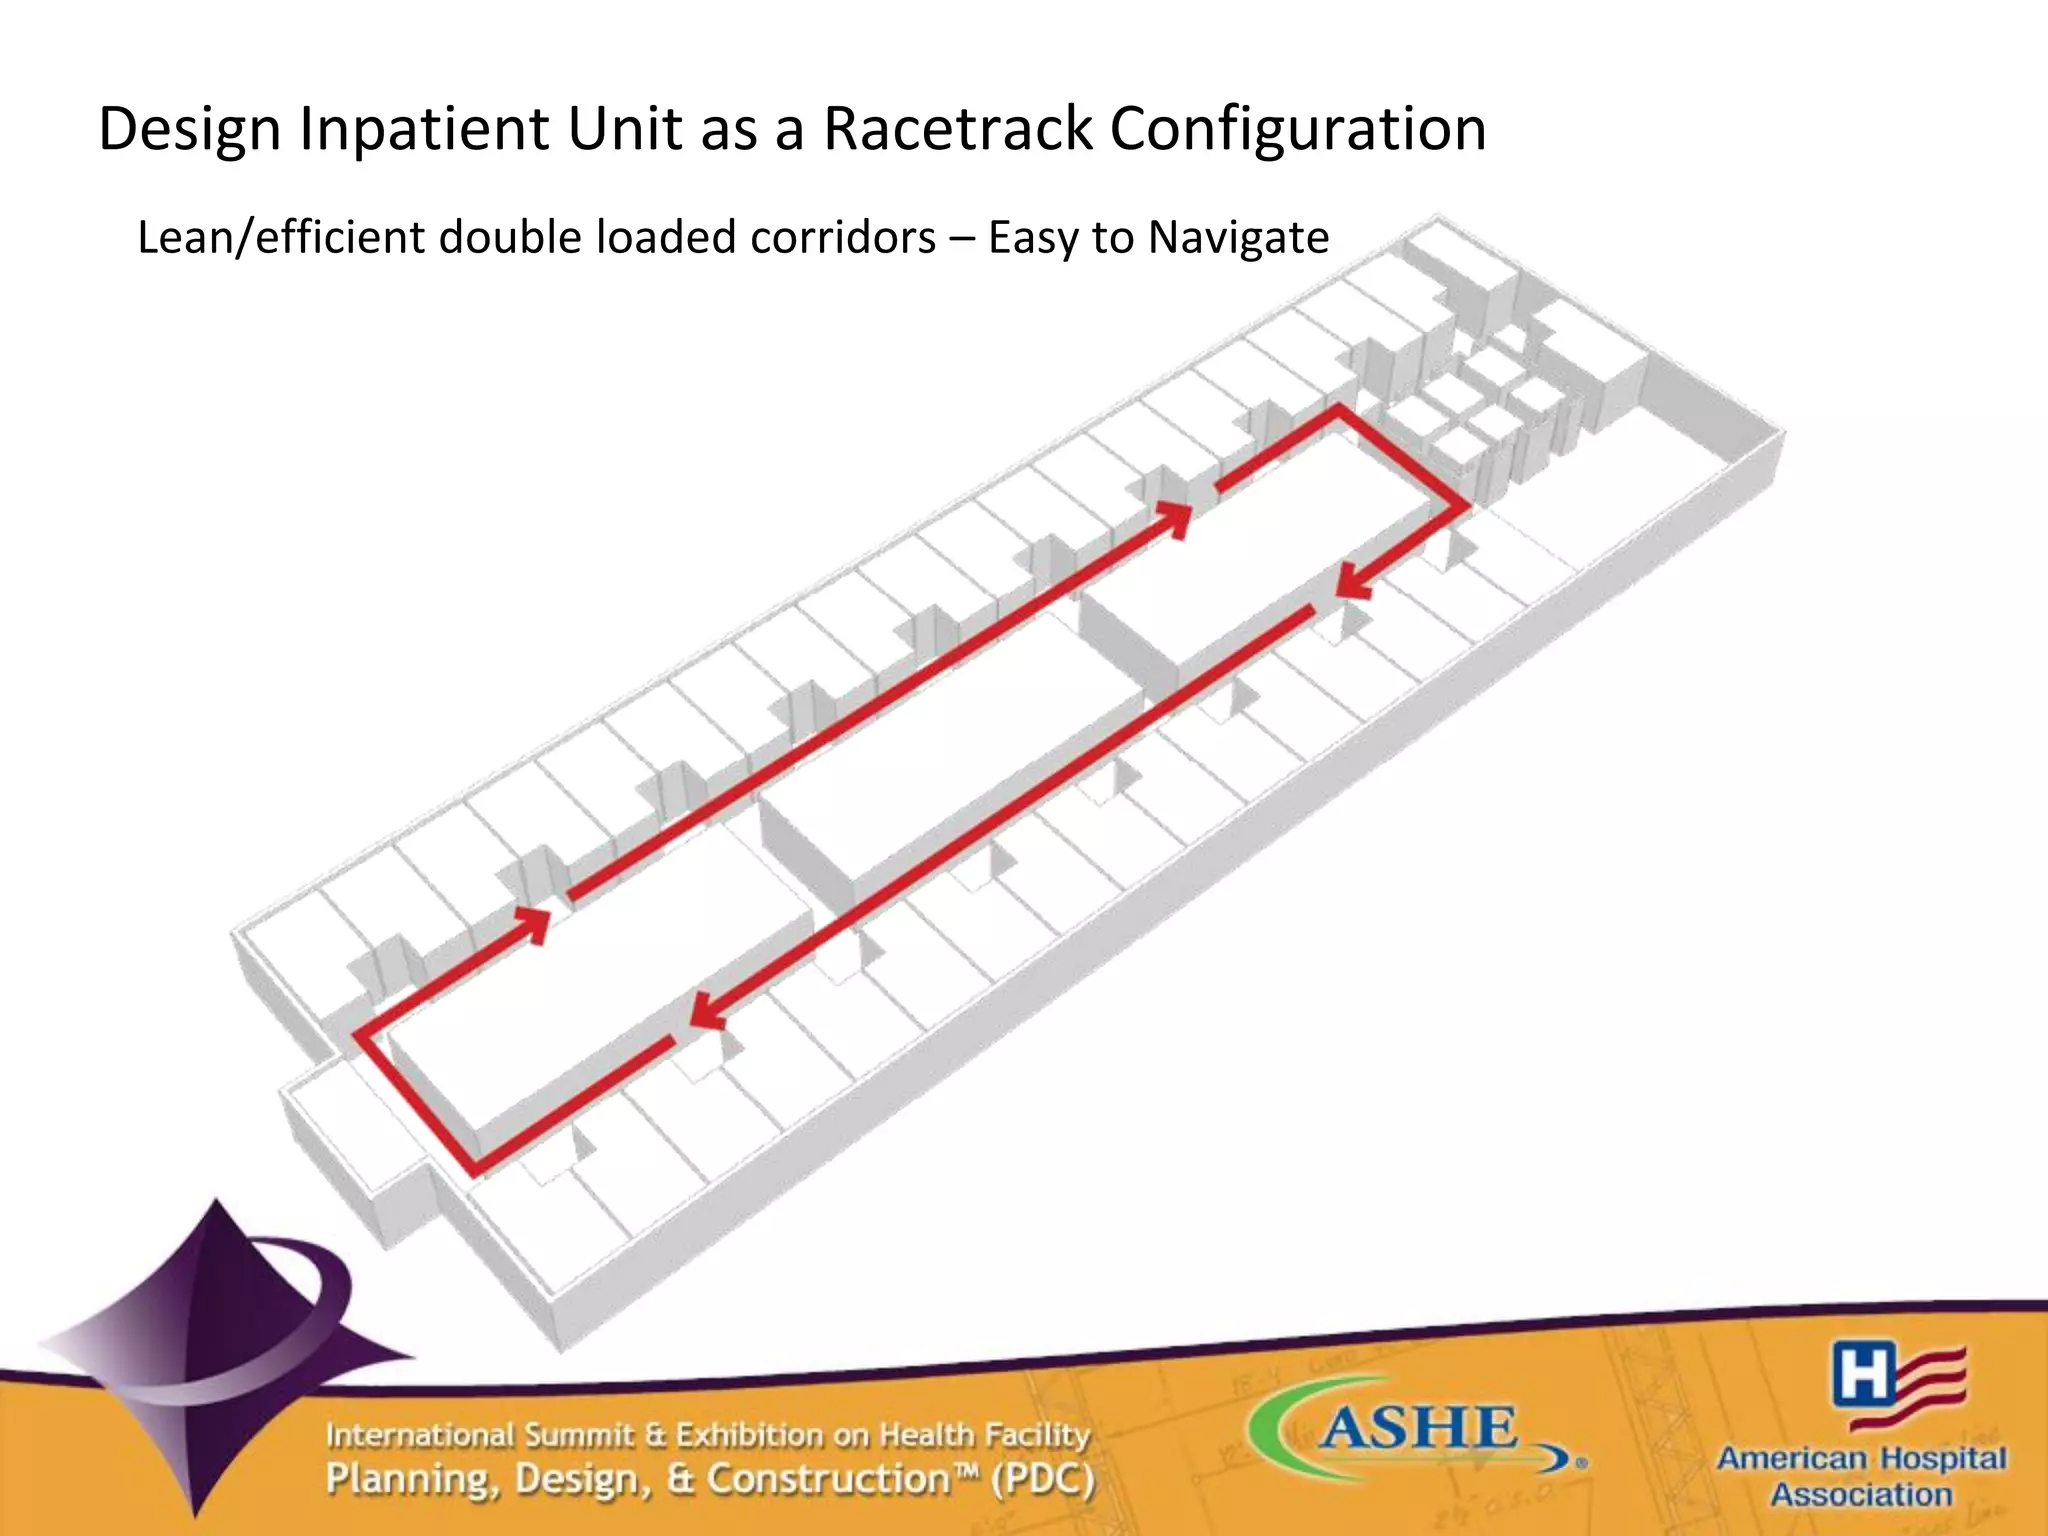
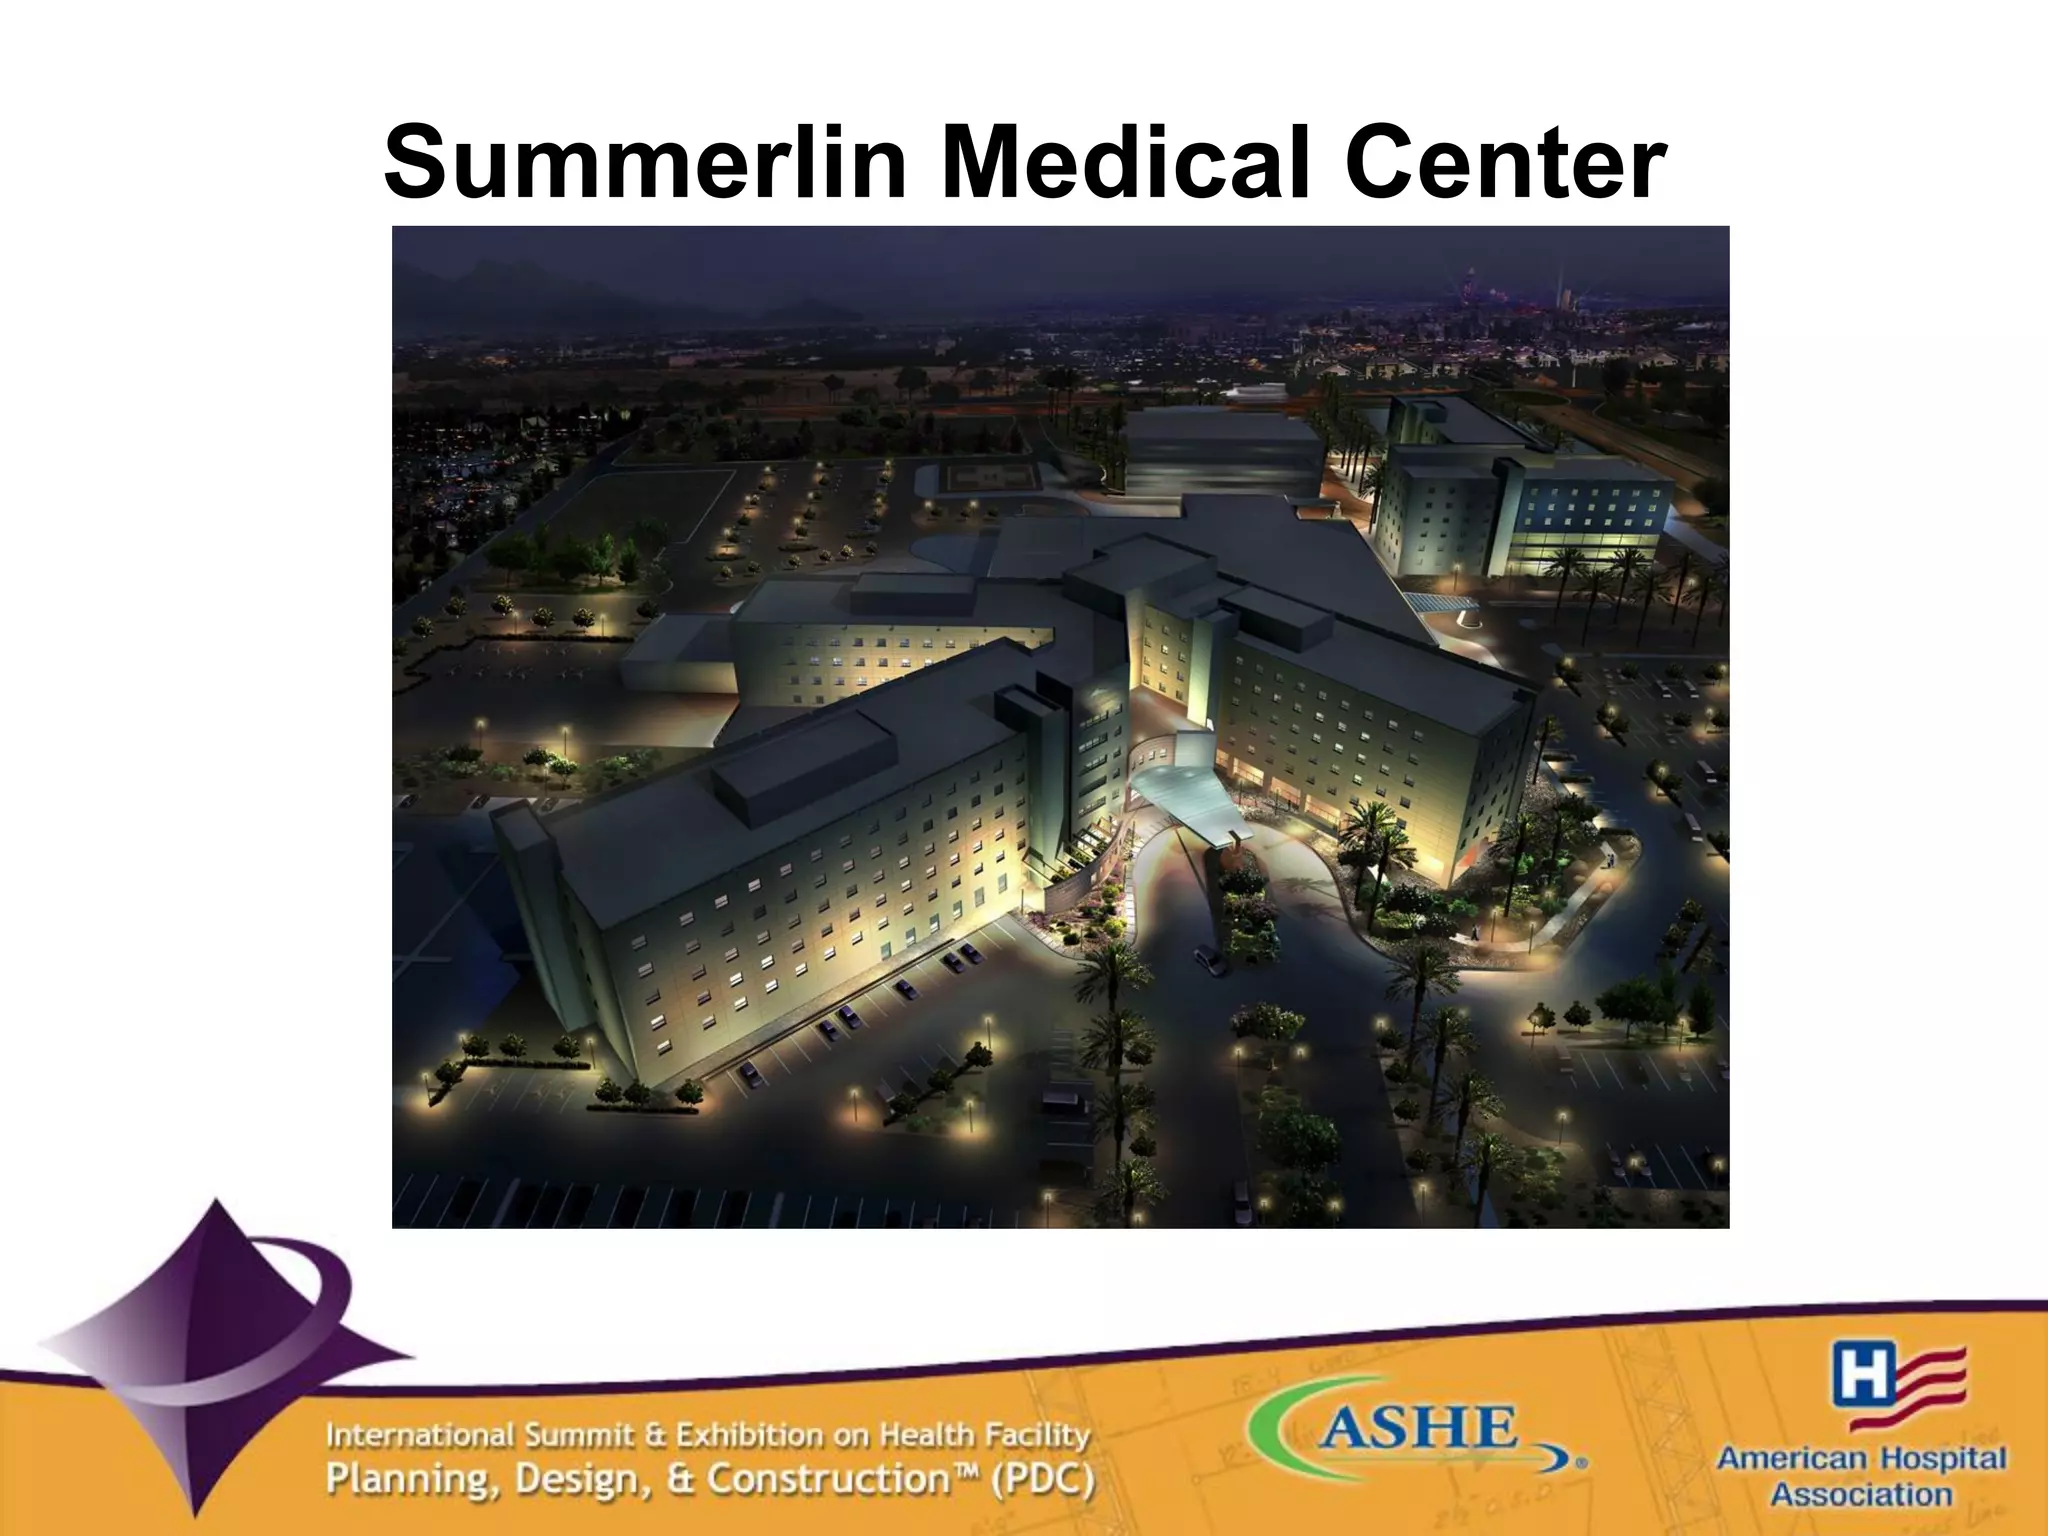
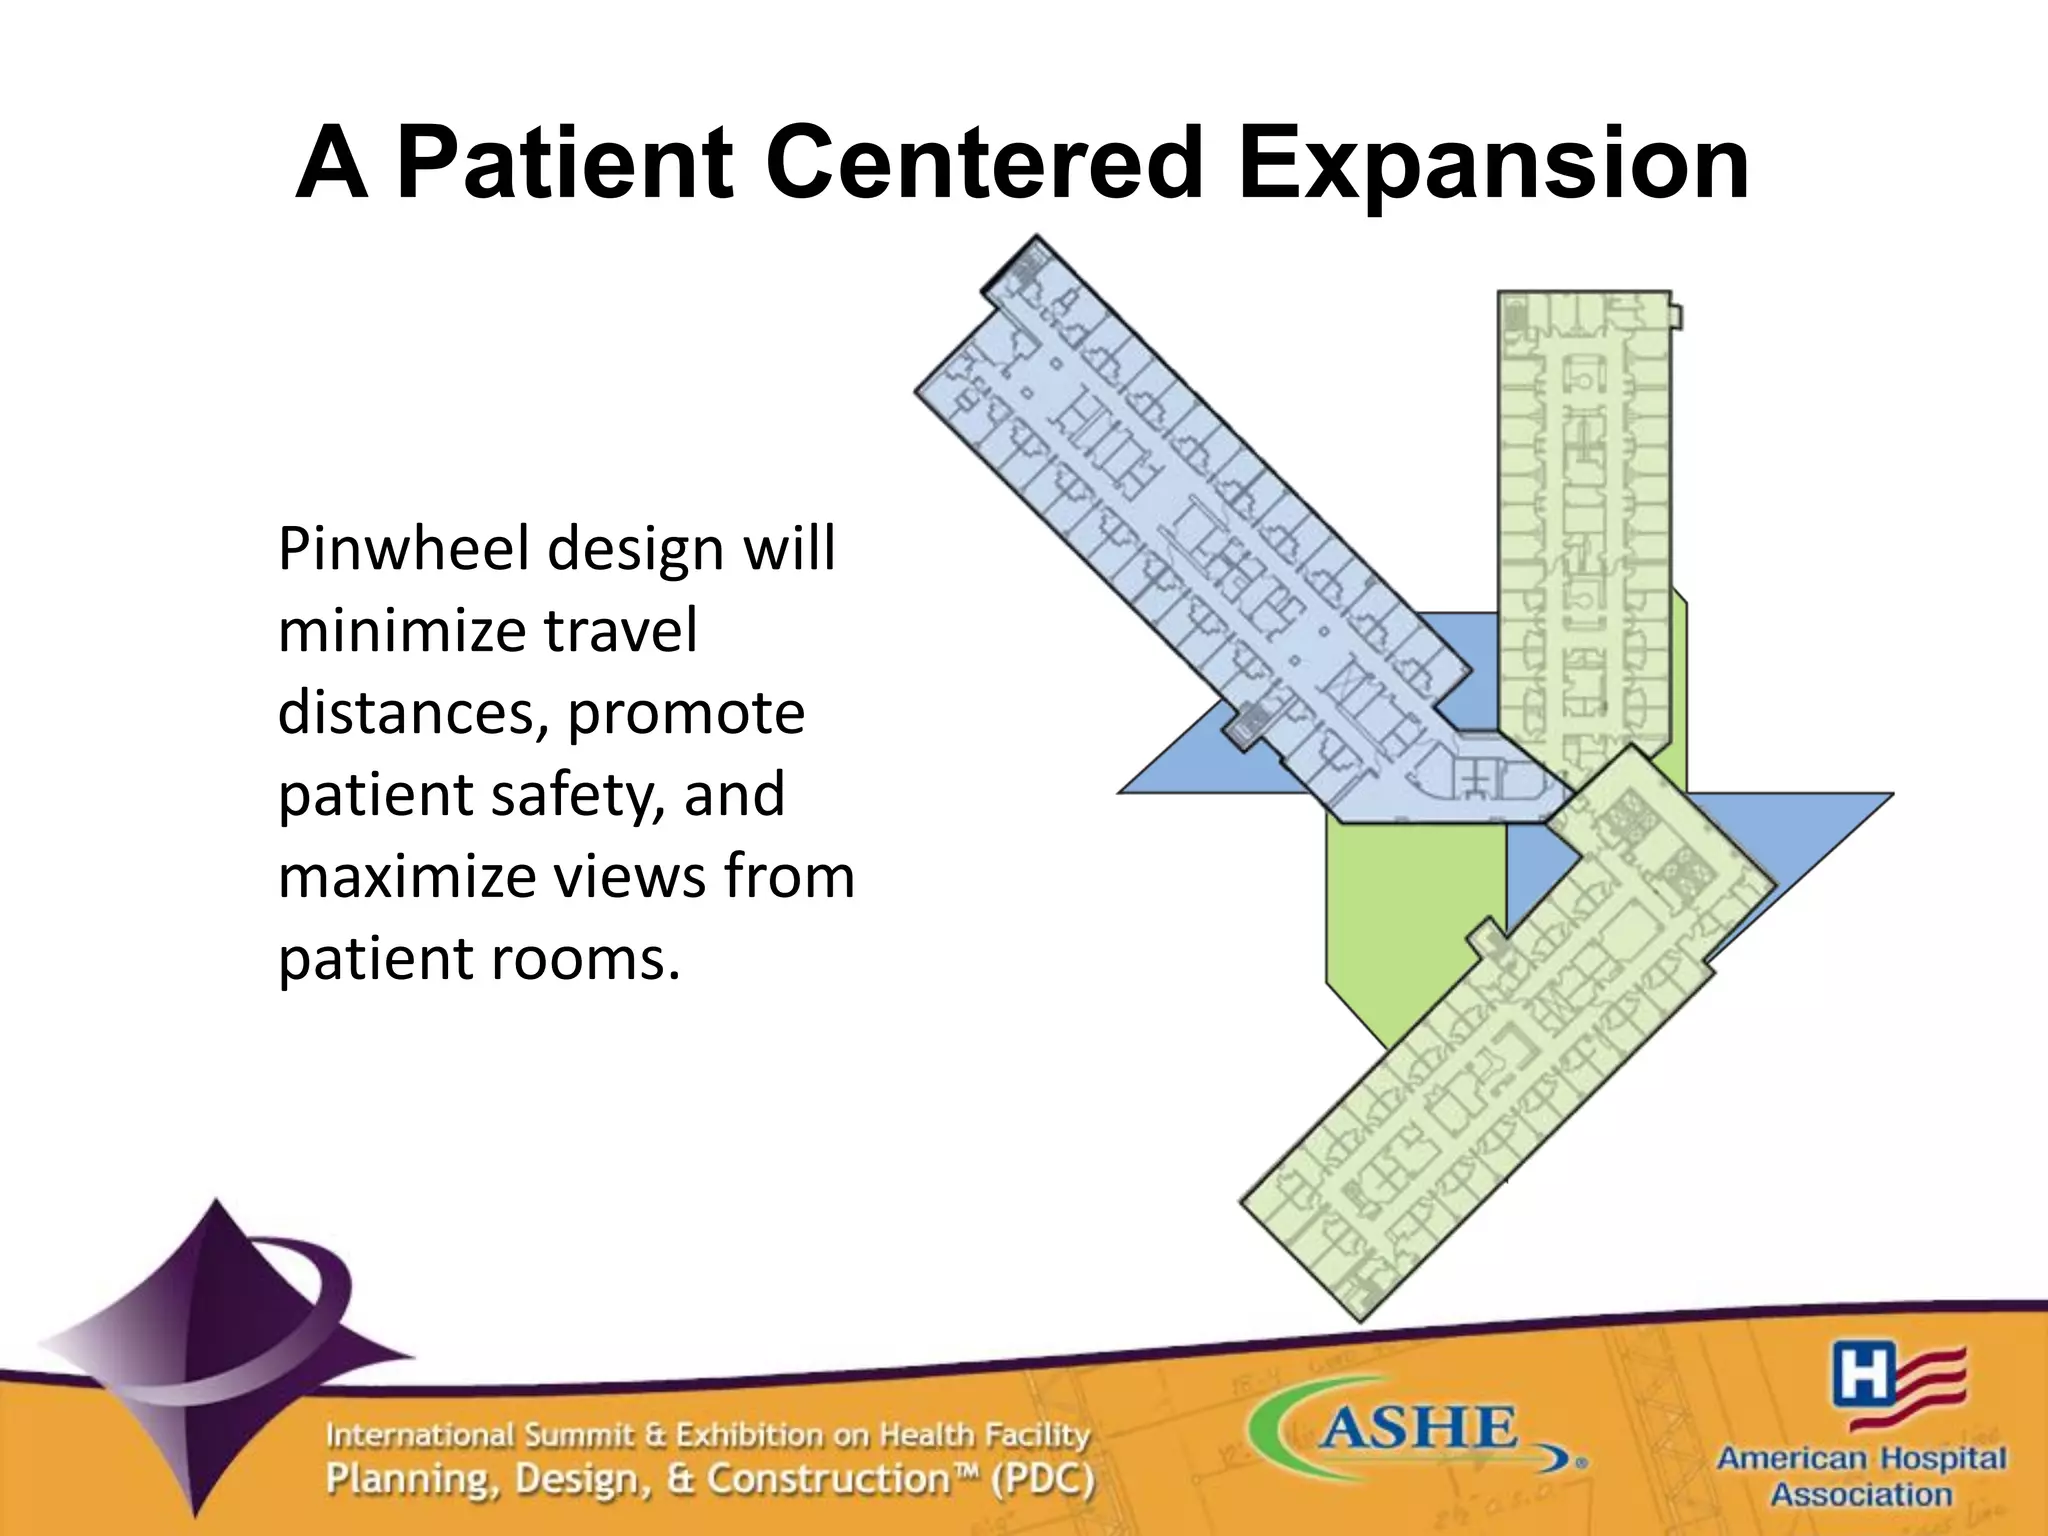
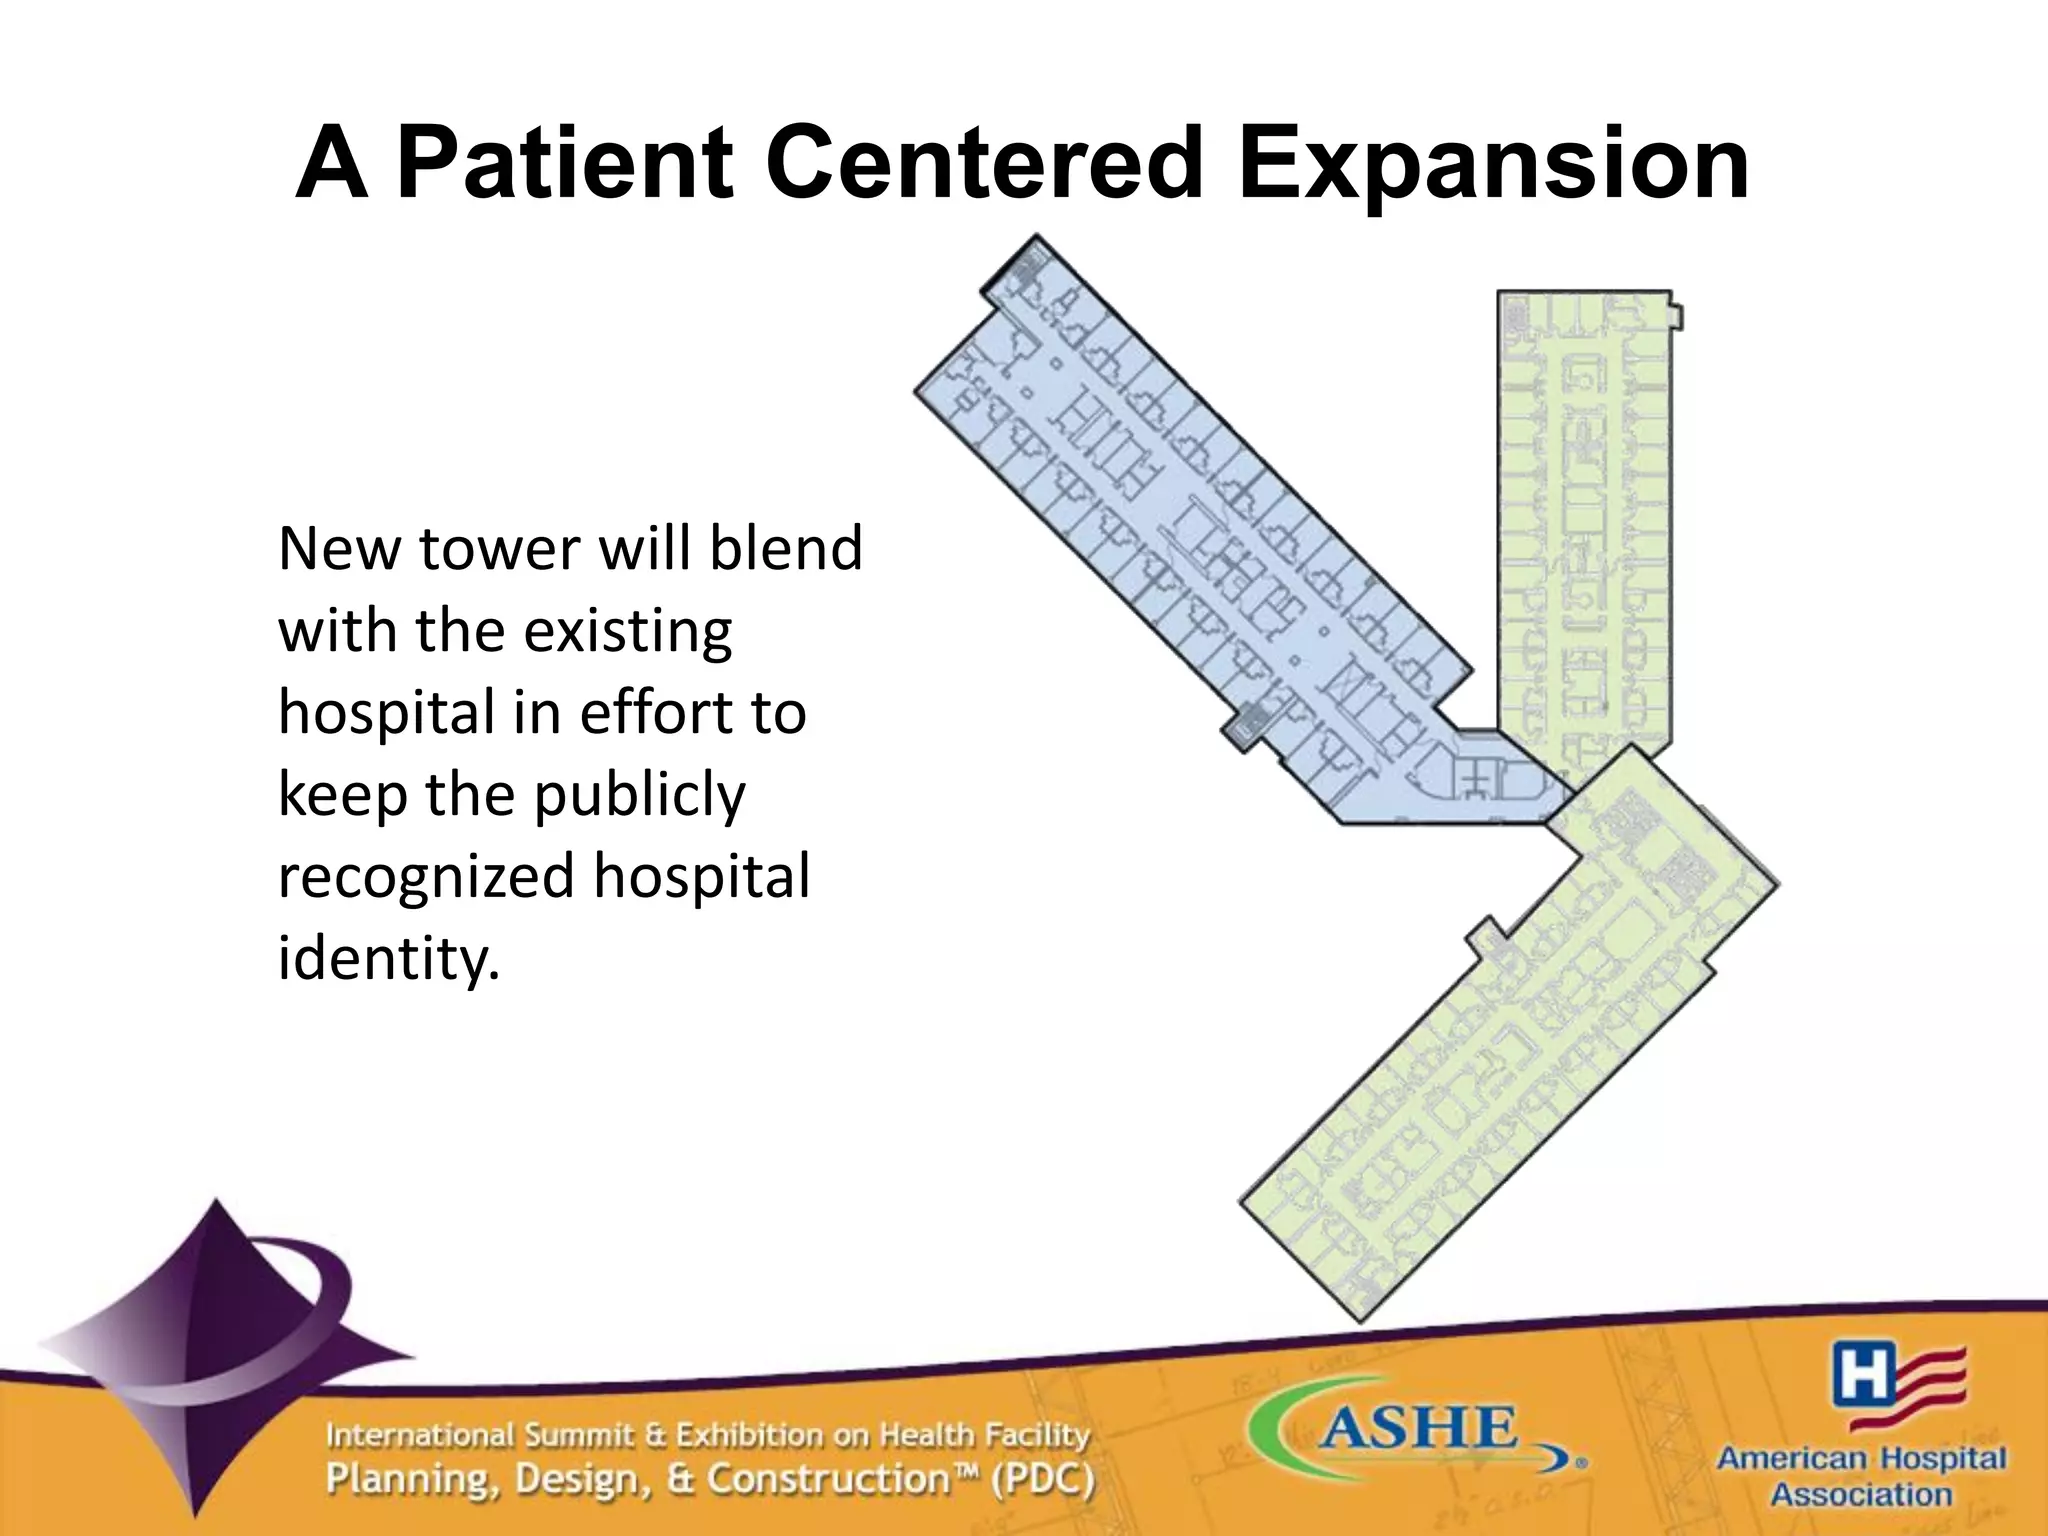
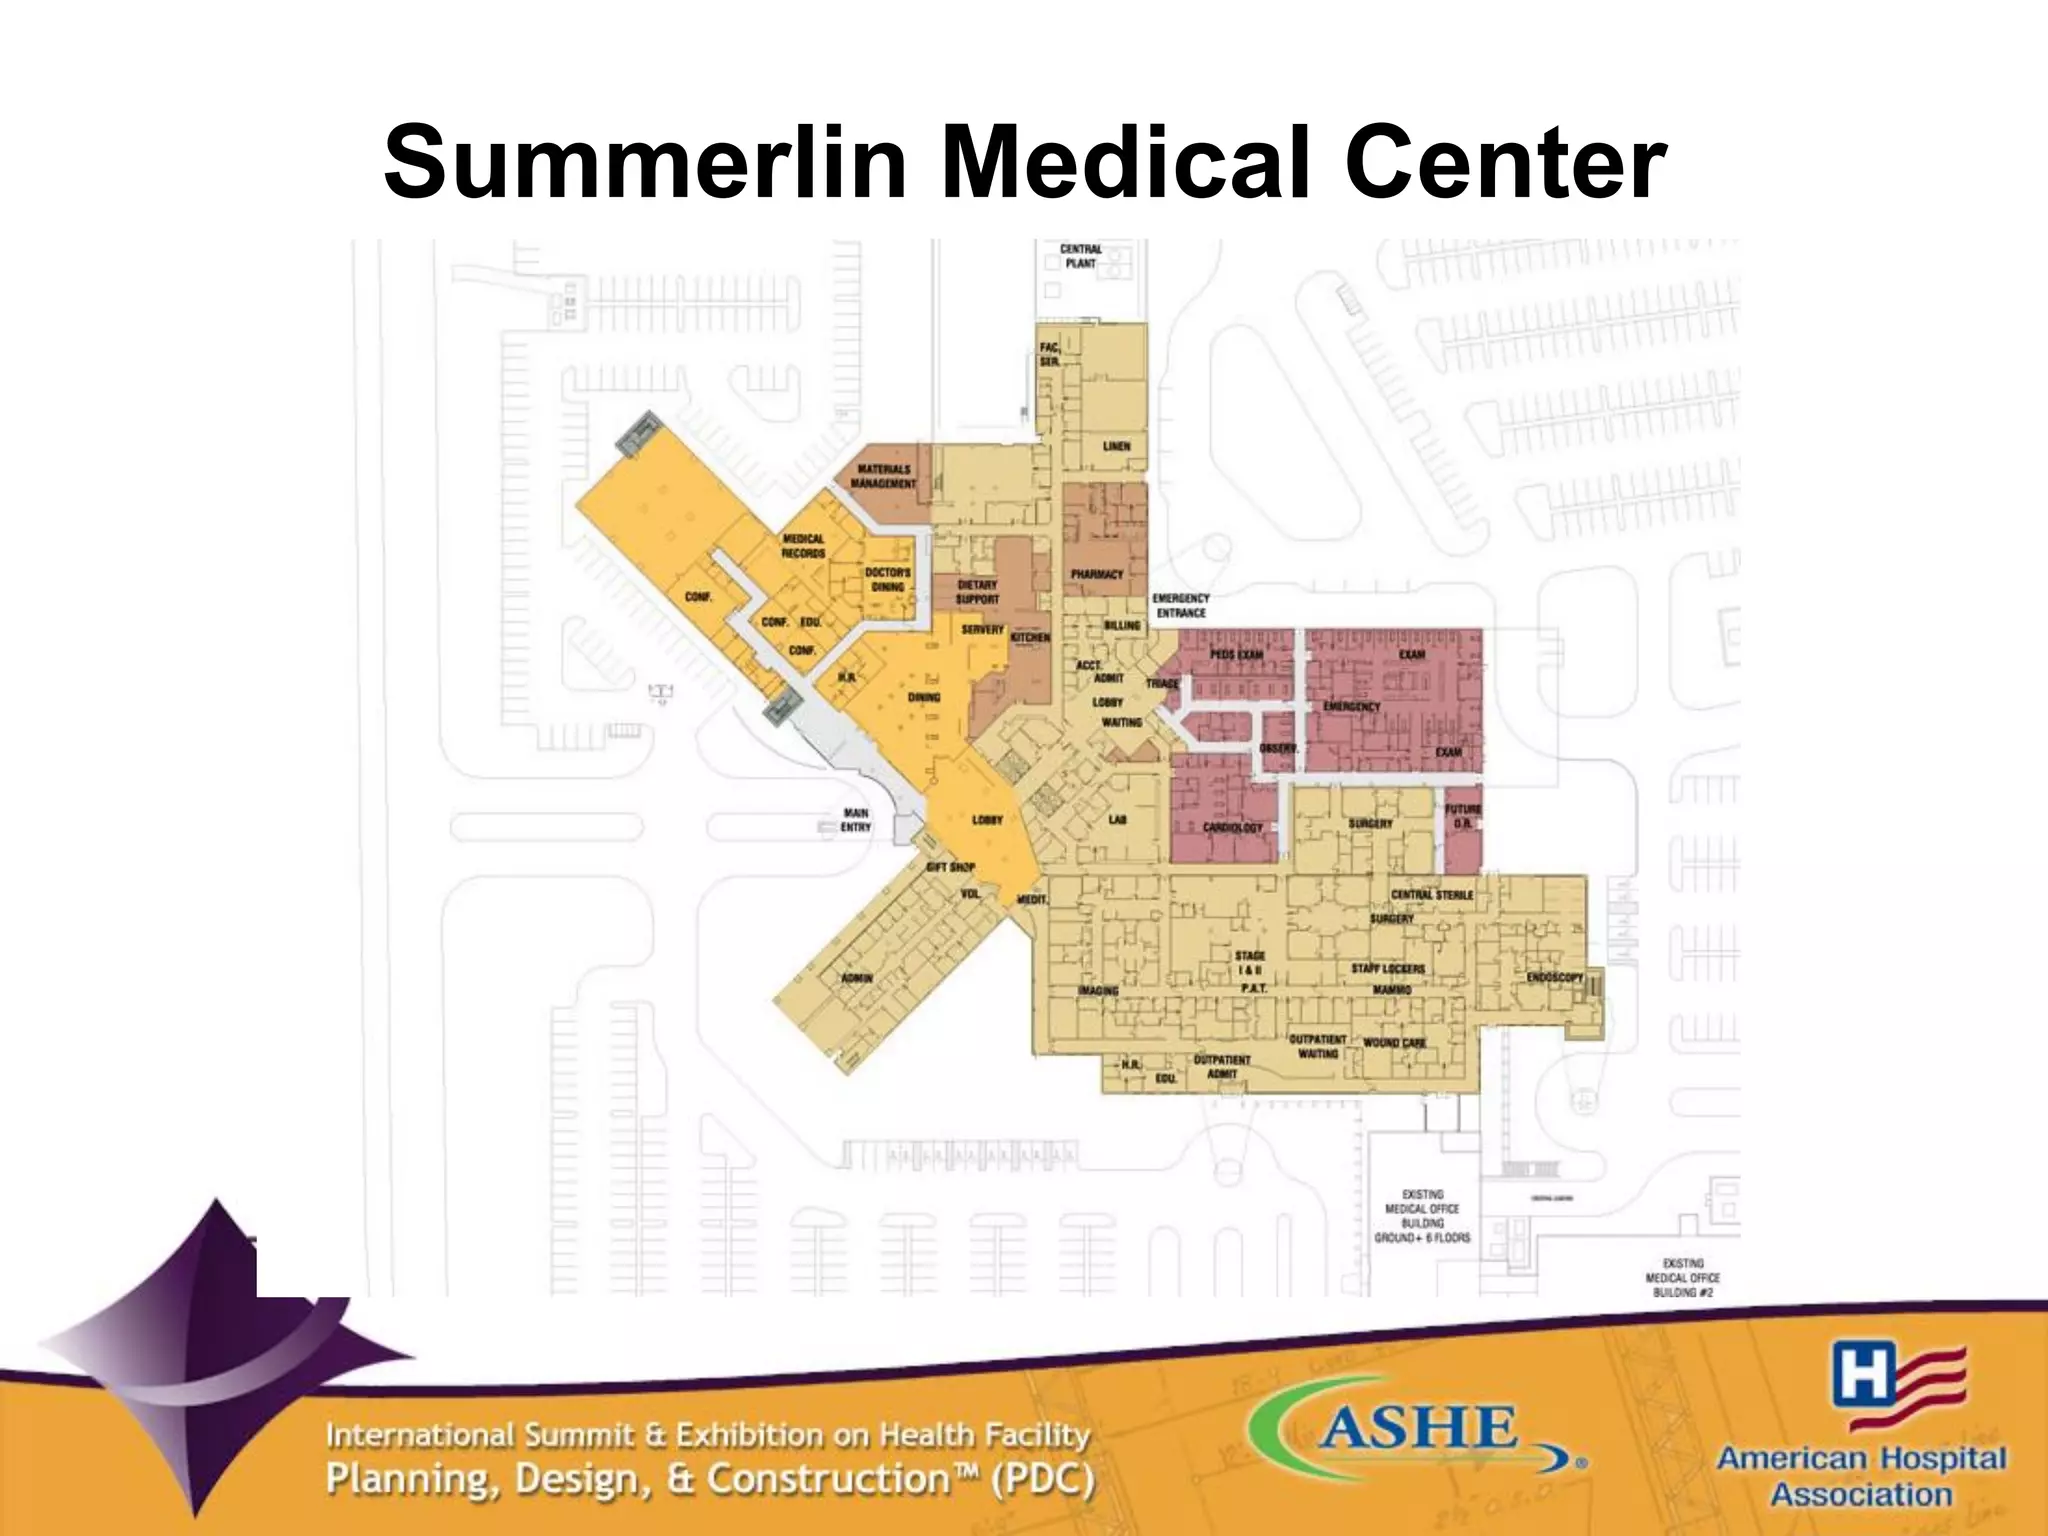
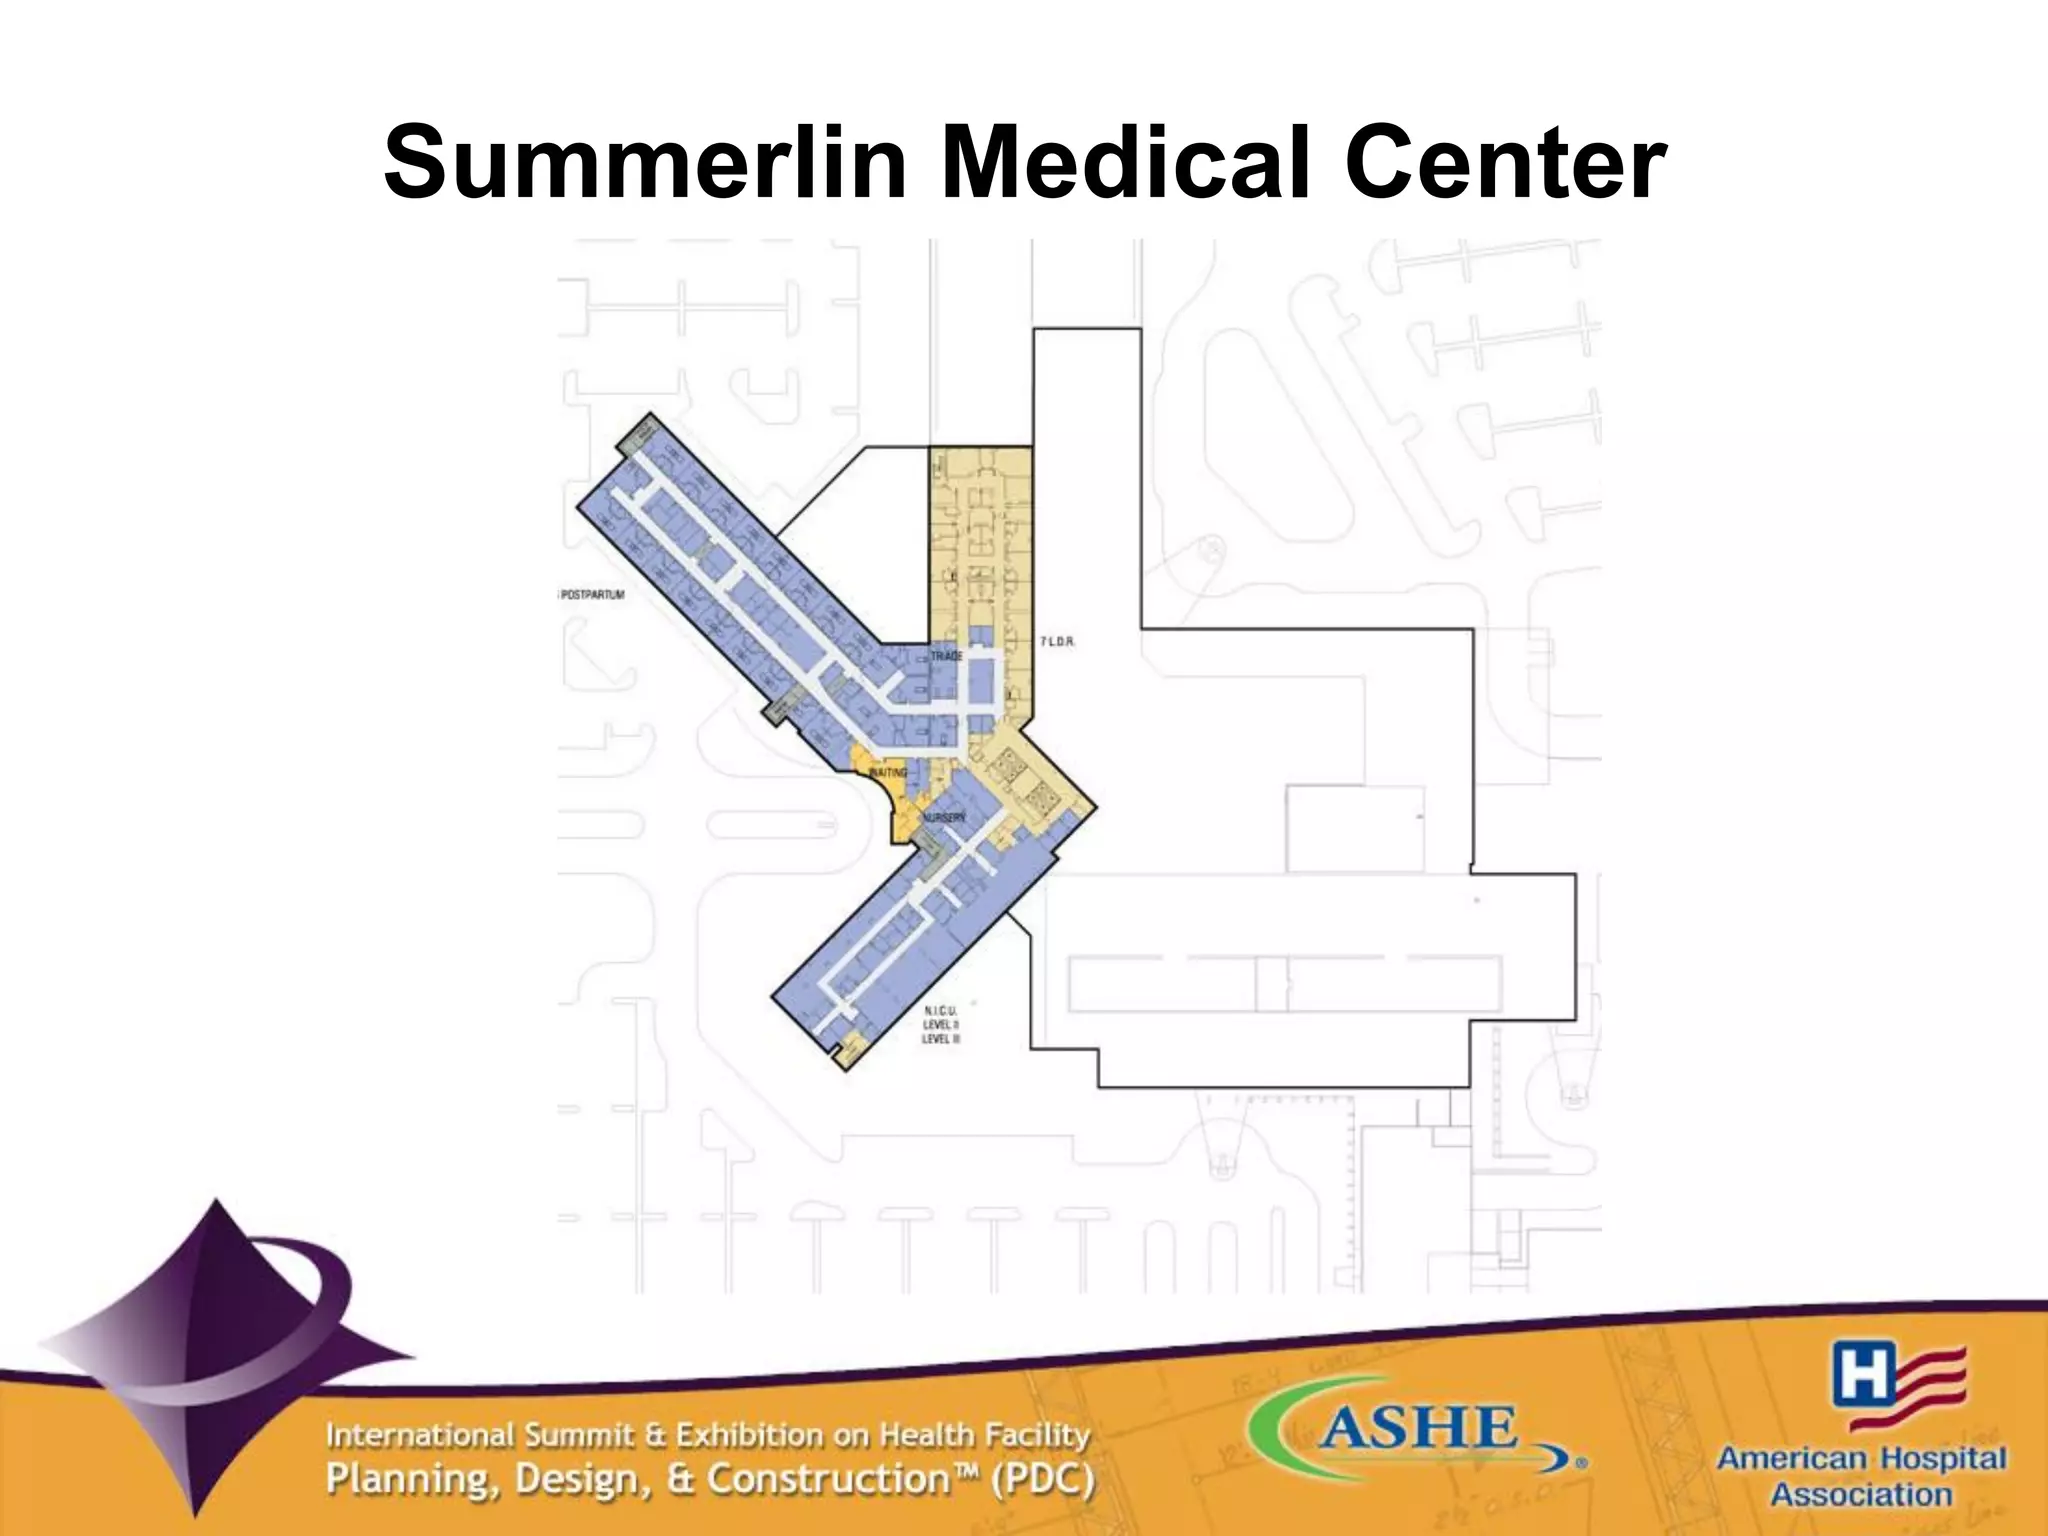

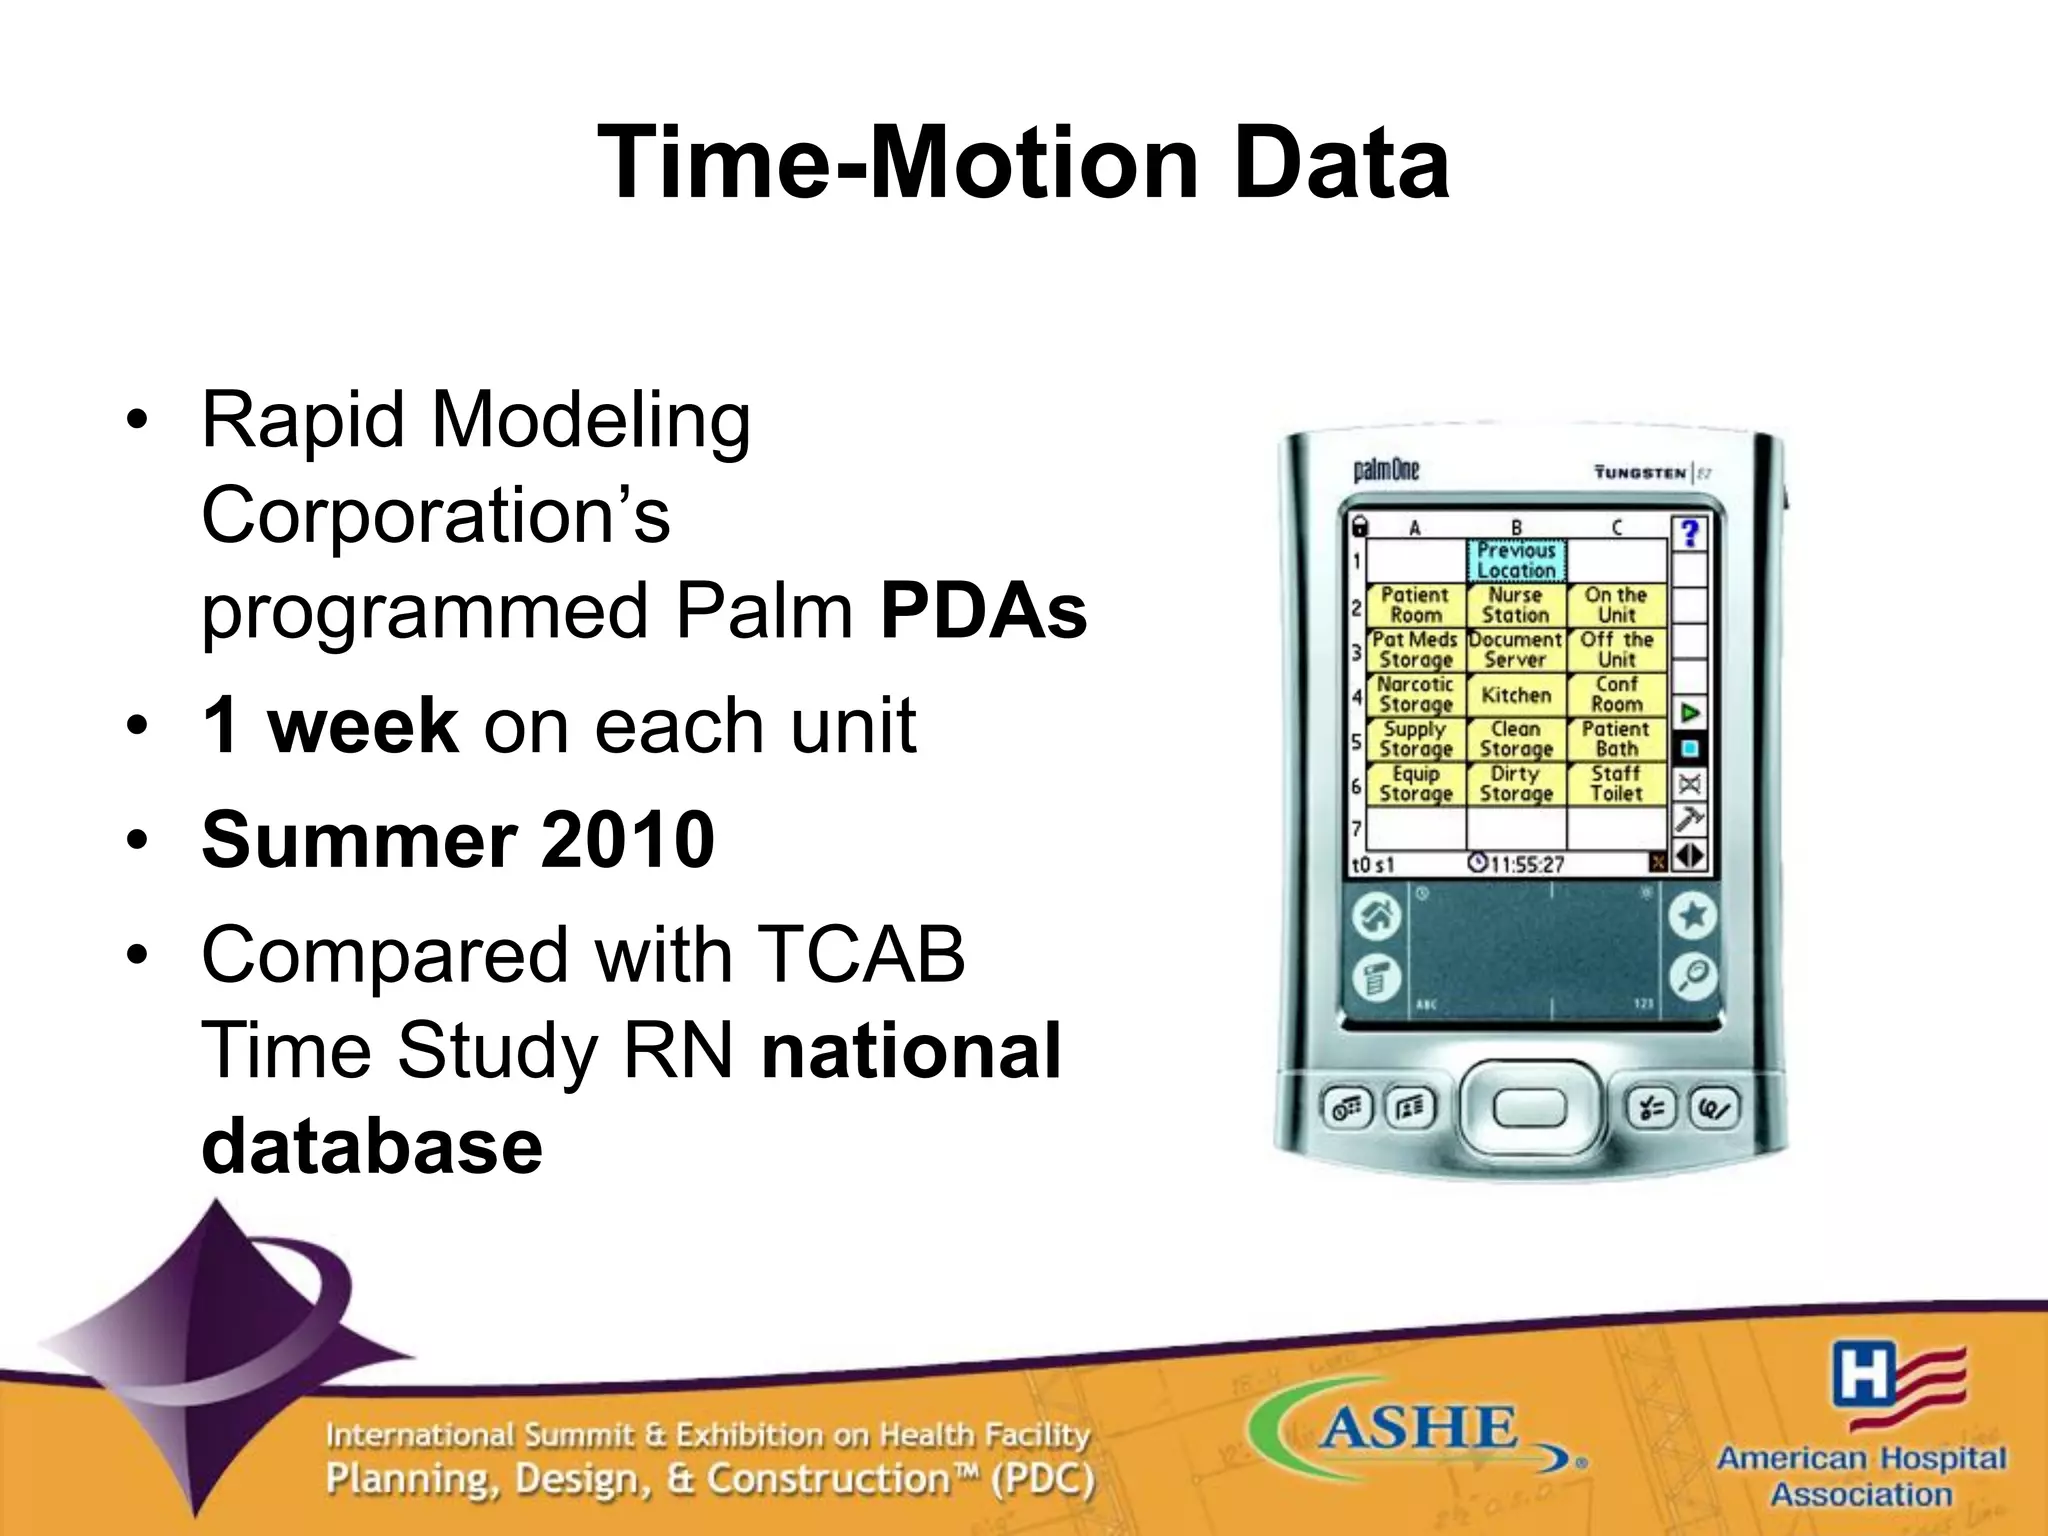
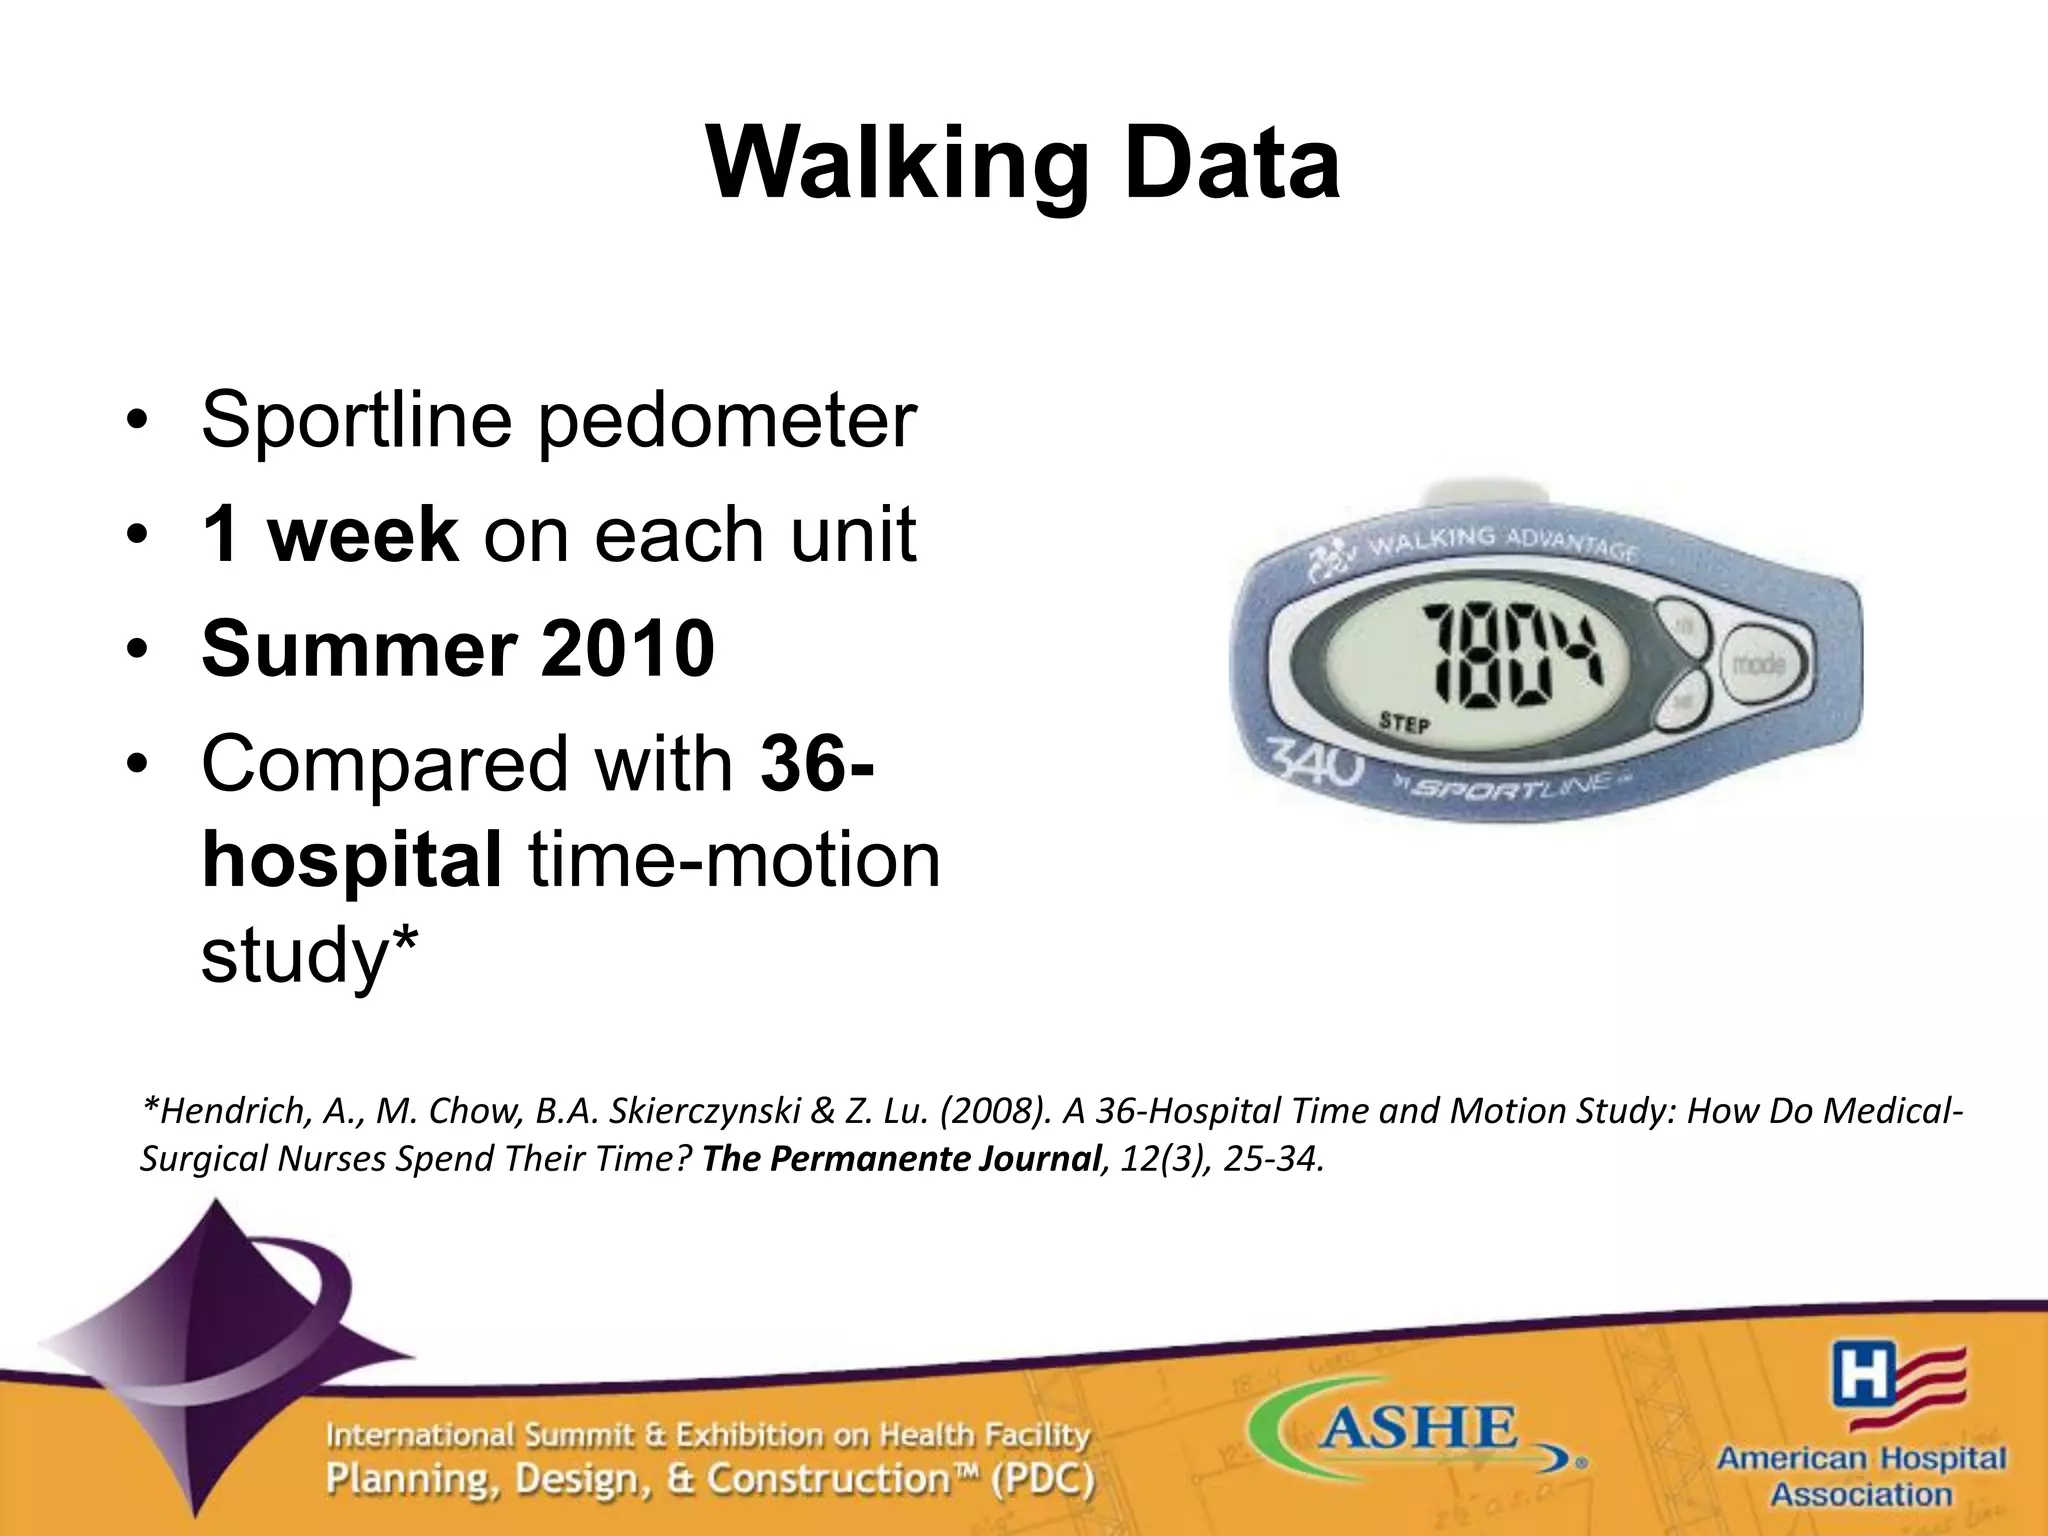
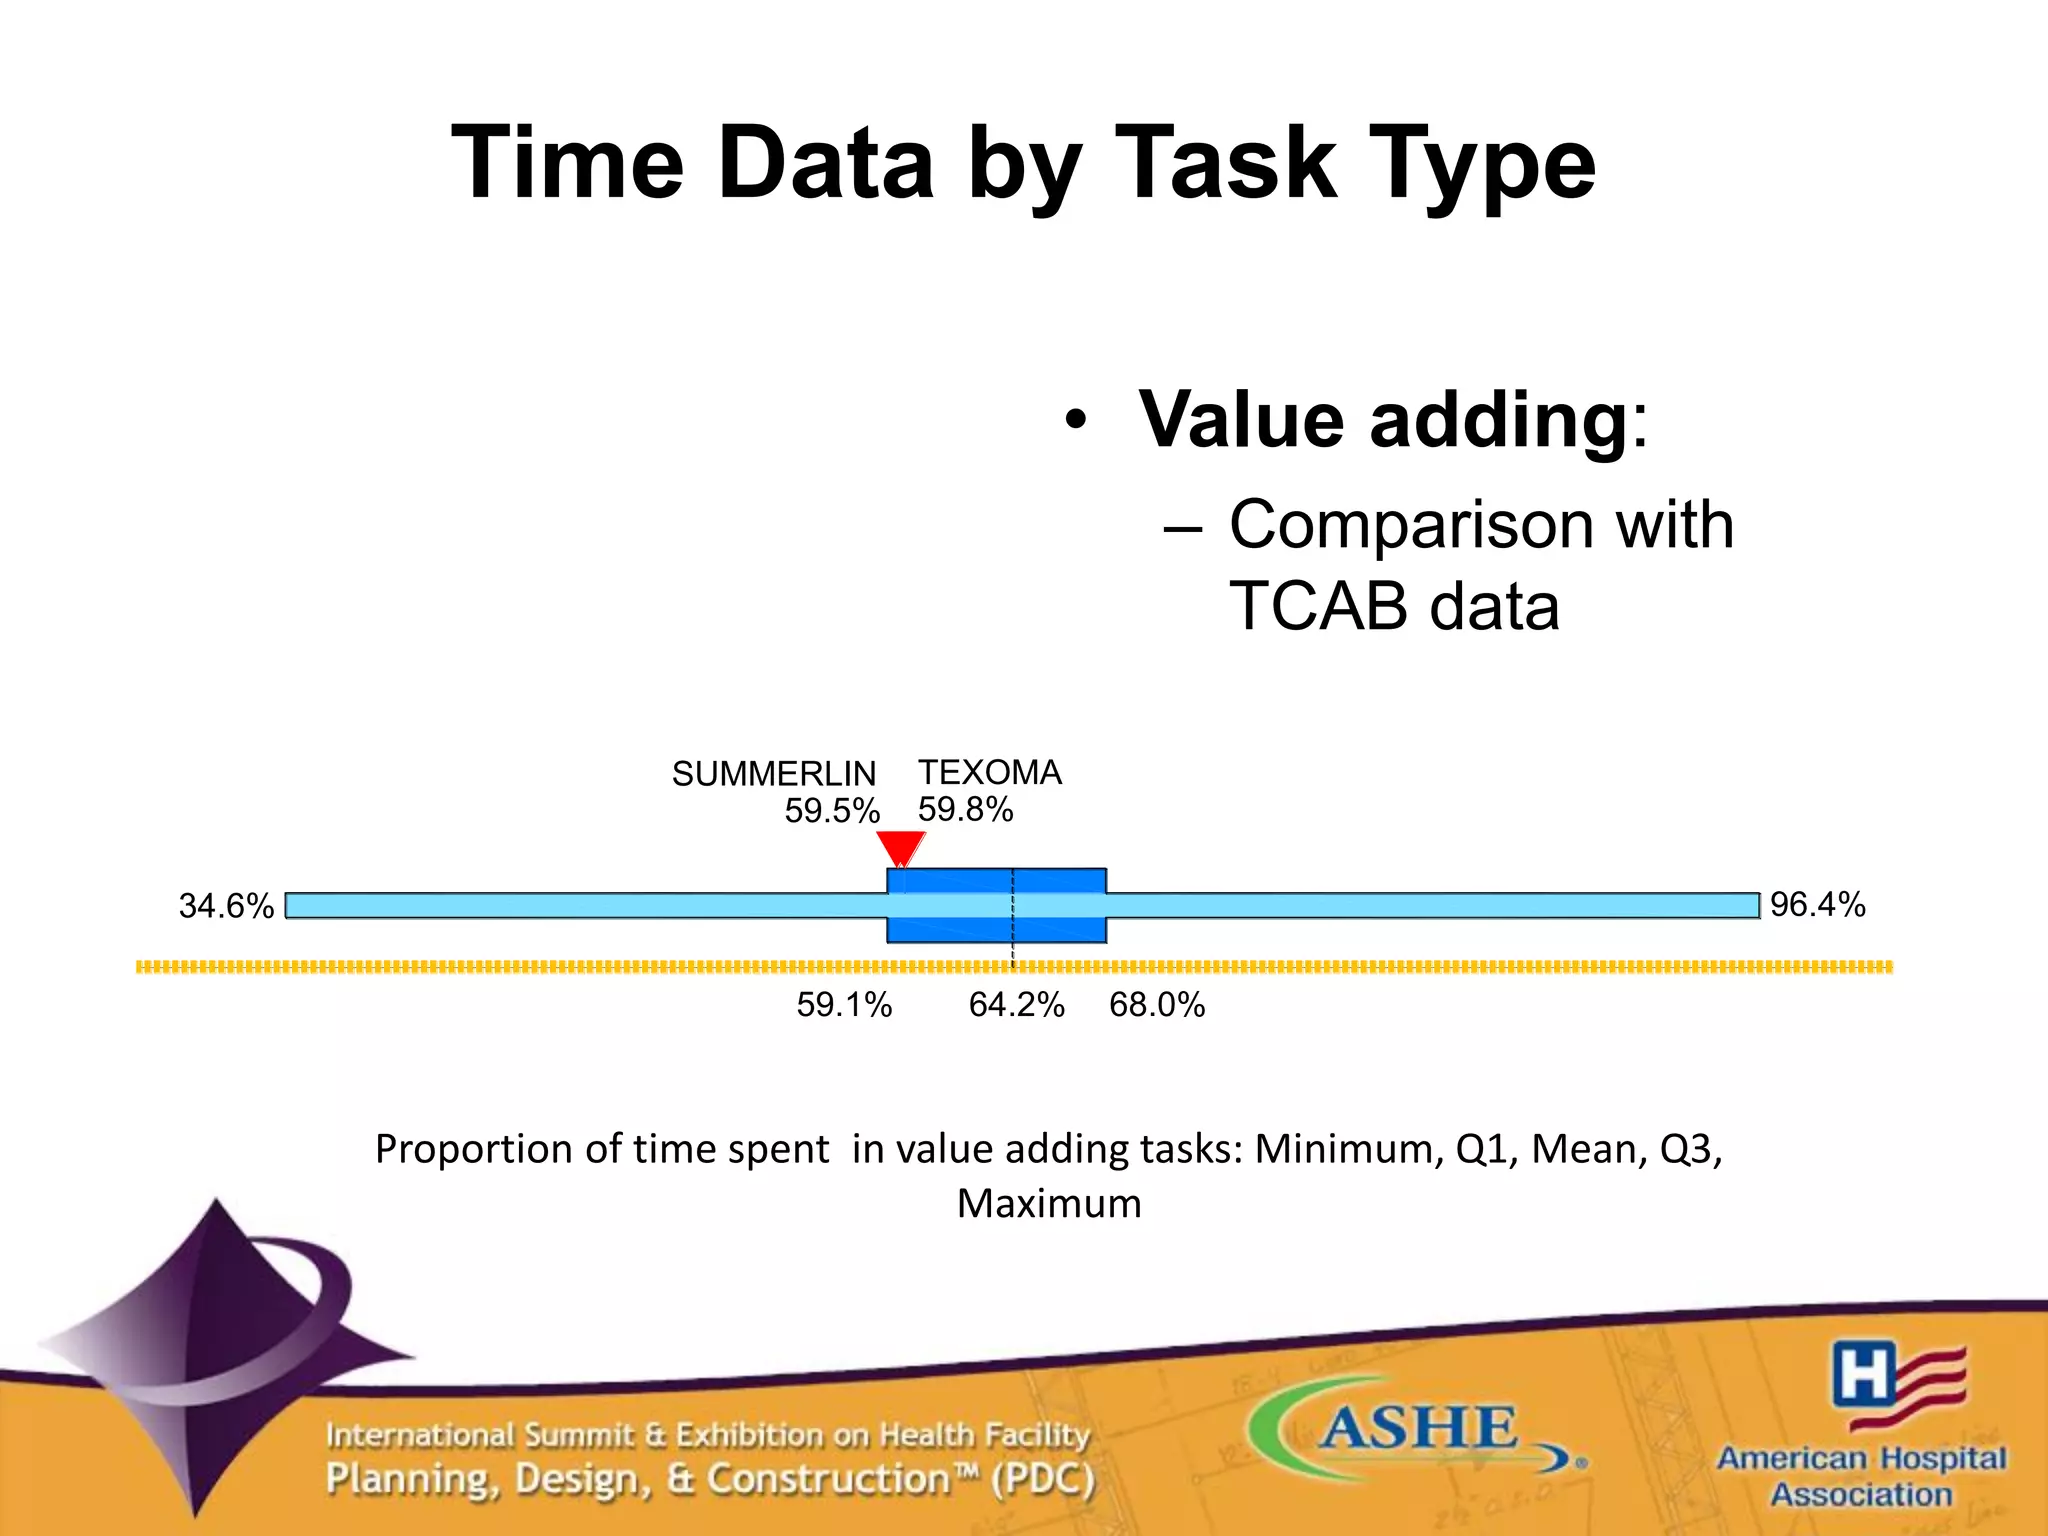
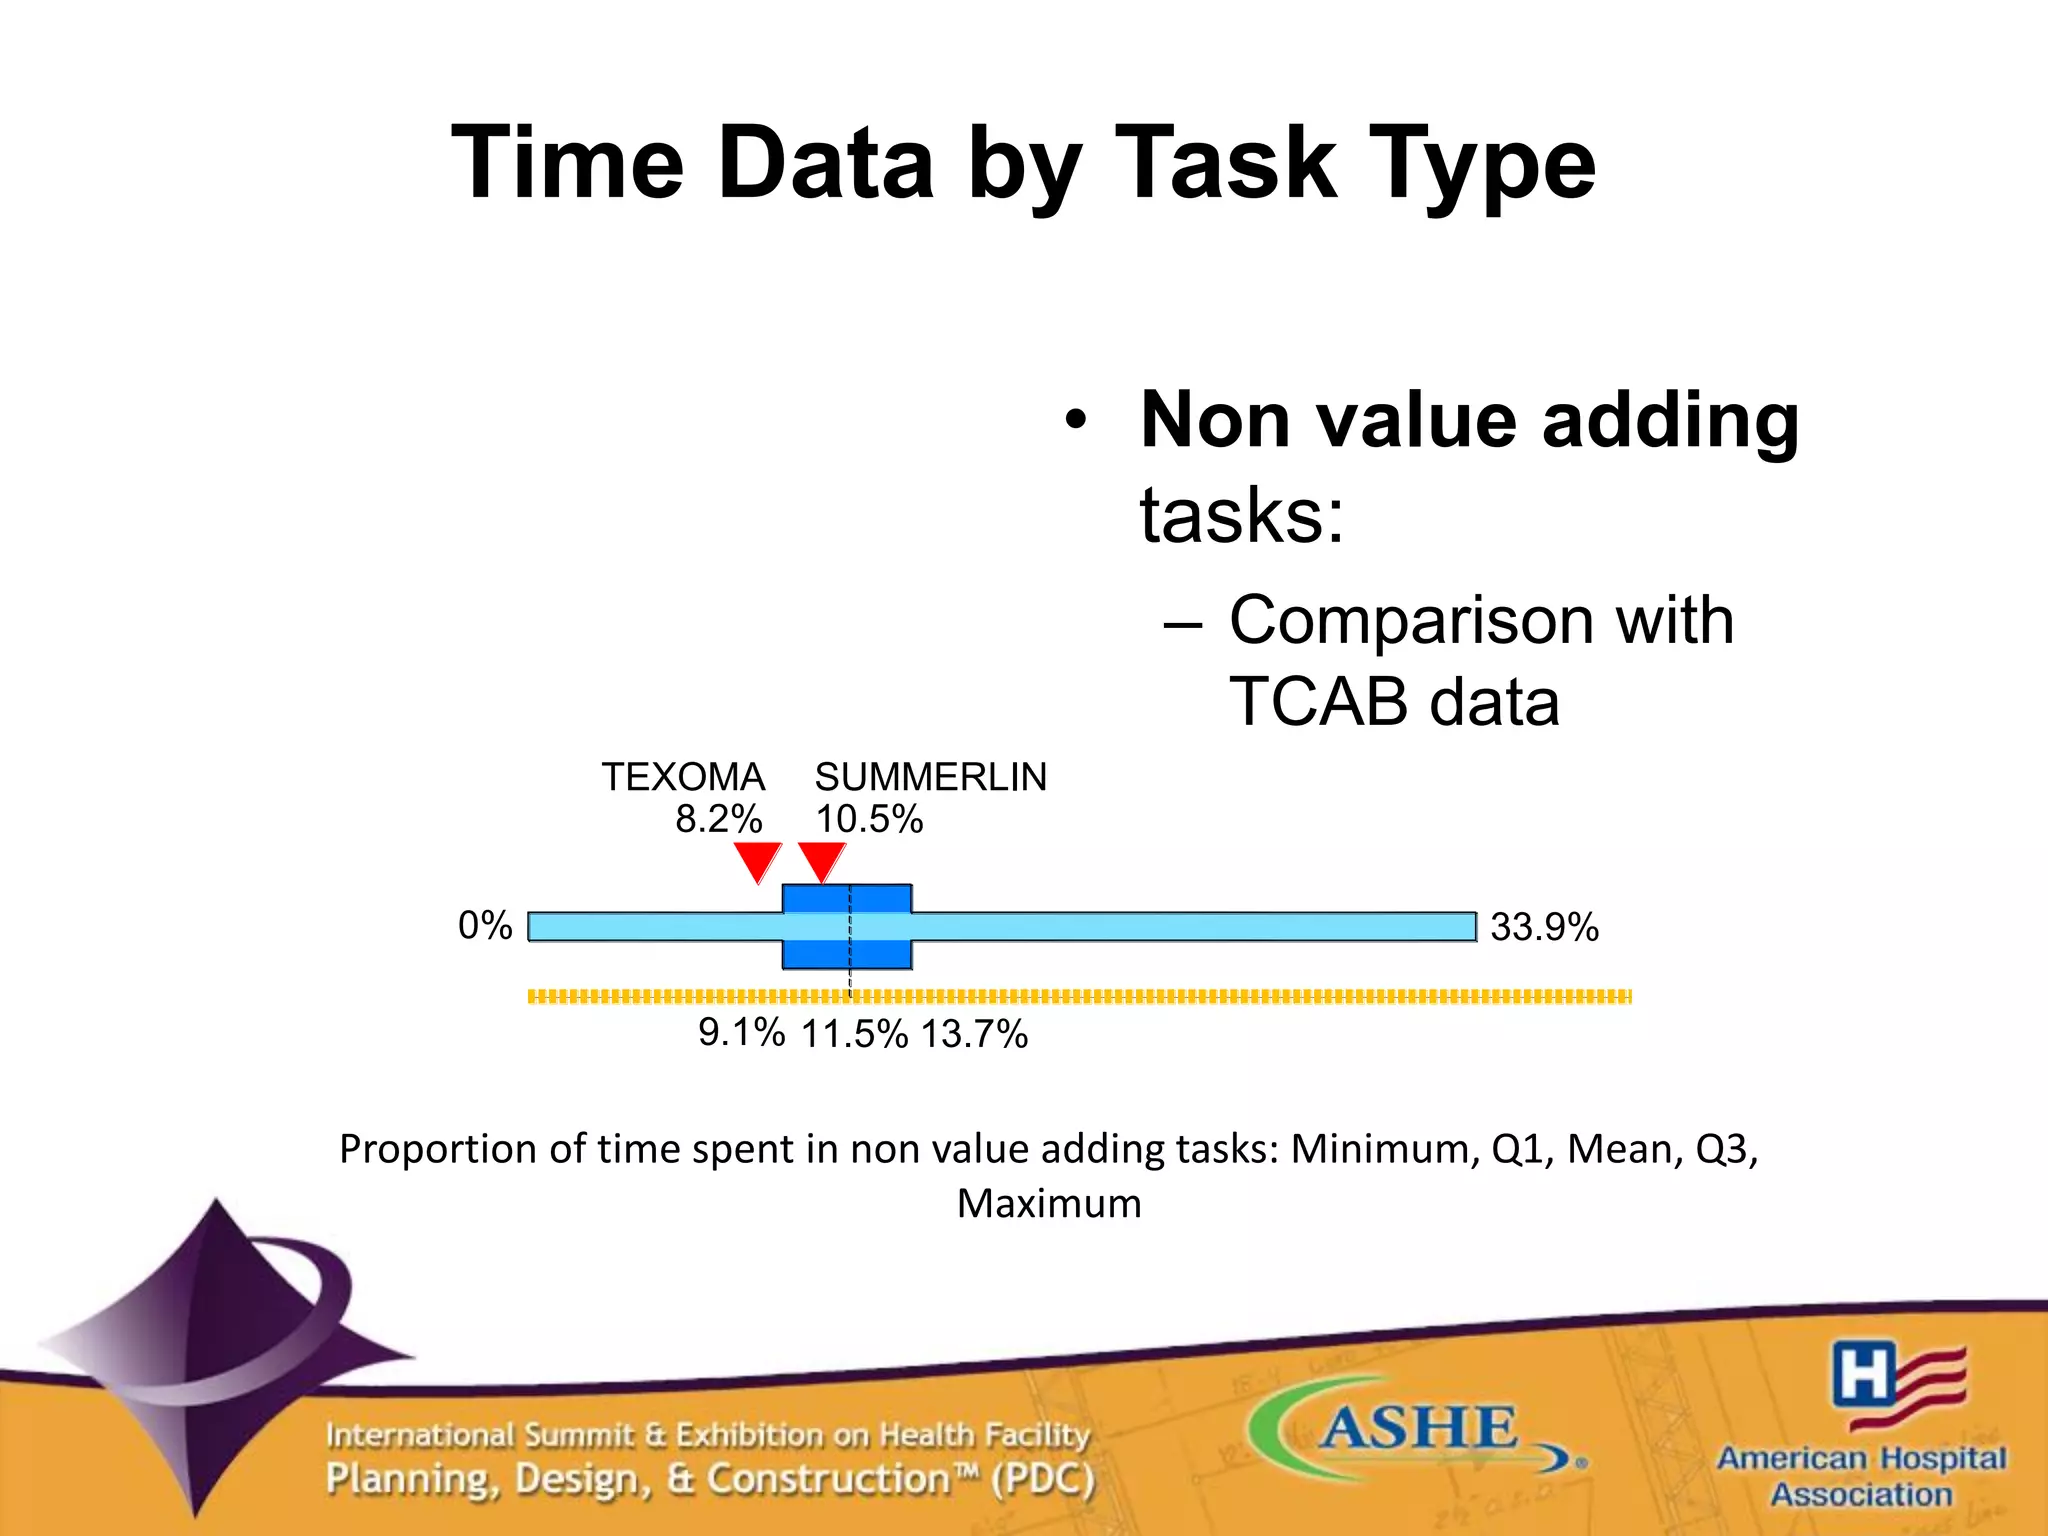
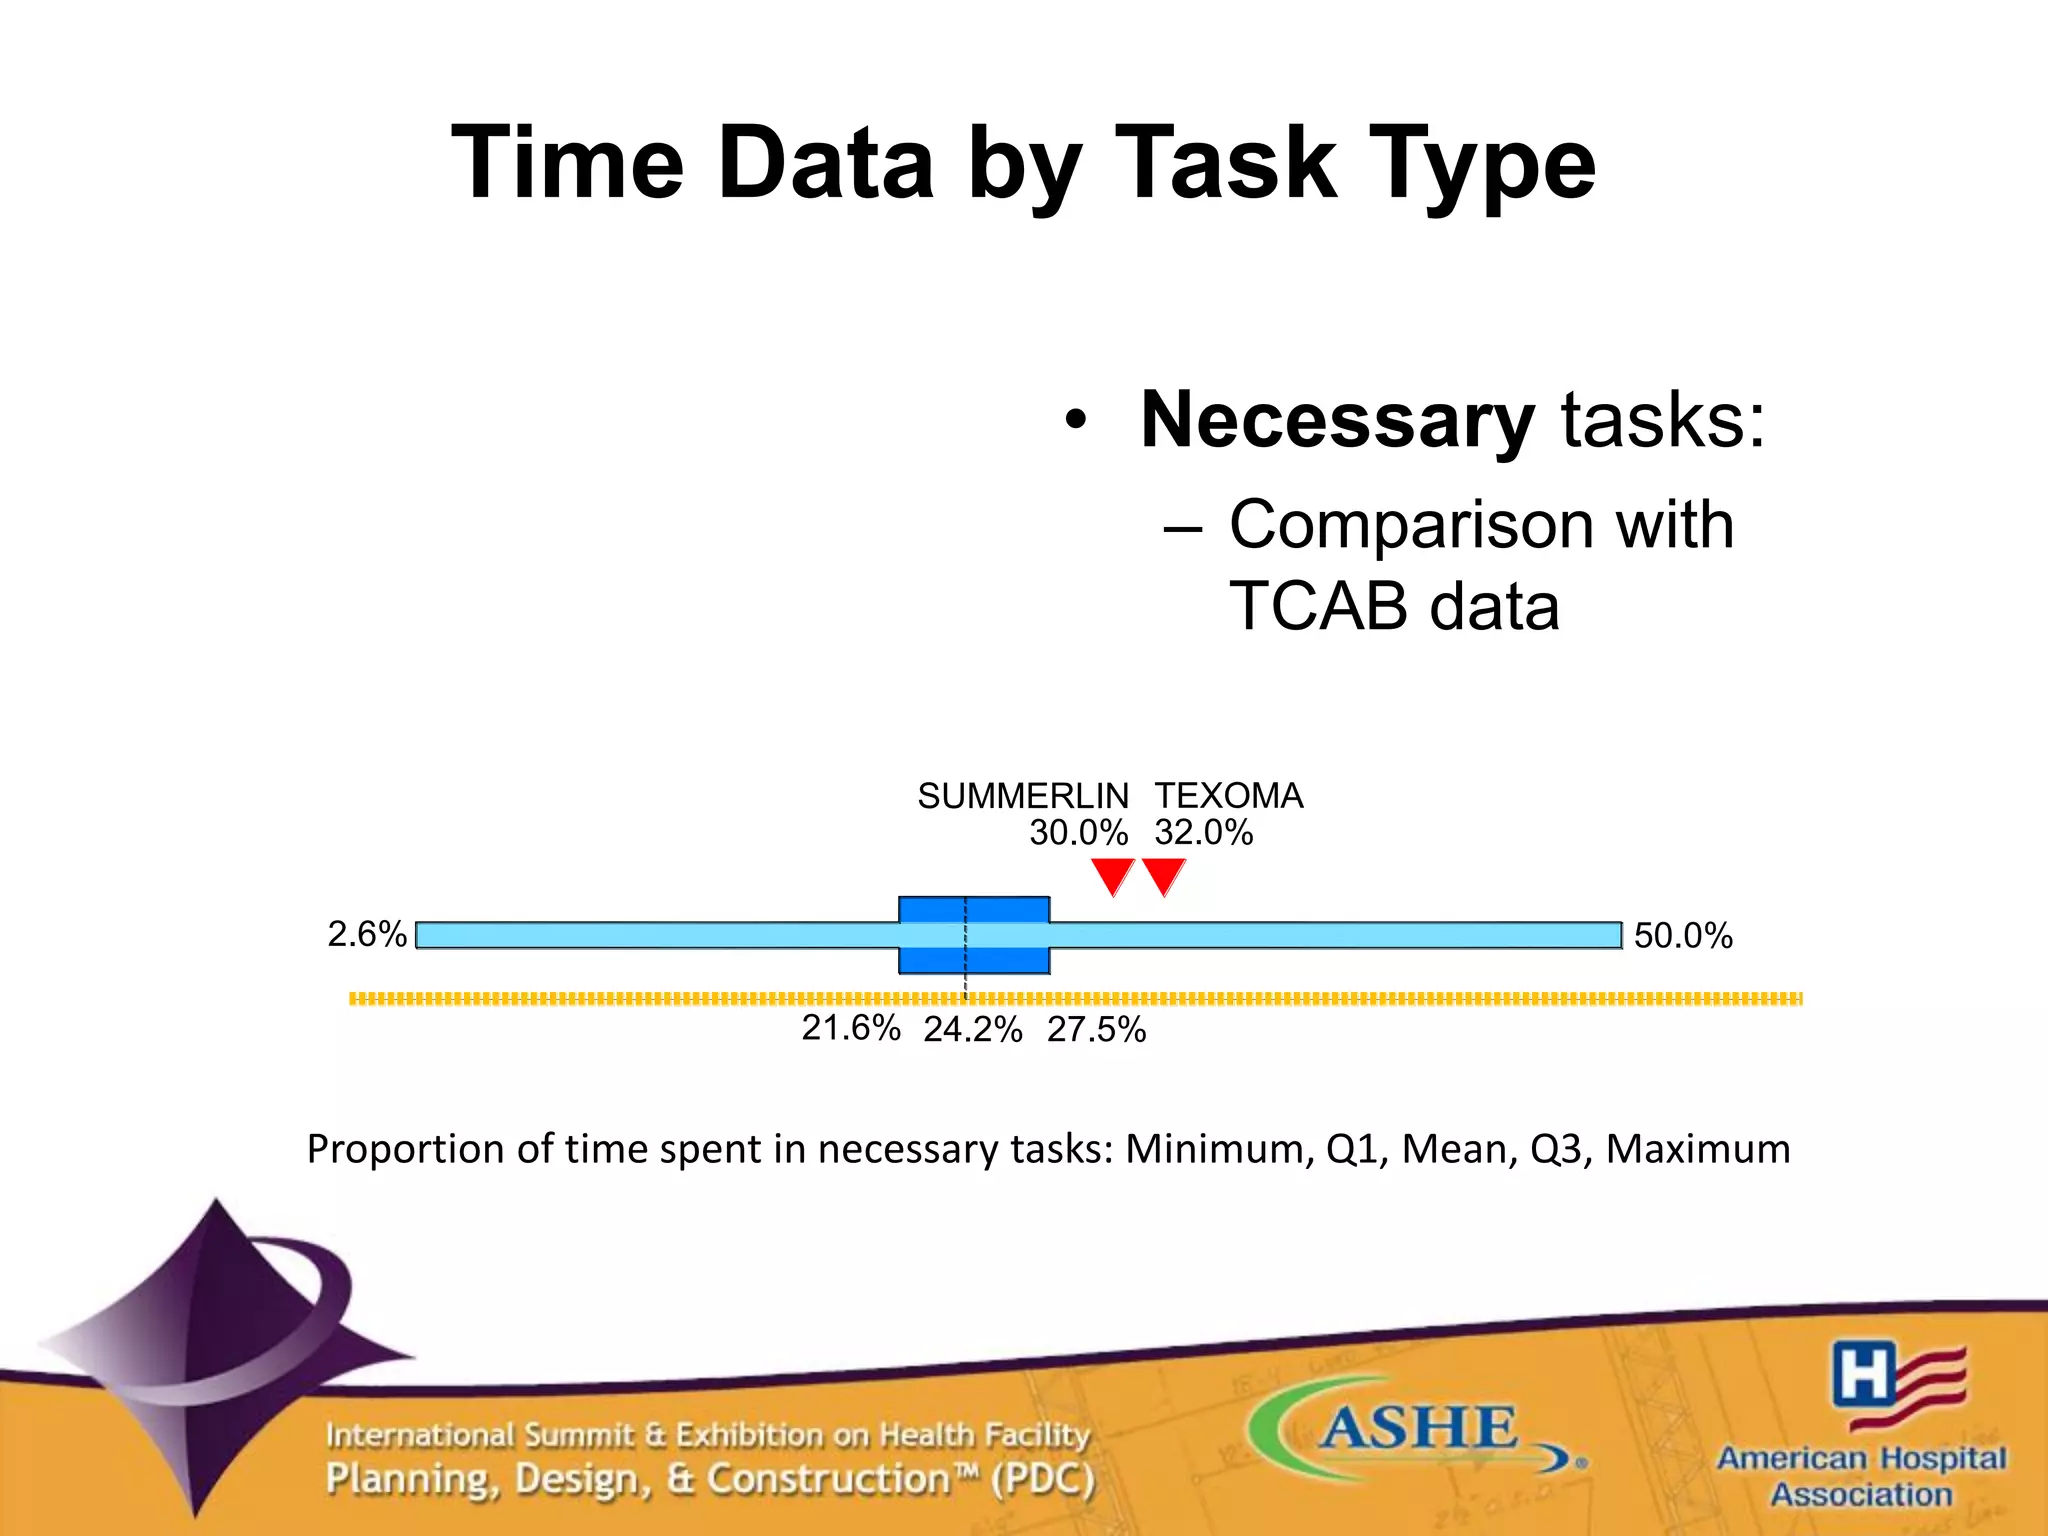
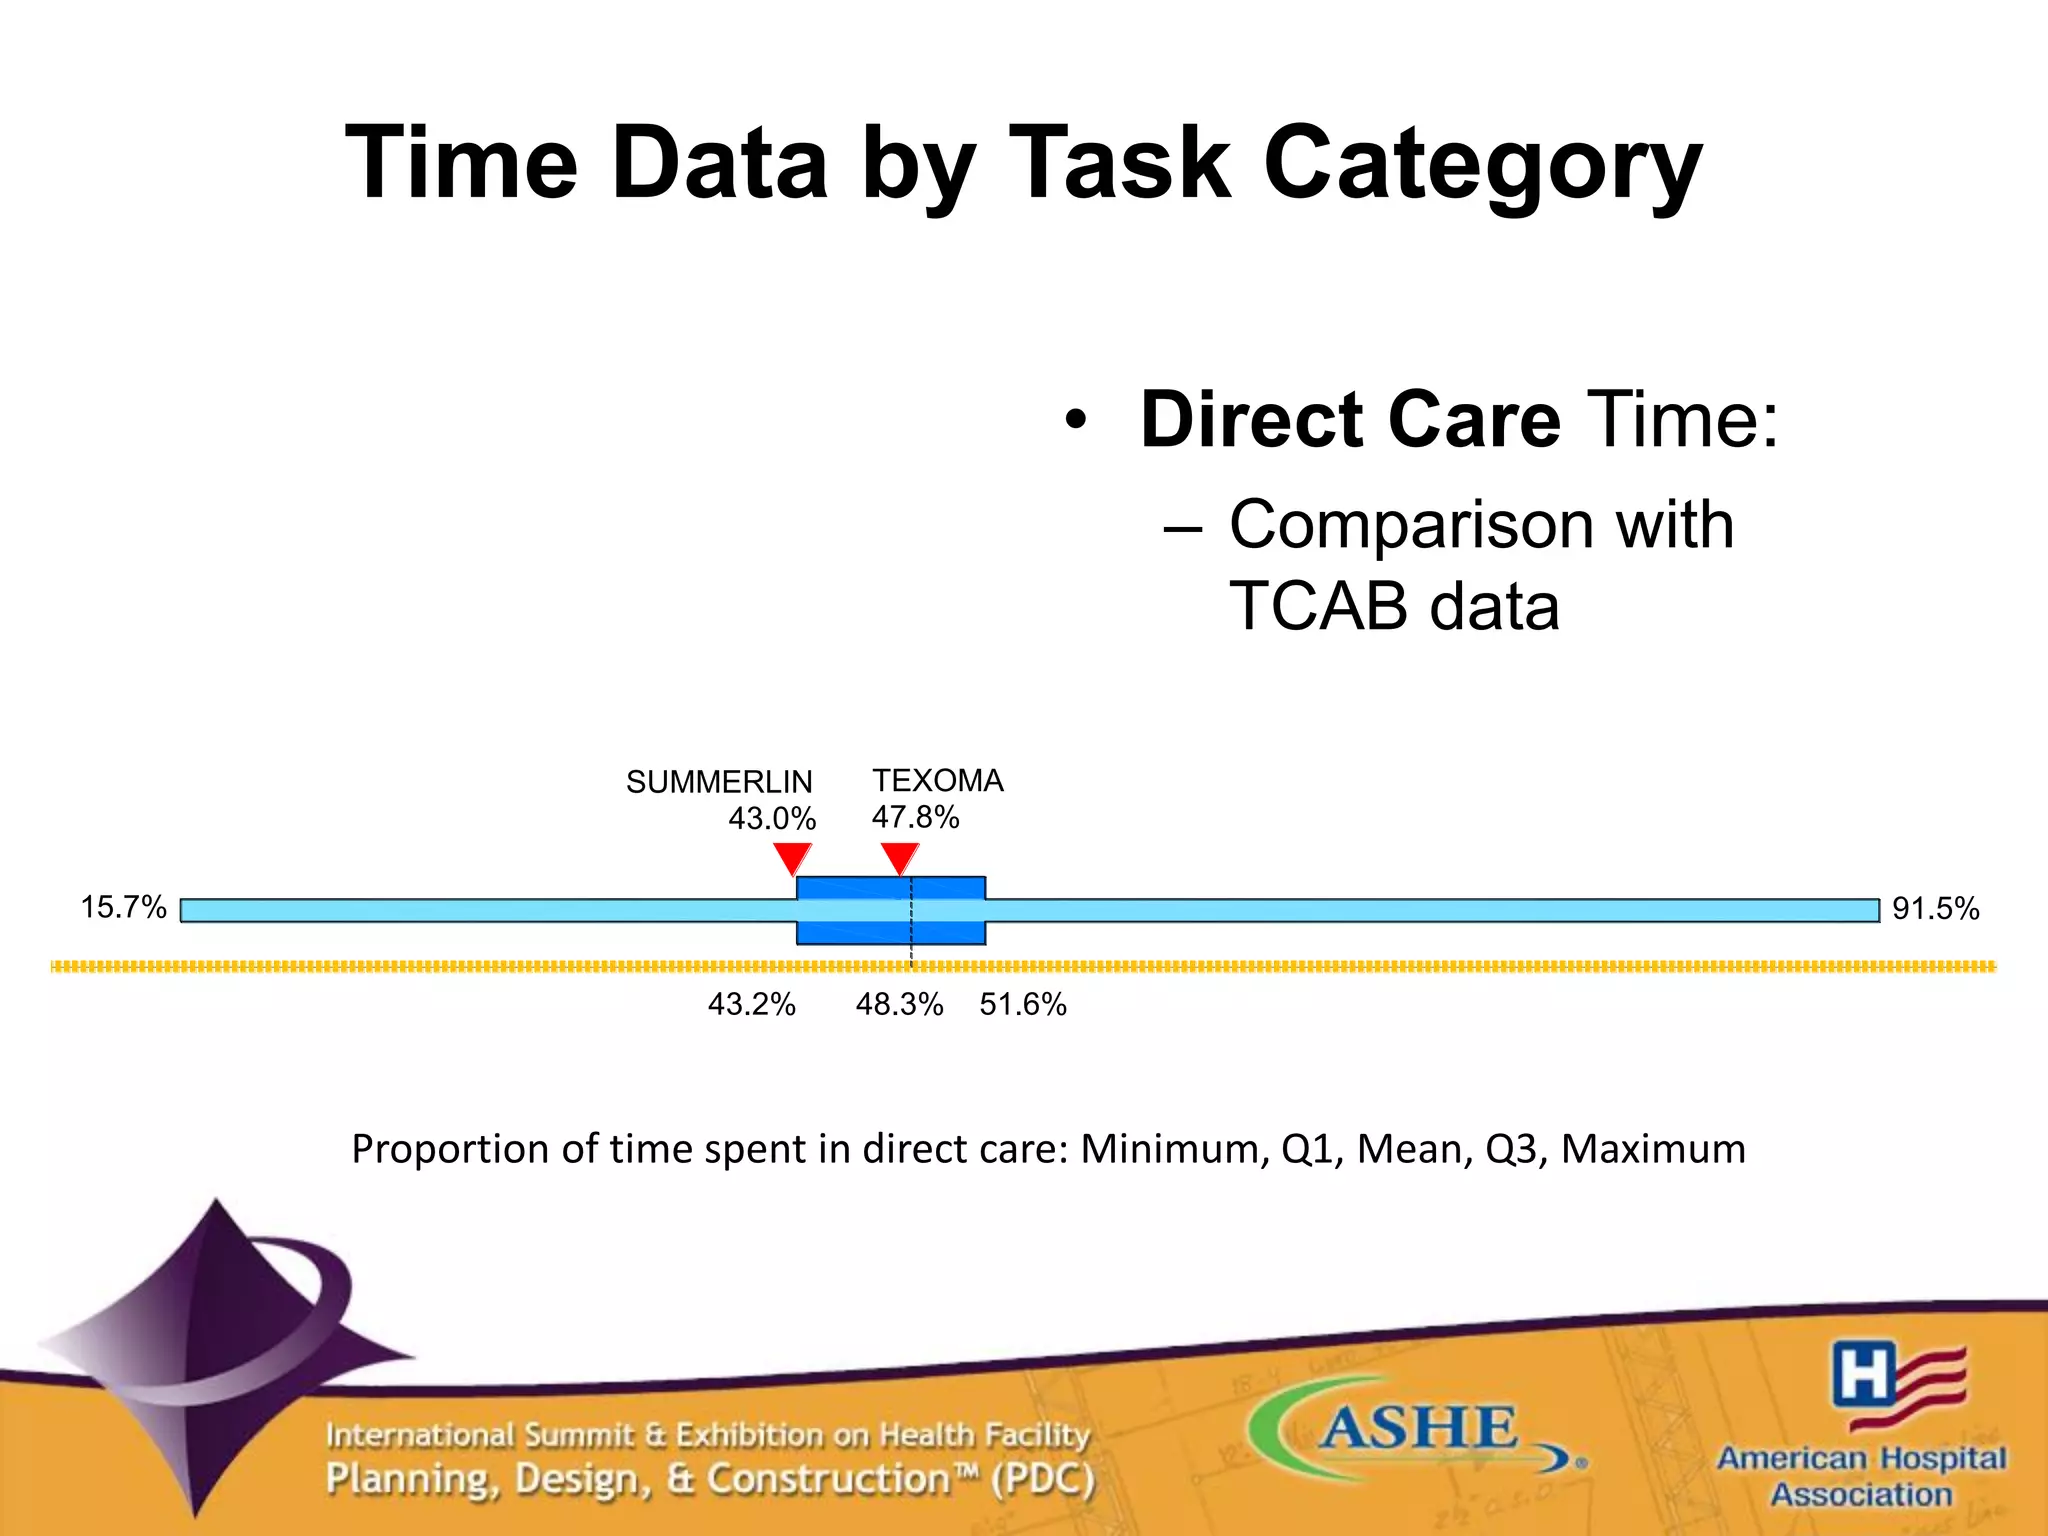

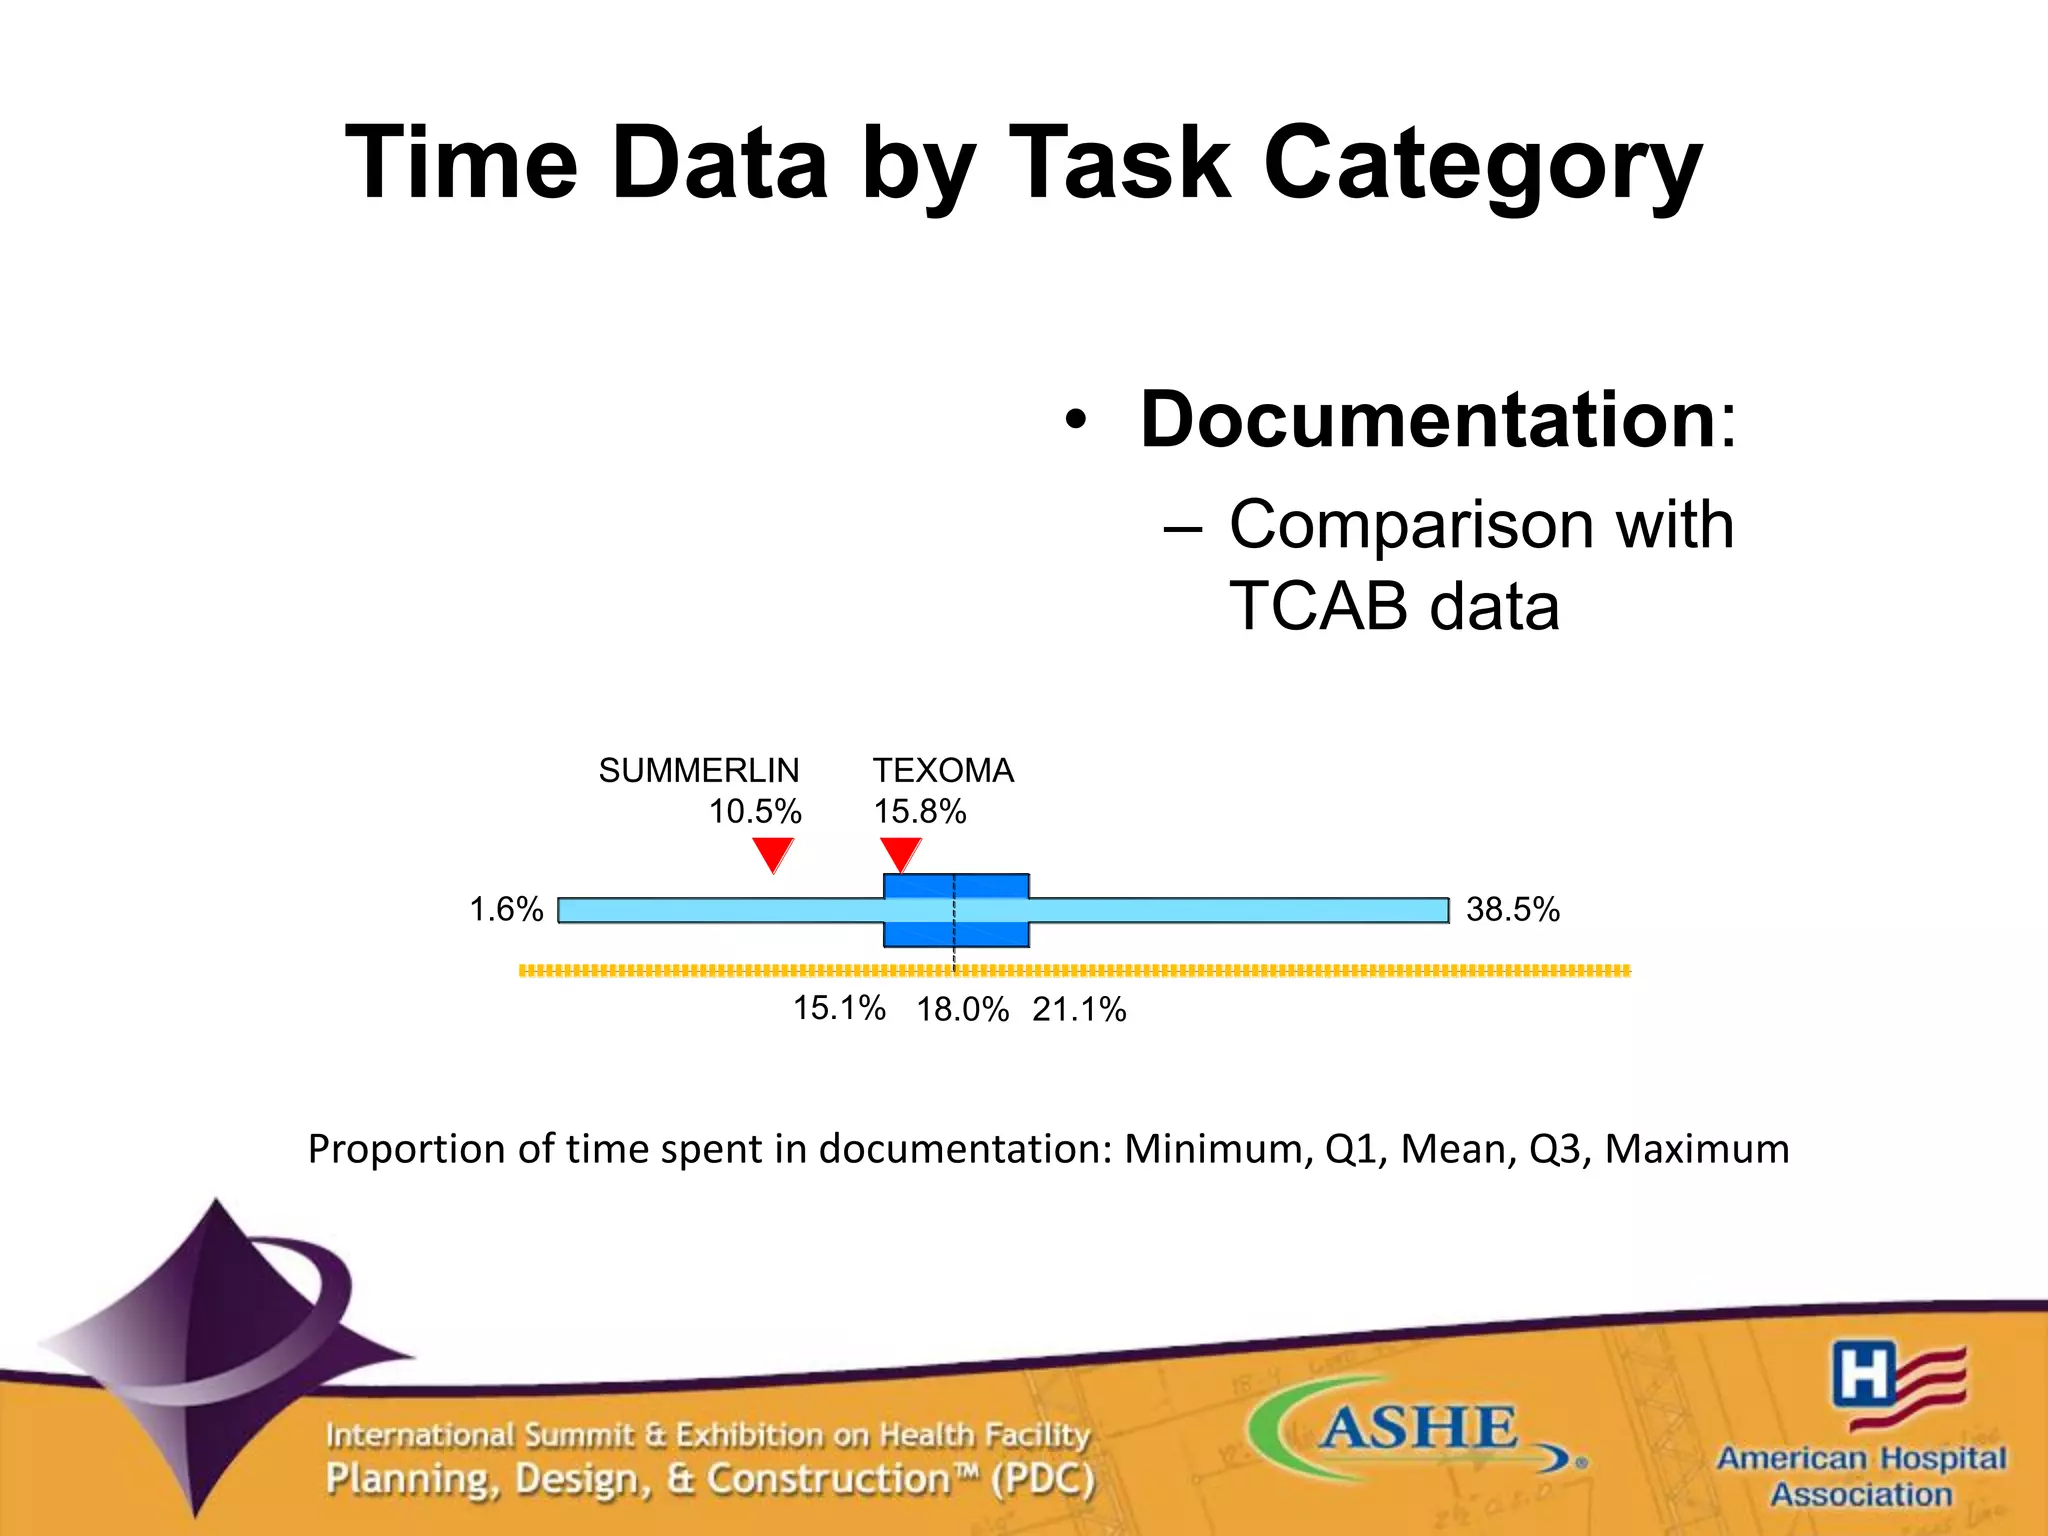
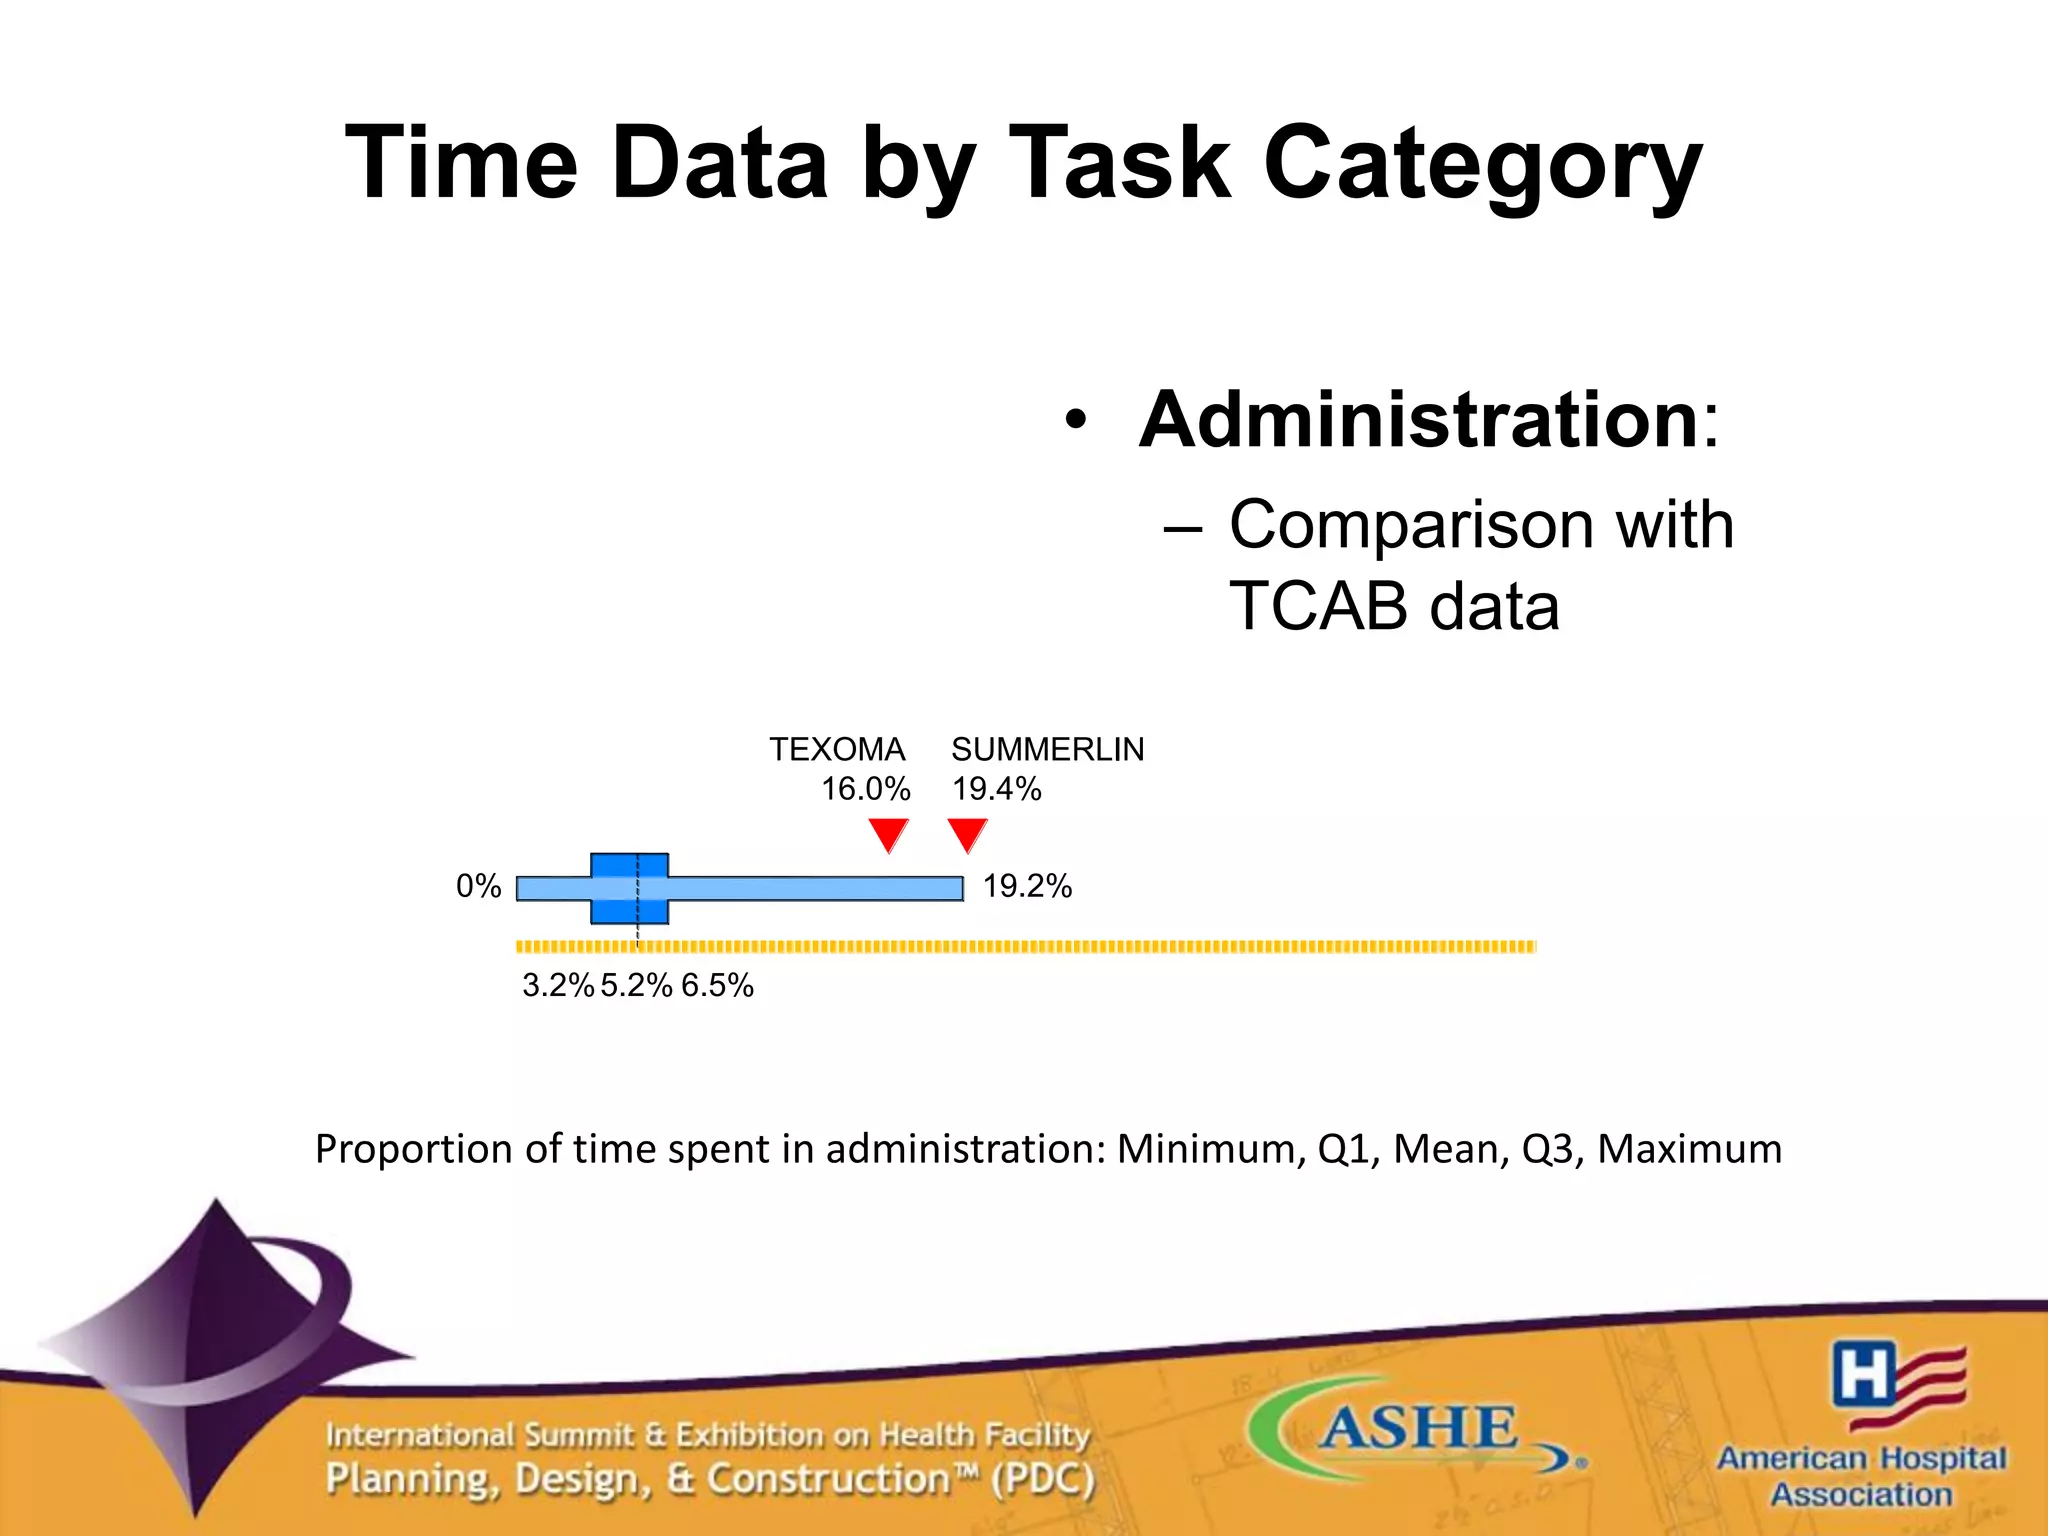
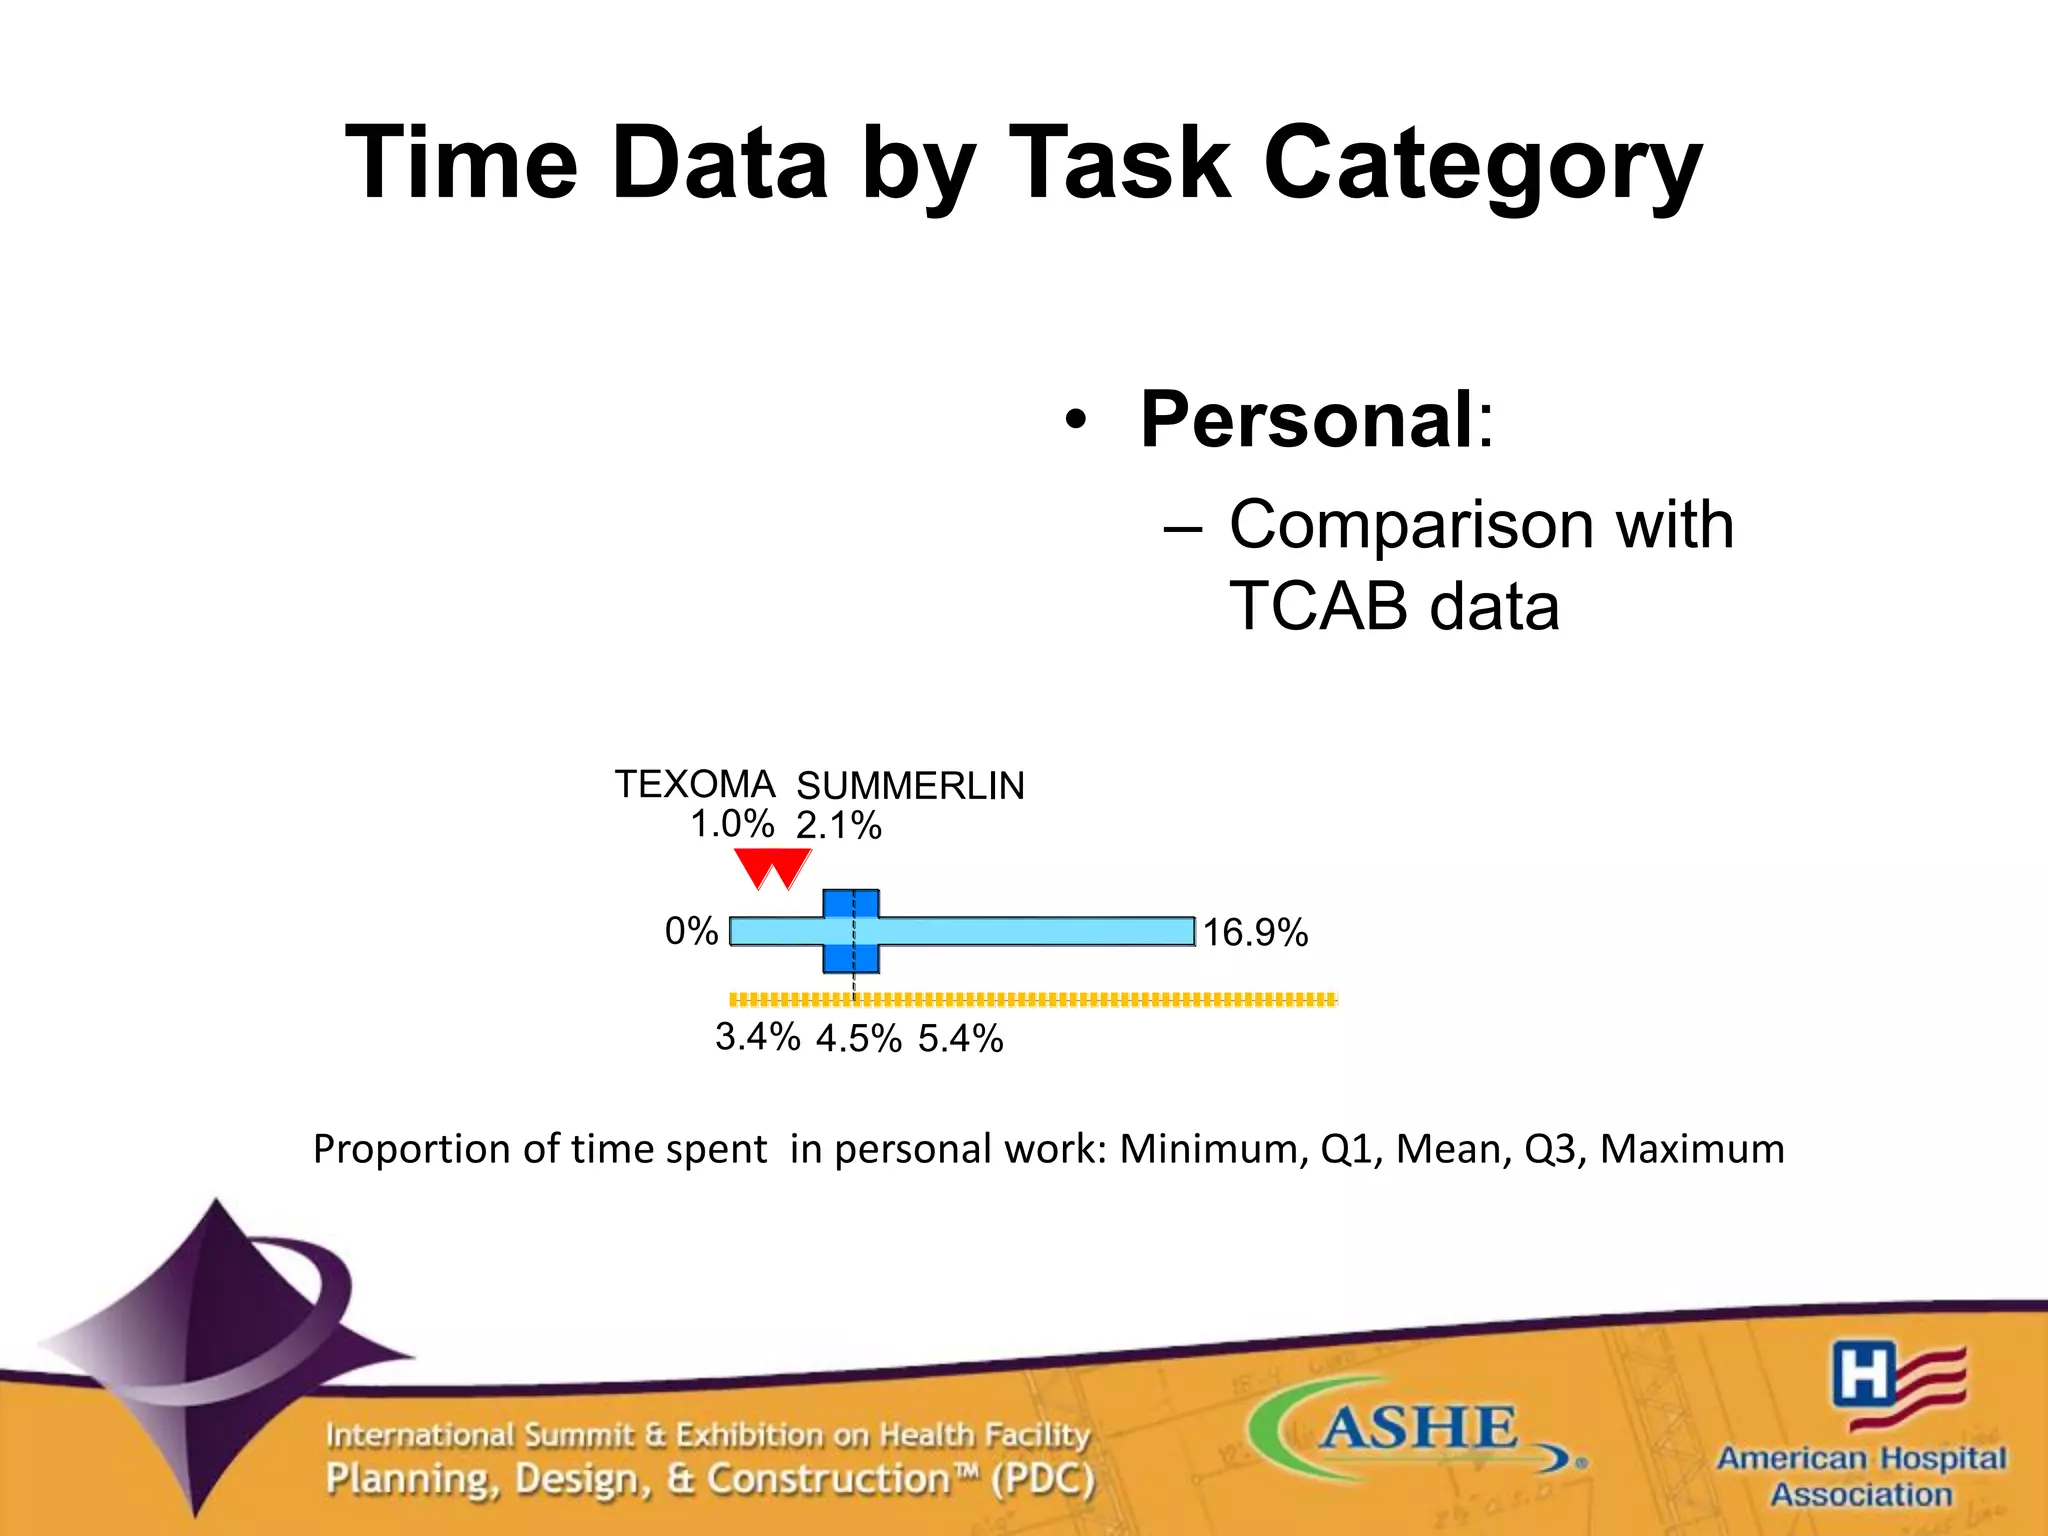
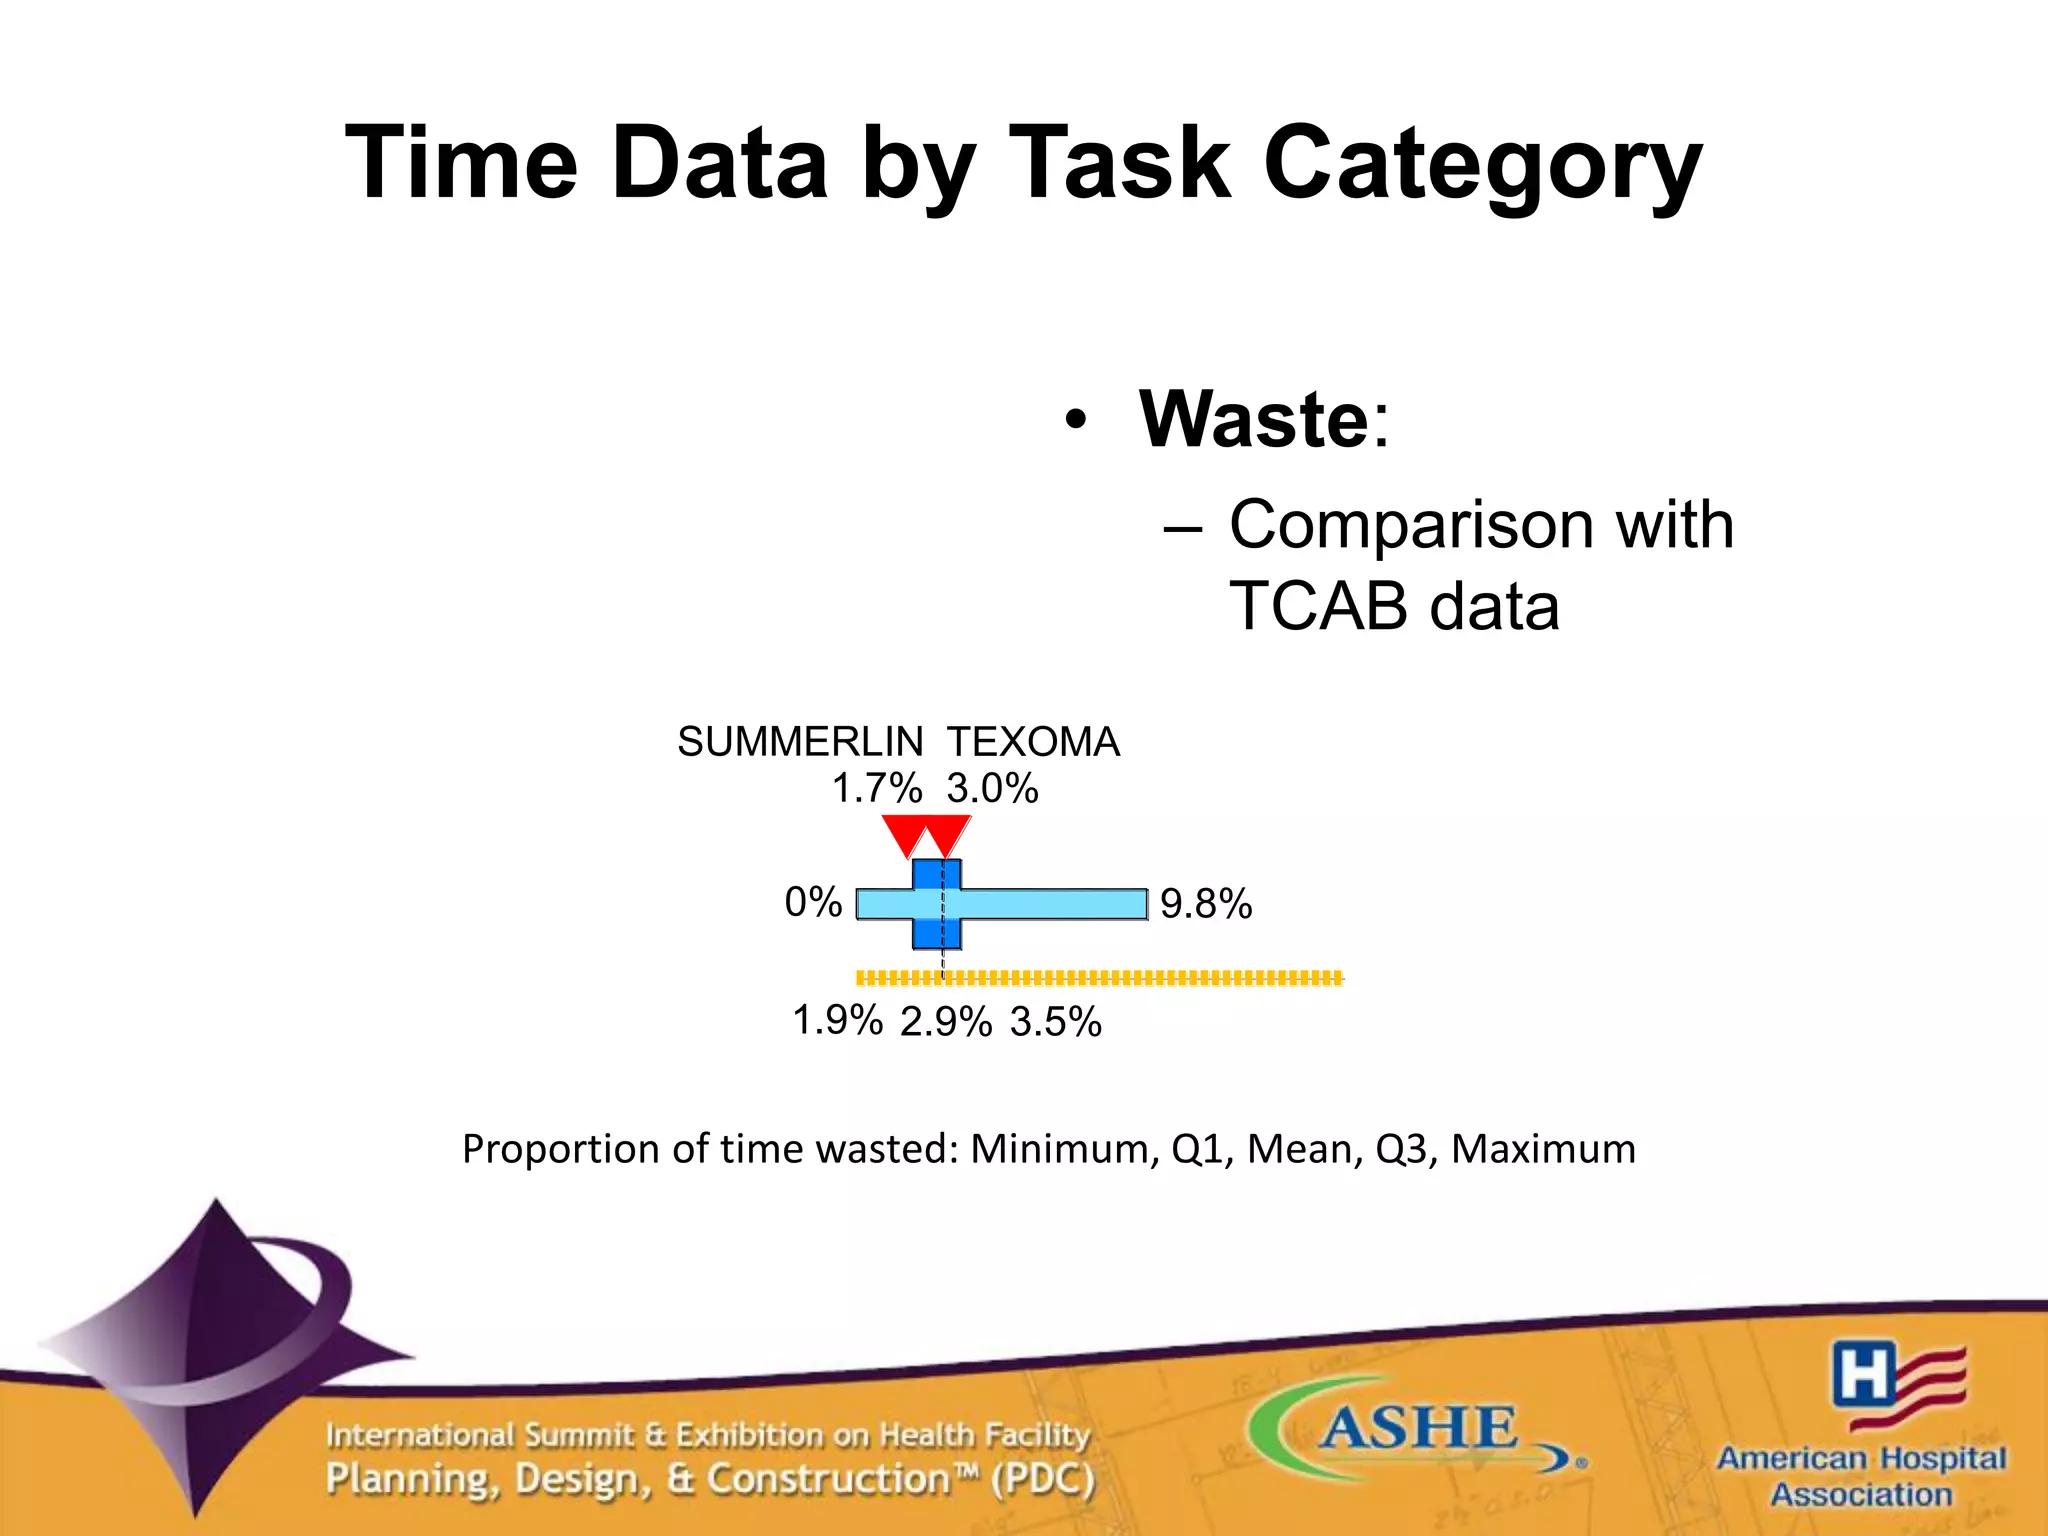
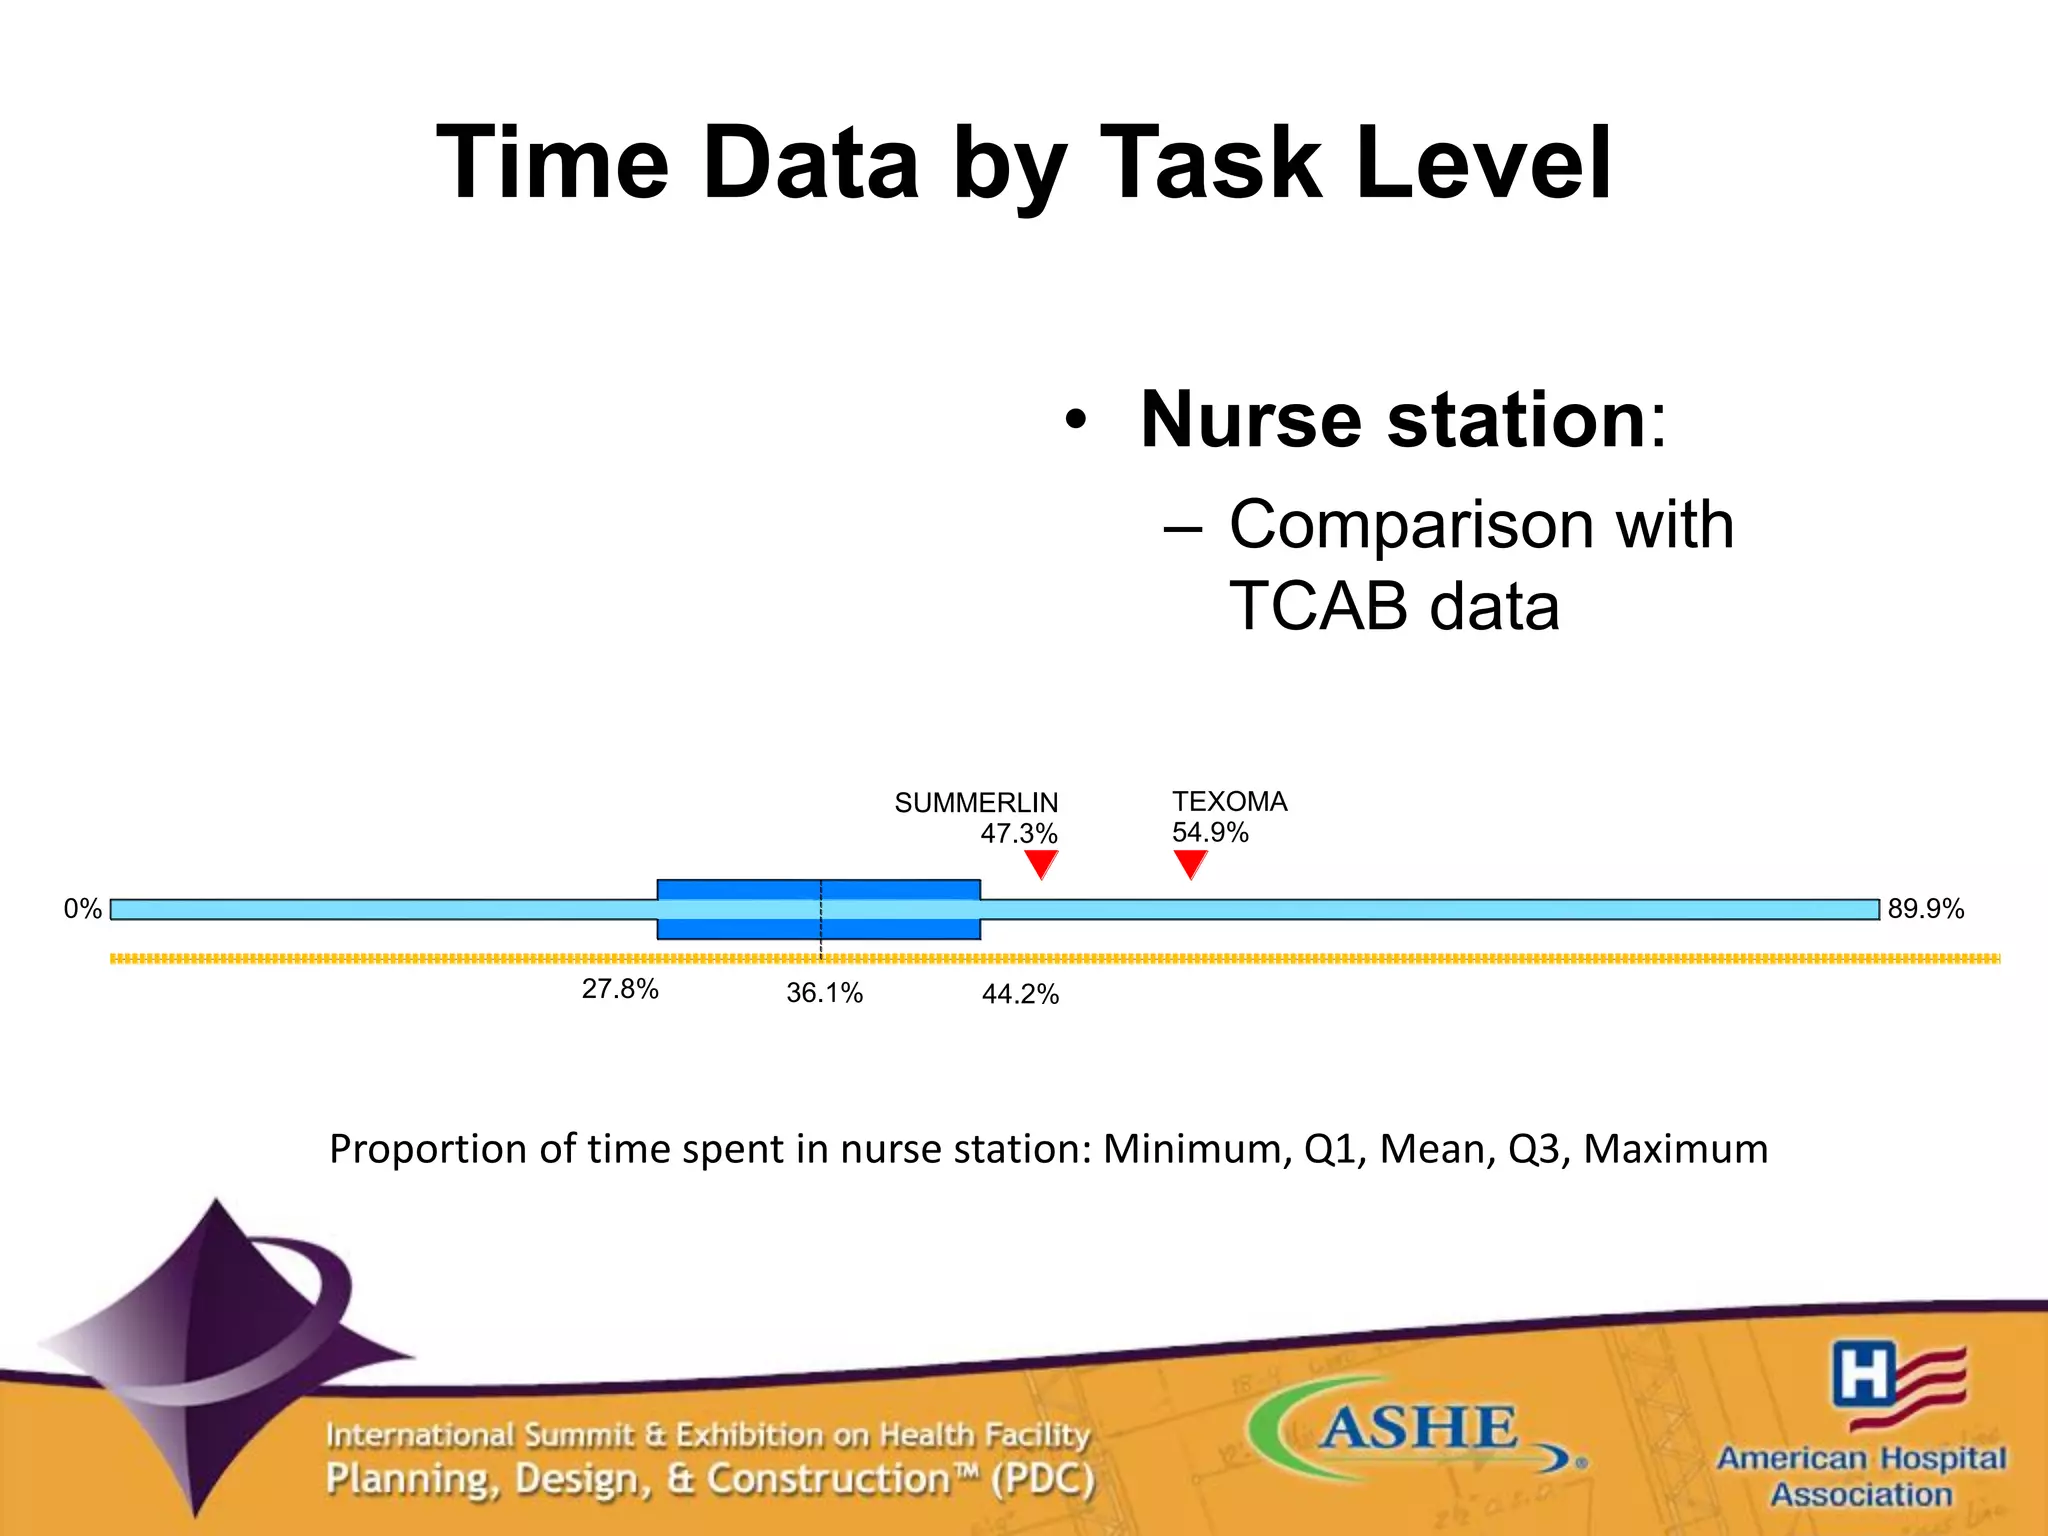
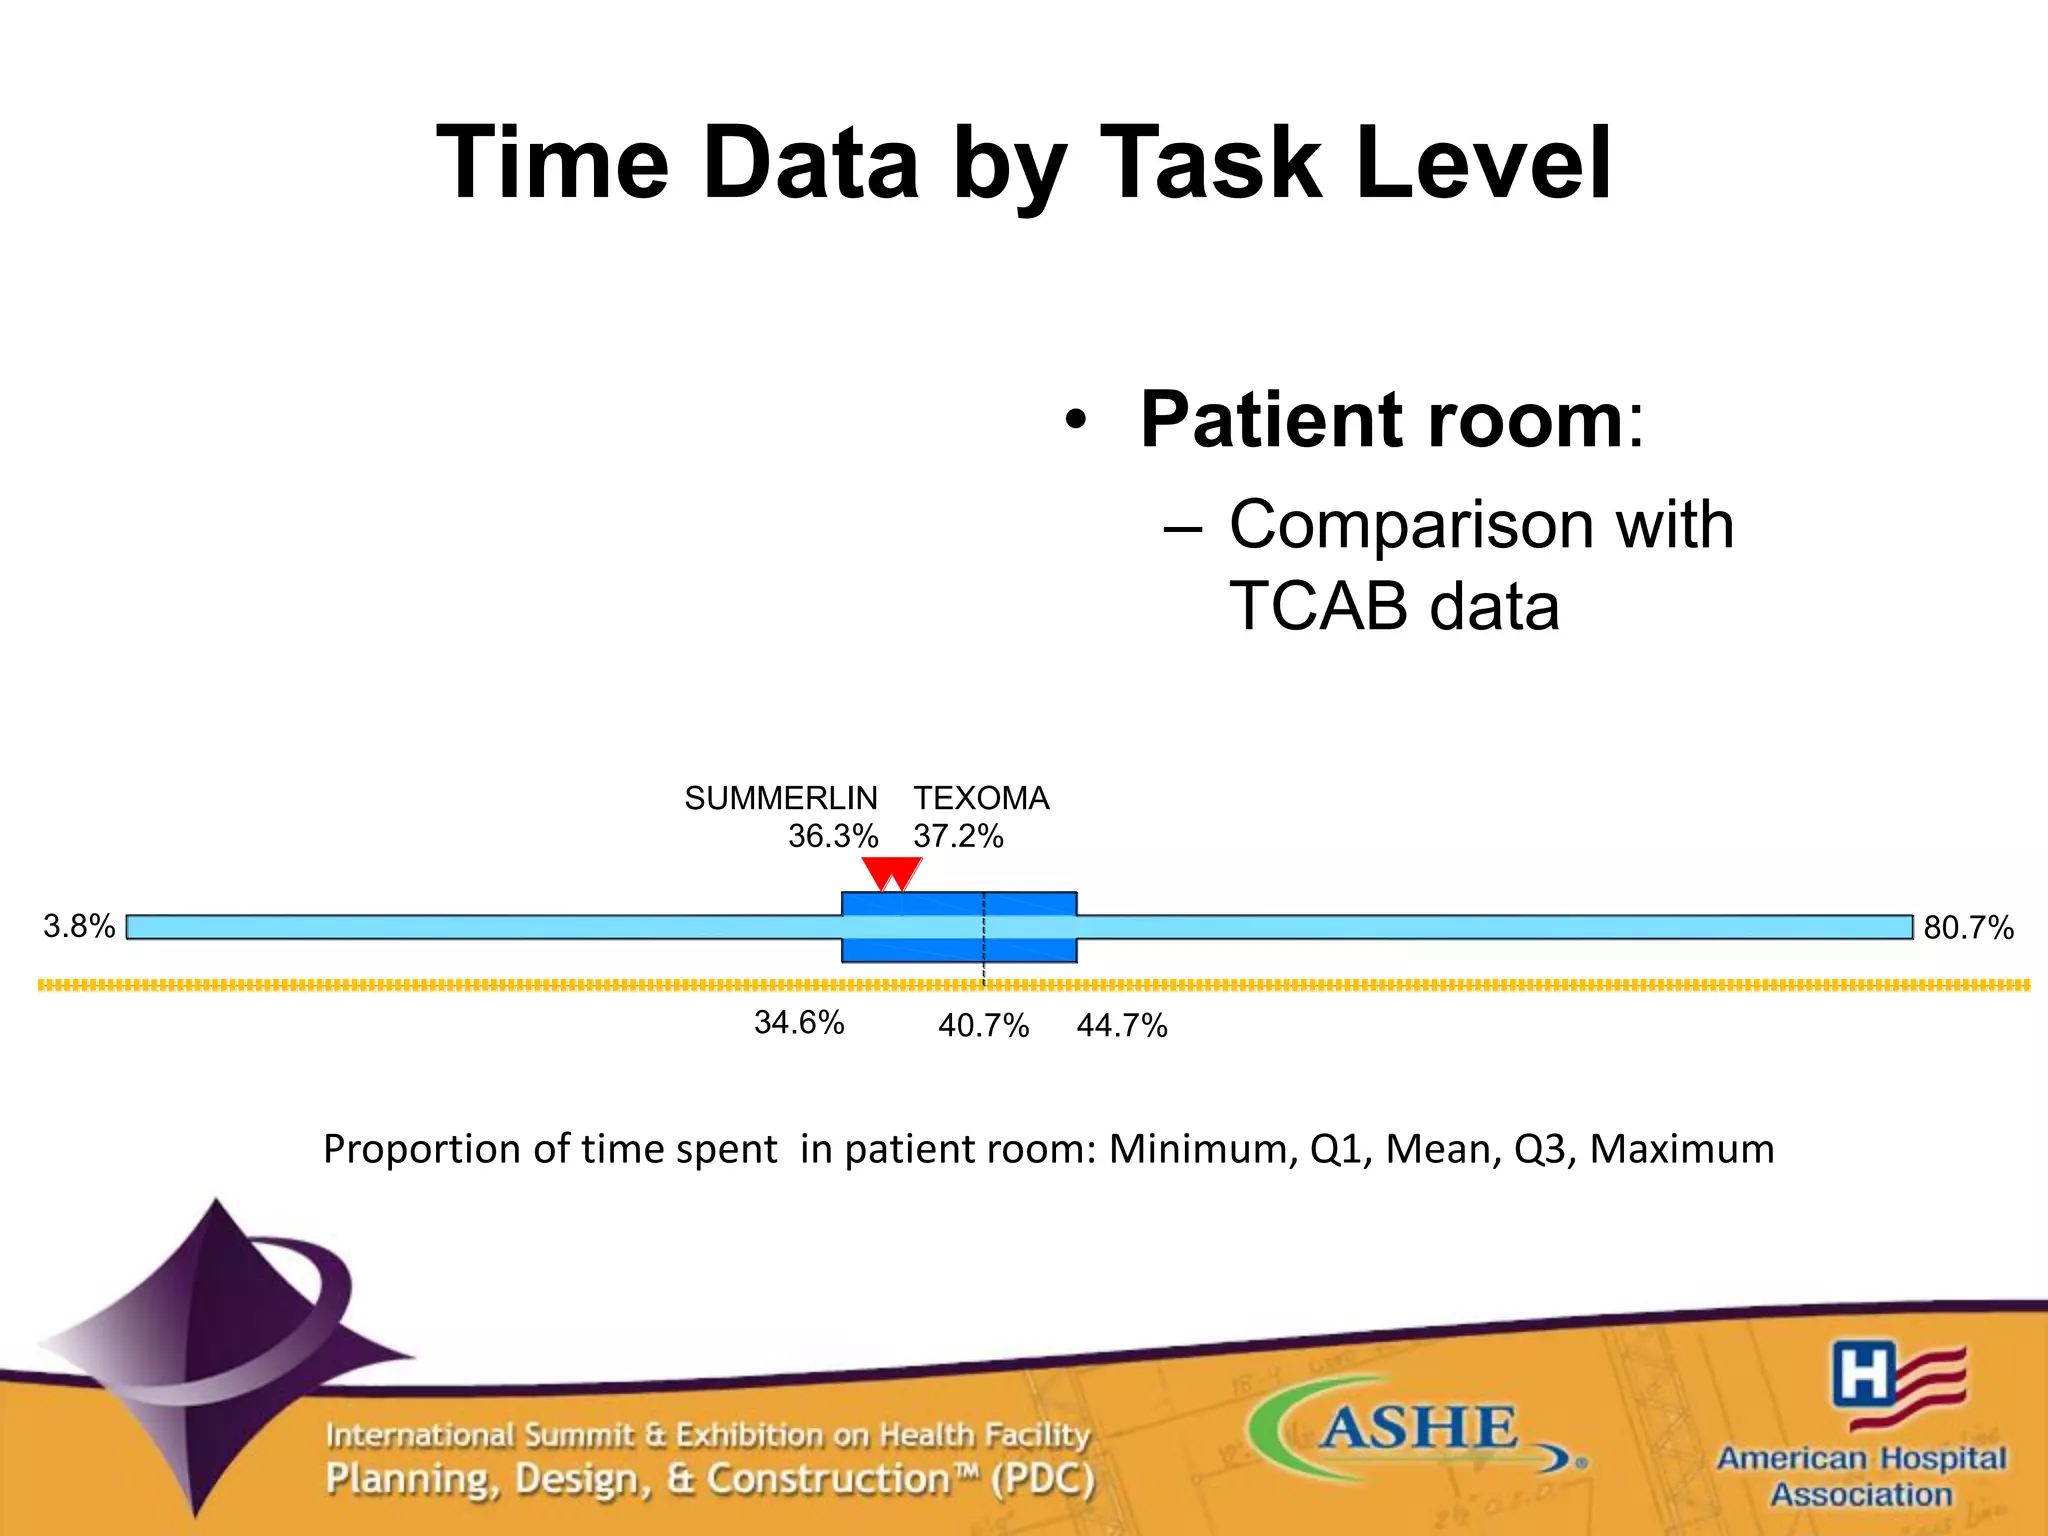
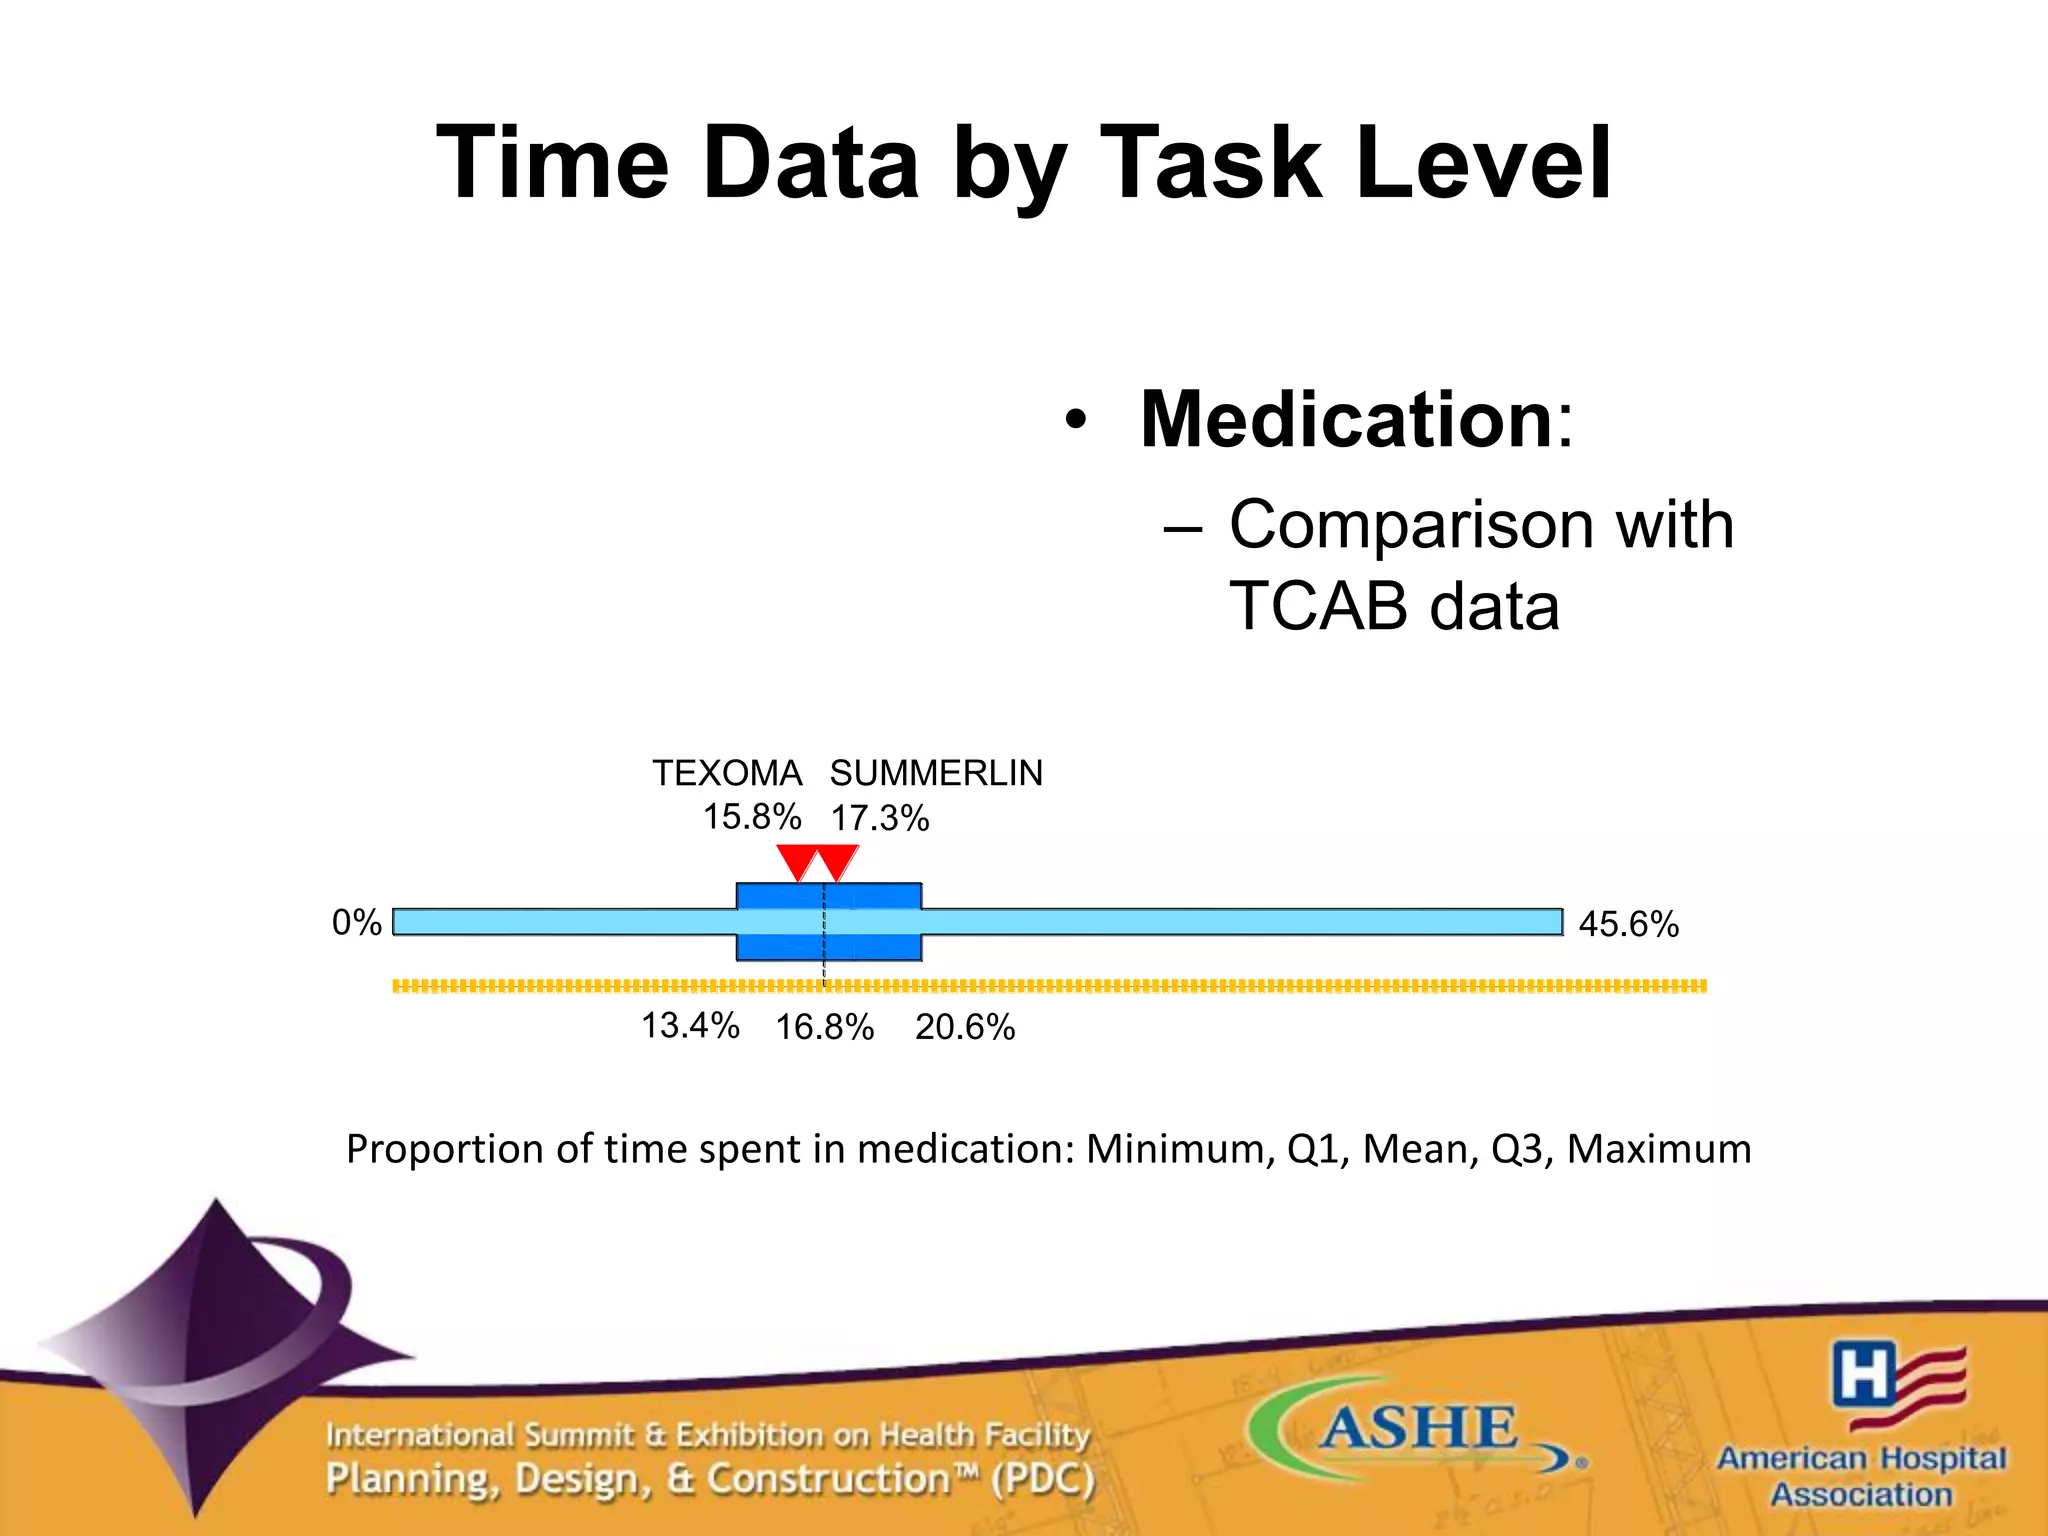
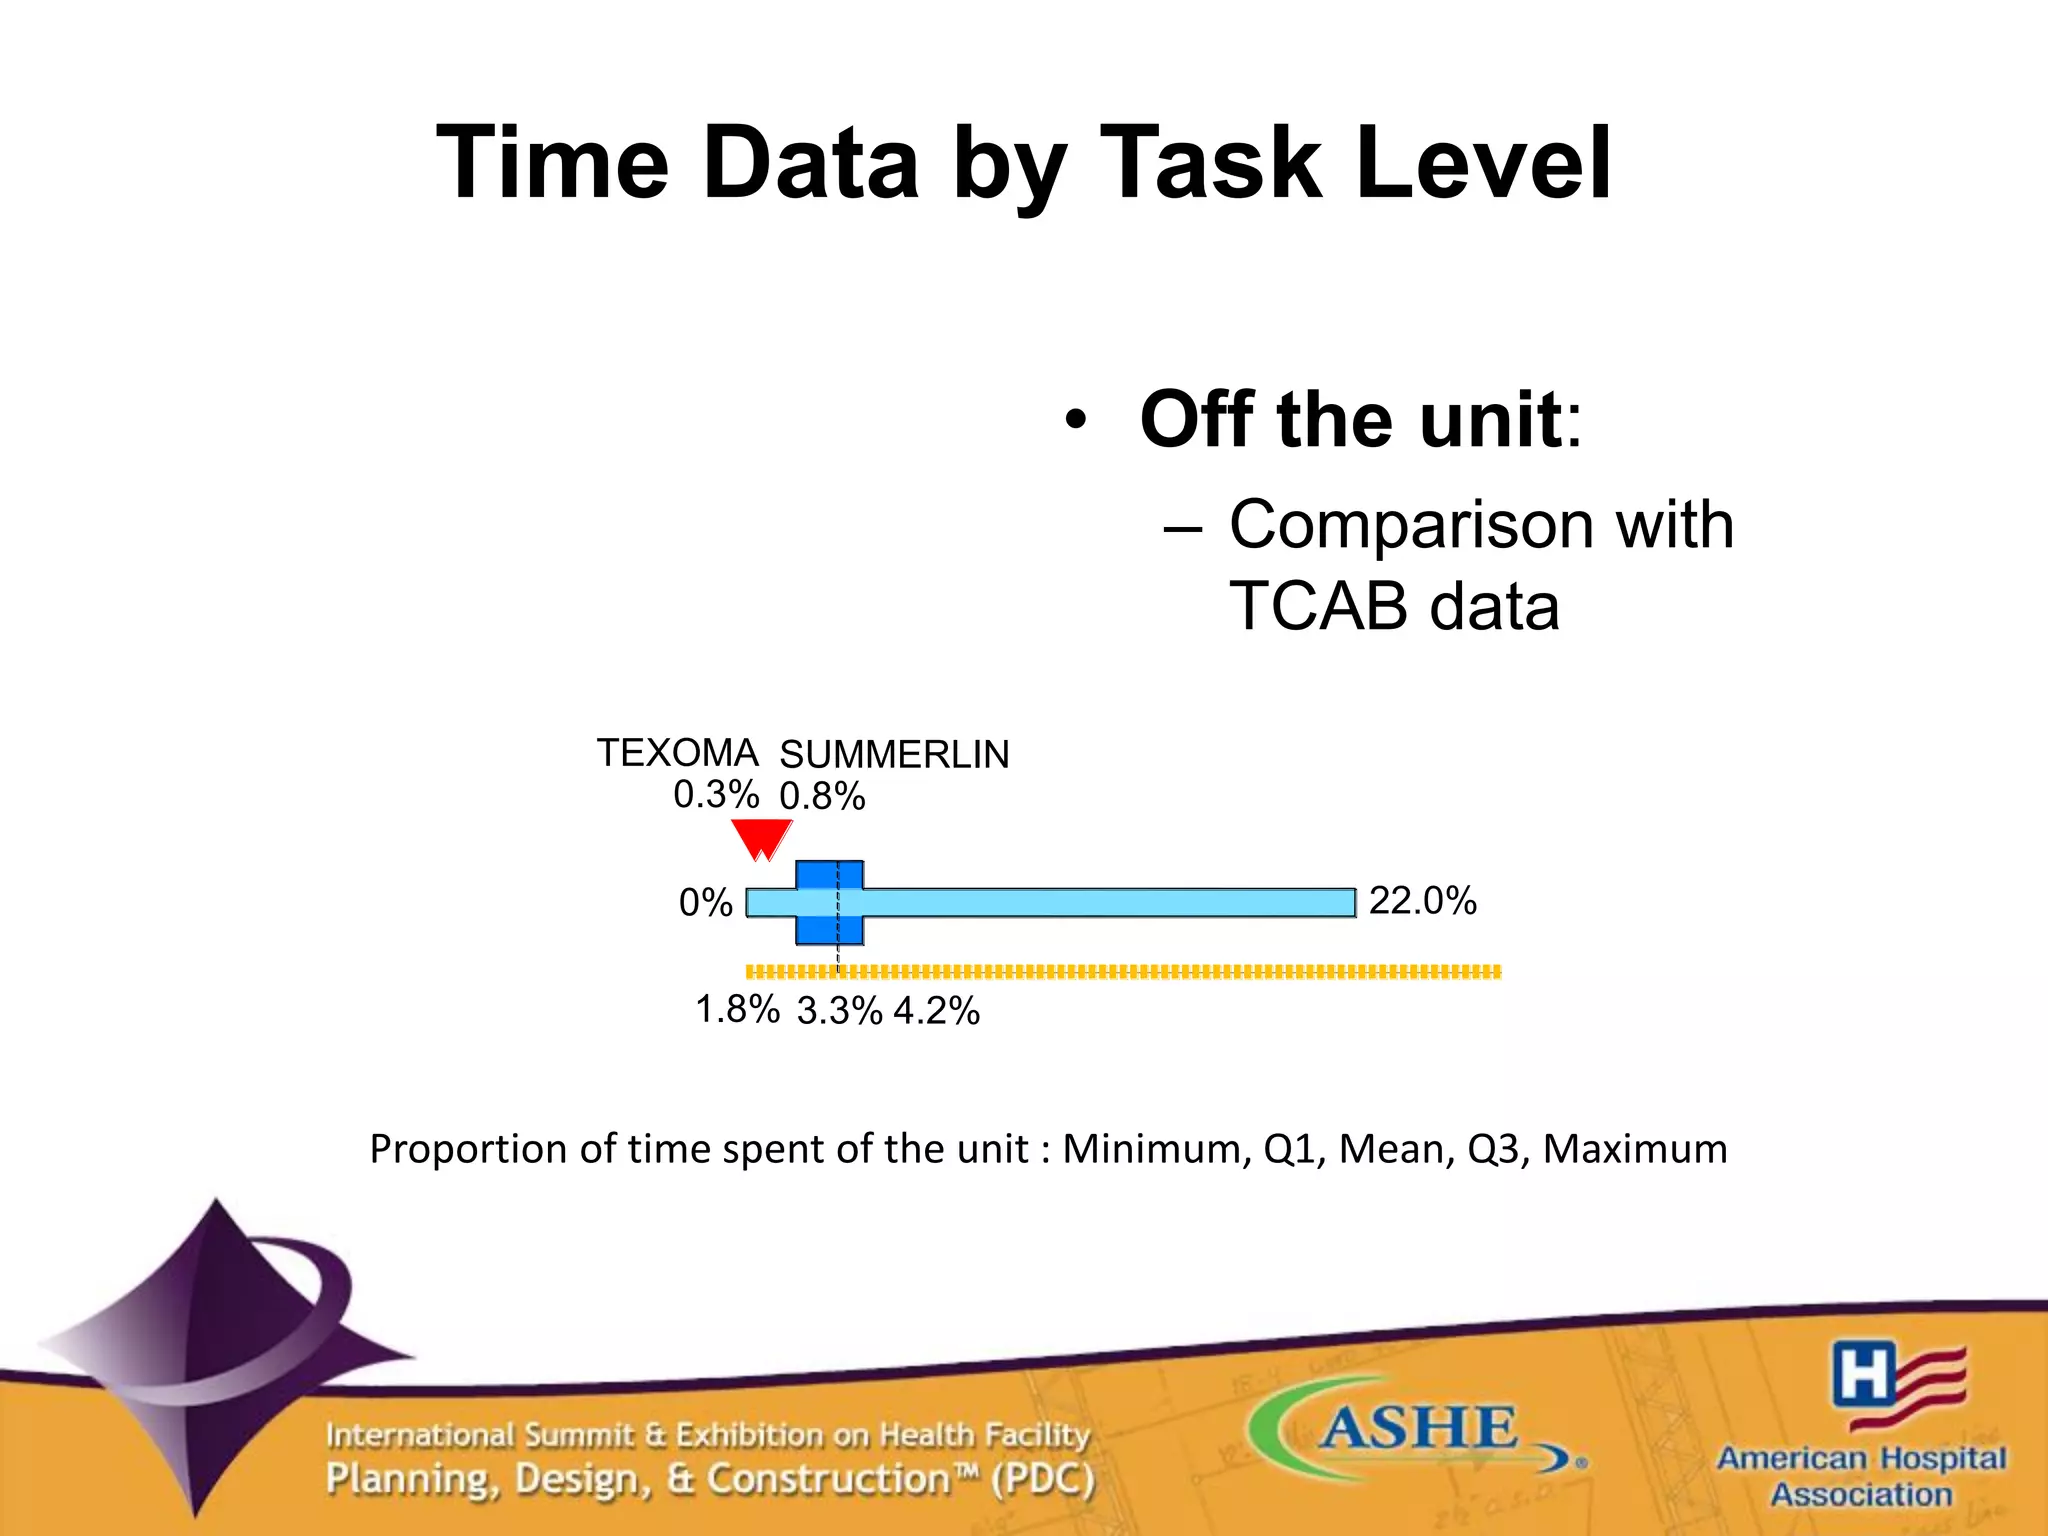
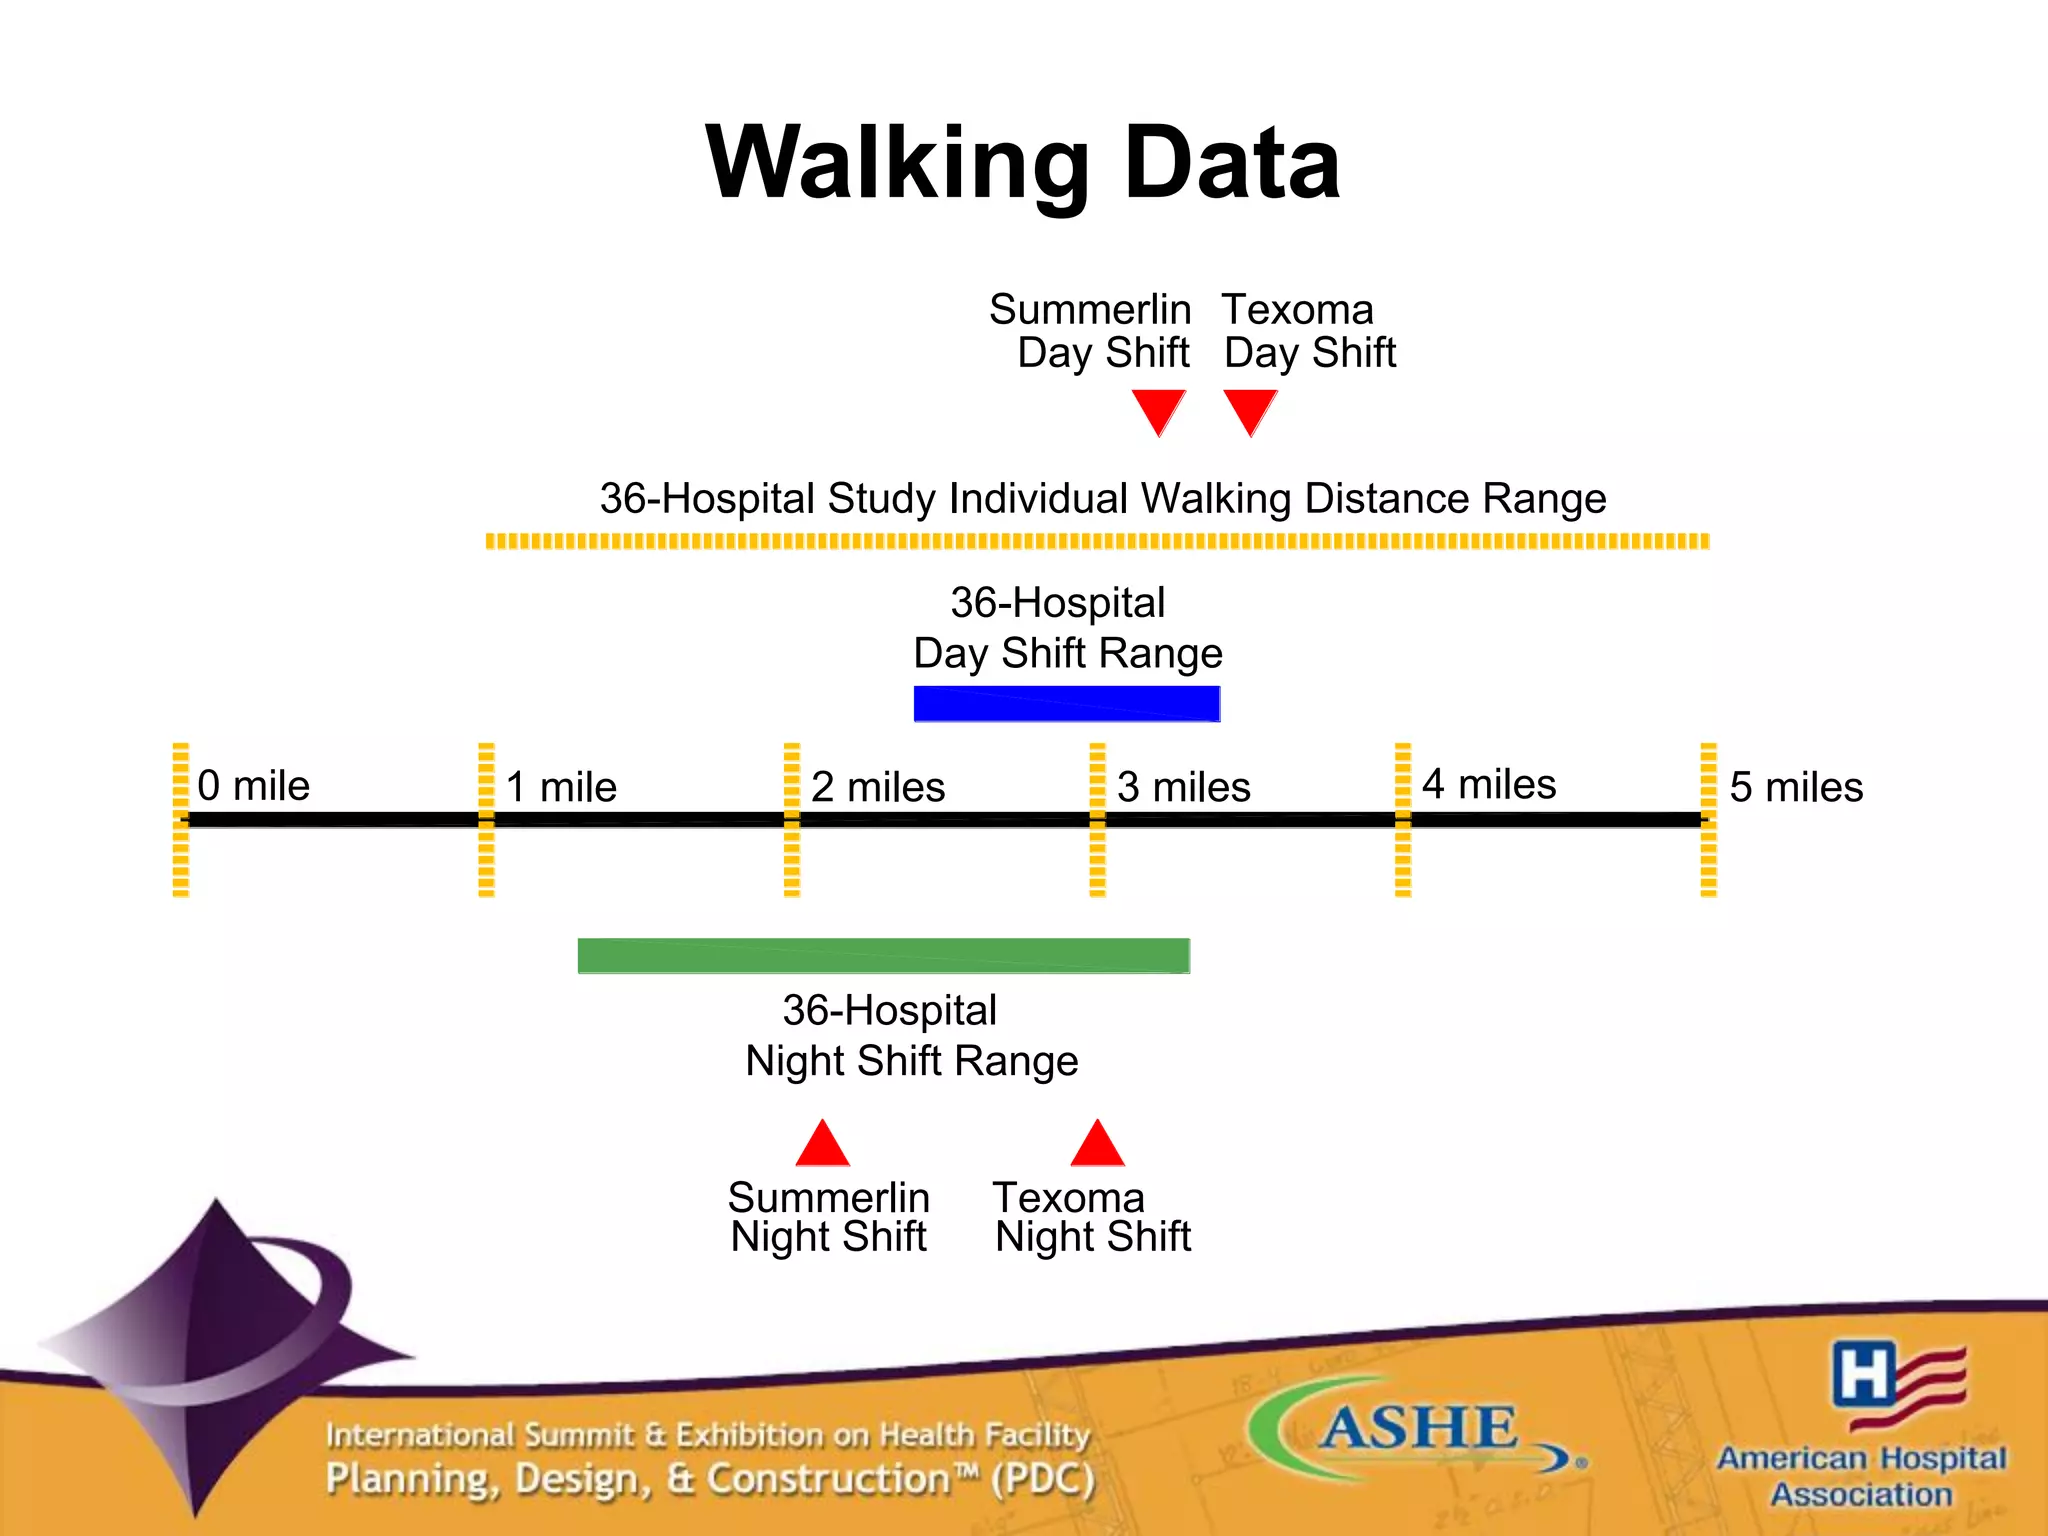


The document discusses how larger inpatient bed units can be designed to efficiently use nursing time through optimized flow and reduced walking distances. Two case studies, Summerlin Hospital and Texoma Medical Center, incorporated racetrack unit designs that reduced travel distances and times spent walking compared to national benchmarks. Post-occupancy data found the units' time distributions across tasks and activities, as well as walking distances, were similar to other top performing hospitals, demonstrating how larger bed counts can be achieved without compromising efficiency.


![[BROCHURE] Italy Tour Project | @SlideON](https://cdn.slidesharecdn.com/ss_thumbnails/brochure8-251215152319-2805af68-thumbnail.jpg?width=640&height=640&fit=bounds)


