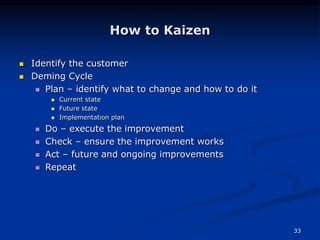
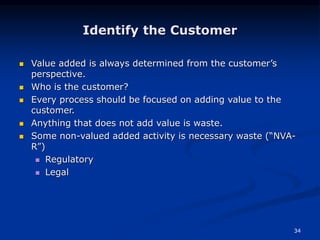
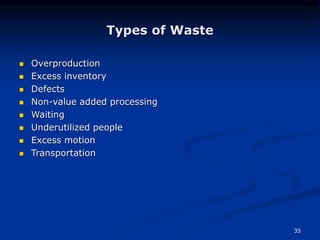
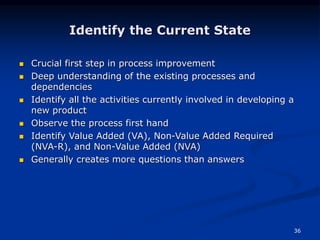
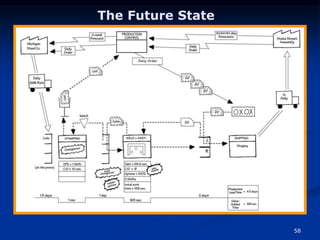
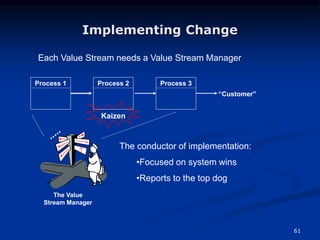
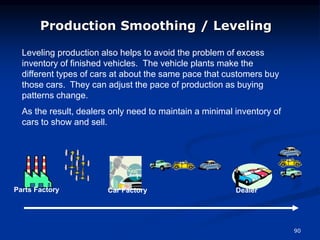
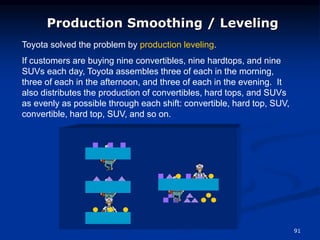
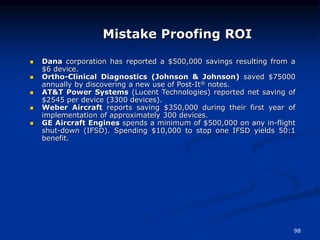
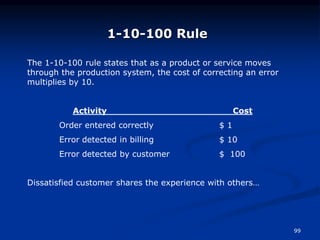
The document provides a comprehensive overview of lean manufacturing, focusing on principles such as waste elimination, continuous improvement, and enhancing customer value. It details various tools and methodologies within lean practices like 5S, value stream mapping, and kaizen, emphasizing their benefits in reducing costs, improving quality, and boosting employee morale. Additionally, it discusses challenges to implementation and the critical role of leadership in transforming organizational culture towards lean principles.


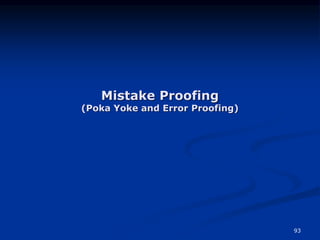
![100
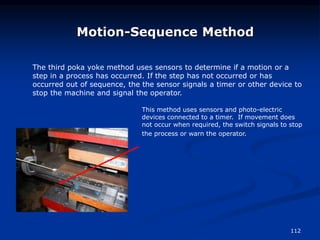
The difficulties with human error
Why existing tools are not enough
Motorola findings:
...it became evident early in the project that achieving a Cp
greater than 2 would go only part of the way. Mistake-
proofing the design would also be required ... Mistake-
proofing the design is an essential factor in achieving the
[total number of defects per unit] goal.
Smith, B. IEEE Spectrum 30(9) 43-47](https://image.slidesharecdn.com/leanmanufacturingshortversion-240716060925-e1658d65/85/Lean_Manufacturing_Short-vvvVersion-pptx-100-320.jpg)